. 2024 Mar 26;121(13):e2306814121.
doi: 10.1073/pnas.2306814121. Epub 2024 Mar 21.

Activation of ERβ hijacks the splicing machinery to trigger R-loop formation in triple-negative breast cancer

Affiliations

Activation of ERβ hijacks the splicing machinery to trigger R-loop formation in triple-negative breast cancer

Dongfang Wang et al. Proc Natl Acad Sci U S A. .

Abstract

Triple-negative breast cancer (TNBC) is a subtype of breast cancer with aggressive behavior and poor prognosis. Current therapeutic options available for TNBC patients are primarily chemotherapy. With our evolving understanding of this disease, novel targeted therapies, including poly ADP-ribose polymerase (PARP) inhibitors, antibody-drug conjugates, and immune-checkpoint inhibitors, have been developed for clinical use. Previous reports have demonstrated the essential role of estrogen receptor β (ERβ) in TNBC, but the detailed molecular mechanisms downstream ERβ activation in TNBC are still far from elucidated. In this study, we demonstrated that a specific ERβ agonist, LY500307, potently induces R-loop formation and DNA damage in TNBC cells. Subsequent interactome experiments indicated that the residues 151 to 165 of U2 small nuclear RNA auxiliary factor 1 (U2AF1) and the Trp439 and Lys443 of ERβ were critical for the binding between U2AF1 and ERβ. Combined RNA sequencing and ribosome sequencing analysis demonstrated that U2AF1-regulated downstream RNA splicing of 5-oxoprolinase (OPLAH) could affect its enzymatic activity and is essential for ERβ-induced R-loop formation and DNA damage. In clinical samples including 115 patients from The Cancer Genome Atlas (TCGA) and 32 patients from an in-house cohort, we found a close correlation in the expression of ESR2 and U2AF1 in TNBC patients. Collectively, our study has unraveled the molecular mechanisms that explain the therapeutic effects of ERβ activation in TNBC, which provides rationale for ERβ activation-based single or combined therapy for patients with TNBC.

Keywords: ERβ; nuclear receptors; triple-negative breast cancer.


Conflict of interest statement

Competing interests statement:The authors declare no competing interest.

Figures
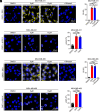
Fig. 1.
Fig. 1.
ERβ agonist promotes R-loop formation and DNA damage in TNBC. (A) IF staining of S9.6 in MDA-MB-231 cell growing on the glass slides. Cells were treated by DMSO, 5 μM LY500307, or 10 μM LY500307. Nuclei were stained with DAPI (blue), and the R-loop was stained with S9.6 (yellow). (Scale bar, 40 μm.) (B) Statistical analysis of the S9.6 level in MDA-MB-231 cells. Data were shown as mean ± SD and individual values (n = 5 for each group). (C) IF staining of γH2A.X in MDA-MB-231 cells growing on the glass slides. Cells were treated by DMSO, 5 μM LY500307, or 10 μM LY500307. Nuclei were stained with DAPI (blue), and DNA damage was represented by γH2A.X staining (yellow). (Scale bar, 40 μm.) (D) Statistical analysis of the γH2A.X level in MDA-MB-231 cells. Data were shown as mean ± SD and individual values (n = 5 for each group). (E) IF staining of S9.6 in MDA-MB-468 cell growing on the glass slides. Cells were treated by DMSO, 5 μM LY500307, or 10 μM LY500307. Nuclei were stained with DAPI (blue), and the R-loop was stained with S9.6 (yellow). (Scale bar, 40 μm.) (F) Statistical analysis of the S9.6 level in MDA-MB-468. Data were shown as mean ± SD and individual values (n = 5 for each group). (G) IF staining of γH2A.X in MDA-MB-468 cells growing on the glass slides. Cells were treated by DMSO, 5 μM LY500307, or 10 μM LY500307. Nuclei were stained with DAPI (blue), and DNA damage was represented by γH2A.X (yellow). (Scale bar, 40 μm.) (H) Statistical analysis of the γH2A.X level in MDA-MB-468. Data were shown as mean ± SD and individual values (n = 5 for each group). ****P < 0.0001, ns: no significance.
Fig. 2.
Fig. 2.
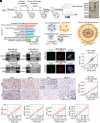
U2AF1 participates in ERβ activation effects. (A) Procedures of the IP-MS experiment: 1) lysing cells to obtain protein sample; 2) adding anti-ERβ antibody for binding to ERβ; 3) adding protein A/G beads for binding to antibodies; 4) washing and elution of samples; 5) purifying ERβ-binding proteins; and 6) silver staining and LC-MS analysis. (B) Silver staining results of IP samples involving Erβ-binding proteins in the MDA-MB-231 cell line. The red arrow indicates U2AF1 (35 kD). (C) Bar plot of 943 ERβ-binding proteins enriched functional pathways in the MDA-MB-231 cell line. The X-axis represents the −log10(P value). The Y-axis displays the different pathways where genes are involved. (D) GO modules for the BP in the MDA-MB-231 cell line were visualized using EnrichmentMap in Cytoscape. (E) Functional protein association networks of the RNA splicing proteins in the MDA-MB-231 cell line were obtained from the STRING database. The gradient of the dot color represents the PPI combined score between U2AF1 and others. (F) IP verification of the binding between ERβ and U2AF1 in MDA-MB-231 and MDA-MB-468 cell lines. Anti-Flag blots were performed as a control for each experiment. (G) Images taken by confocal microscopy. Nuclei were stained with DAPI (blue). ERβ was shown in green, and U2AF1 was shown in red. White short arrows indicate colocation of ERβ and U2AF1 in nuclei. (Scale bar: 10 μm.) (H) Correlation analysis results of ESR2 and U2AF1 expression in the TNBC dataset of TCGA (TCGAbiolinks, n = 115). (I) Images of immunohistochemical staining results of clinical tumor sections from TNBC patients (n = 32). High-expressing tumor images were shown above, while low-expressing tumor images were shown below. Red short arrows address the positive cells. (Scale bar, 40 μm.) (J) Correlation analysis results of ERβ and U2AF1 expression in immunohistochemical staining data of TNBC patients’ tumor sections. (K) Correlation analysis results involving comparison between ERβ and γH2A.X, ERβ and S9.6, U2AF1 and γH2A.X, and U2AF1 and S9.6 in IHC data of TNBC patients’ tumor sections.
Fig. 3.
Fig. 3.
ERβ-U2AF1-binding sites. (A) The crystal structure of the U2AF1 monomer (PDB code 7c06) and ERβ monomer (PDB code 1l2j). (B) The docking model displayed a potential complex formation between the U2AF1 monomer and the ERβ monomer. The peptide regions spanning in U2AF1 helices (red) and ERβ helices (orange) were predicted to interact with each other. (C) Highlighted putative regions and residues in Trp439 and Lys443 (shown in orange) involved in the interaction with the 151 to 165 amino acid (shown in red) of U2AF1. (D) Electrostatic surface view of ERβ showed that U2AF1 was bound in a positively charged channel (blue: positively charged region; red: negatively charged region). (E) A diagram of ERβ and U2AF1 domains. (F) MDA-MB-231 cells were transfected with plasmids that deactivated the predicted binding sites of either ERβ or U2AF1. Cell lysates without adding antibodies or beads were used as the input. Cell lysates were incubated with IgG as the negative control and antibodies against FLAG as the experimental group.
Fig. 4.
Fig. 4.
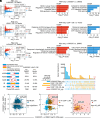
U2AF1 regulates OPLAH alternative splicing. (A) Volcano plot represents the differential analysis of gene expression (LY500307 group vs. DMSO group). (B) Horizontal bar graphs represent the most differential pathways. Functional enrichment of genes with higher (Left) and lower (Right) expression in the LY500307 group relative to the DMSO group. (C) The volcano plot represents the differential analysis of genes expression (U2AF1 OE vs. vector). (D) The horizontal bar graphs represent the most differential pathways. Functional enrichment of genes higher (Left) and lower (Lower) expression in the U2AF1 OE group relative to the vector group. (E) The volcano plot represents the differential analysis of genes translation efficiency (LY500307 vs. DMSO). (F) The horizontal bar graphs represent the most differential pathways. Functional enrichment of genes with higher (Left) and lower (Right) translation efficiency in the LY500307 group relative to the DMSO group. (G) Statistical diagram of alternative splicing types of differentially spliced genes in different groups. (H) UpSet plot of the intersection of the differential genes in different comparative analyses. (I) The scatter plot shows the gene screening process. Blue dots indicate significance in the results of the difference comparison (P < 0.05). Yellow dots indicate that the gene was up-regulated in the U2AF1 overexpression experiment relative to the control group. Red dots indicate significant differential splicing changes of the gene.
Fig. 5.
Fig. 5.
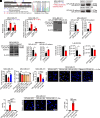
OPLAH intron retention induces R-loop formation, DNA damage and decrease of cell viability in TNBC. (A) The 79-bp retained intron sequences of OPLAH was detected through sequencing PCR. The primers used in experiments were shown. (B) DNA agarose gel electrophoresis in DMSO vs. LY500307 and vector vs. U2AF1 OE. The original OPLAH mRNA corresponded to a 294-bp band, while the IR isoform of OPLAH mRNA corresponded to a 373-bp band. (C and D) Statistical analysis of qPCR data of relative total and intron retained OPLAH isoform mRNA expression (n = 3 to 4 for each group). Data were shown as mean ± SD and individual values. (E) Western blot verification of plasmids overexpressing the original OPLAH proteins and the IR isoform of OPLAH proteins. The original OPLAH protein corresponded to a 137-kD band, while the IR isoform of OPLAH protein corresponded to a 100-kD band. Statistical analysis was shown in bar plots (n = 3 in every group). Data were shown as mean ± SD and individual values. (F) Western blot verification of OPLAH protein in the DMSO group and LY500307 group in MDA-MB-231 cells. The original OPLAH protein corresponded to a 137-kD band, while the IR isoform of OPLAH protein corresponded to a 100-kD band. Statistical analysis was shown in bar plots (n = 3 in every group). Data were shown as mean ± SD and individual values. (G) Statistical analysis of L-glutamate concentration levels in comparison between DMSO and LY500307, vector and U2AF1 OE, OPLAH (WT) and OPLAH (IR), respectively. The L-glutamate concentration was detected by LC-MS. Data were shown as mean ± SD and individual values (n = 3 to 4 for each group). (H) Statistical analysis of the EdU assay. The added L-glutamate concentration was 50 μM. Data were shown as mean ± SD and individual values (n = 3 for each group). *P < 0.05. ns: no significance. (I) Statistical analysis of the MTT assay. Treating concentrations of the cell death inhibitors: 1 μM Ferrostatin-1 (Fer-1), 60 μM 3-MA, 10 μM Necrostatin-1 (Nec-1), and 10 μM Z-VAD-FMK (zVAD). Cells were added MTT for detection after 48-h inhibitor treatment. Data were shown as mean ± SD and individual values (n = 5 for each group). (J) Statistical analysis of the cell apoptosis assay. The added L-glutamate concentration was 50 μM. Data were shown as mean ± SD and individual values (n = 4 for each group). (K) IF staining images of S9.6 in OPLAH (WT) vs. OPLAH (IR) MDA-MB-231 cell slides. Nuclei were stained with DAPI (blue), and the R-loop was stained with S9.6 (yellow). (Scale bar, 40 μm.) (L) Statistical analysis of IF experiments in (J). Data were shown as mean ± SD and individual values (n = 13 to 18 for each group). (M) IF staining images of γH2A.X in OPLAH (WT) vs. OPLAH (IR) MDA-MB-231 cell slides. Nuclei were stained with DAPI (blue), and DNA damage was represented by γH2A.X (yellow). (Scale bar, 40 μm.) (N) Statistical analysis of IF experiments in (L). Data were shown as mean ± SD and individual values (n = 13 to 15 for each group). ****P < 0.0001, ***P < 0.001, **P < 0.01, ns: no significance.
Fig. 6.
Fig. 6.
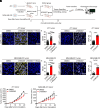
In vivo validation and model for upregulation of R-loop and DNA damage according to ERβ agonist. (A) Procedures of IF staining experiment of 4T1 and MDA-MB-231 subcutaneous tumor sections: 1) culturing 4T1 and MDA-MB-231 cells to achieve the required amount for tumor inoculation; 2) injecting tumor cells into mice subcutaneously, BALB/c mice for 4T1 and BALB/c-Nude mice for MDA-MB-231, respectively; 3) dividing mice into the DMSO group (control group) and LY500307 group (experimental group); 4) orally administering mice with vehicle or 0.04 mg LY500307 per day until the subcutaneous tumor volume was close to 2,000 mm3 or the drug administration was up to 2 wk; 5) separating subcutaneous tumors for the manufacture of paraffin sections; and 6) capturing images by Olympus FV3000 confocal laser microscopy and analyzing by ImageJ software. (B) IF staining images of S9.6 in tumor sections of in vivo 4T1 subcutaneous tumor models. Nuclei were stained with DAPI (blue), and the R-loop was stained with S9.6 (yellow). (Scale bar, 40 μm.) (C) Statistical analysis of IF experiments in (B). Data were shown as mean ± SEM and individual values (n = 35 to 46 for each group). (D) IF staining images of γH2A.X in tumor sections of in vivo 4T1 subcutaneous tumor models. Nuclei were stained with DAPI (blue), and DNA damage was represented by γH2A.X (yellow). (Scale bar, 40 μm.) (E) Statistical analysis of IF experiments in (D). Data were shown as mean ± SEM and individual values (n = 13 to 14 for each group). (F) IF staining images of S9.6 in tumor sections of in vivo MDA-MB-231 subcutaneous tumor models. Nuclei were stained with DAPI (blue), and the R-loop was stained with S9.6 (yellow). (Scale bar, 40 μm.) (G) Statistical analysis of IF experiments in (F). Data were shown as mean ± SEM and individual values (n = 10 to 12 for each group). (H) IF staining images of γH2A.X in tumor sections of in vivo MDA-MB-231 subcutaneous tumor models. Nuclei were stained with DAPI (blue), and DNA damage was represented by γH2A.X (yellow). (Scale bar, 40 μm.) (I) Statistical analysis of IF experiments in (H). Data were shown as mean ± SEM and individual values (n = 14 to 15 for each group). (J) BALB/c mice (n = 8 in each group) were inoculated with 1 × 10⁶ 4T1 cells and treated with vehicle or LY500307 (0.04 mg per day). Tumor volume changes were measured from day 6 after tumor inoculation. (K) BALB/c-Nude mice (n = 7 in each group) were inoculated with 1 × 10⁷ MDA-MB-231 cells and treated with vehicle or LY500307 (0.04 mg per day). Tumor volume changes were measured from day 6 after tumor inoculation. ****P < 0.0001.

Similar articles

Cited by

References

    1. Bianchini G., De Angelis C., Licata L., Gianni L., Treatment landscape of triple-negative breast cancer–Expanded options, evolving needs. Nat. Rev. Clin. Oncol. 19, 91–113 (2022). - PubMed
    1. Hartman J., et al. , Estrogen receptor beta inhibits angiogenesis and growth of T47D breast cancer xenografts. Cancer Res. 66, 11207–11213 (2006). - PubMed
    1. Honma N., et al. , Clinical importance of estrogen receptor-beta evaluation in breast cancer patients treated with adjuvant tamoxifen therapy. J. Clin. Oncol. 26, 3727–3734 (2008). - PubMed
    1. Song P., et al. , Estrogen receptor β inhibits breast cancer cells migration and invasion through CLDN6-mediated autophagy. J. Exp. Clin. Cancer Res. 38, 354 (2019). - PMC - PubMed
    1. Zhao L., et al. , Pharmacological activation of estrogen receptor beta augments innate immunity to suppress cancer metastasis. Proc. Natl. Acad. Sci. U.S.A. 115, E3673–E3681 (2018). - PMC - PubMed

MeSH terms

LinkOut - more resources