. 2024 Mar;18(3):e13278.
doi: 10.1111/irv.13278.

Changes in Viral Dynamics Following the Legal Relaxation of COVID-19 Mitigation Measures in Japan From Children to Adults: A Single Center Study, 2020-2023

Affiliations

Changes in Viral Dynamics Following the Legal Relaxation of COVID-19 Mitigation Measures in Japan From Children to Adults: A Single Center Study, 2020-2023

Yosuke Hirotsu et al. Influenza Other Respir Viruses. 2024 Mar.

Abstract

Introduction: Respiratory infections are an ongoing global health challenge. The COVID-19 pandemic triggered global nonpharmacological measures that reshaped public health. In Japan, the shift from legal to individual discretion in pandemic management started on May 8, 2023. However, it still unknown how the relaxation of measures affects respiratory pathogens across age groups.

Methods: We collected 16,946 samples from 13,526 patients between February 2020 and September 2023, analyzing the circulating respiratory pathogen dynamics using FilmArray respiratory panel.

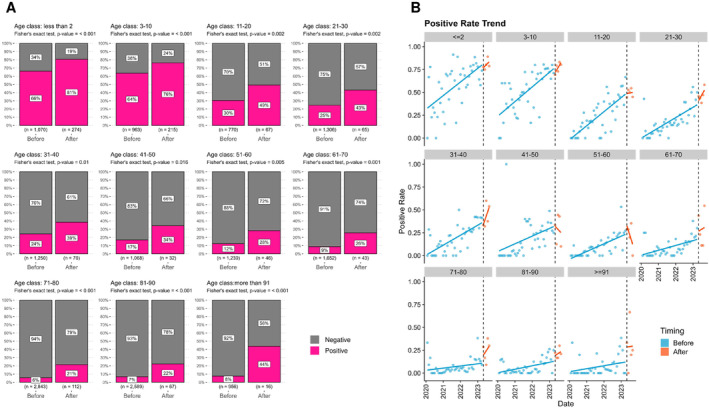
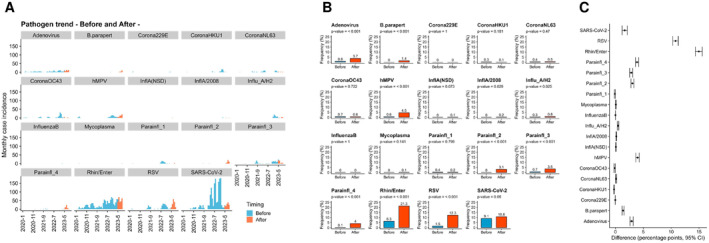
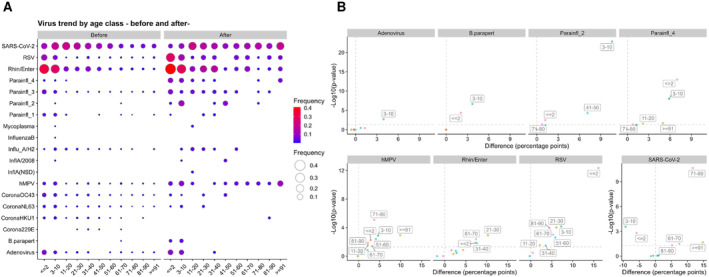
Results: Our analysis revealed significant increases in the positivity rates of respiratory pathogens across multiple age groups after relaxation. The pathogens including adenovirus, Bordetella pertussis, parainfluenza 2 and parainfluenza 4 showed increased positivity predominantly in children aged under 10 years. Conversely, some pathogens including human metapneumovirus, rhinovirus/enterovirus, and respiratory virus (RSV) increased in broad range of age groups. SARS-CoV-2 positivity rates decreased in children under 10 years but increased in those aged over 60 years.

Discussion: Age-stratified analysis reveals a dynamic pattern of circulating pathogen in each age group after relaxation measures. This study provides essential epidemiologic data that can guide strategies to protect different age groups and effectively respond to respiratory infections in post-COVID-19 era.

Keywords: COVID‐19; RSV; enterovirus; influenza; rhinovirus.


Conflict of interest statement

The authors declare no conflicts of interest.

Figures

FIGURE 1
FIGURE 1
Changes in age‐stratified positivity rates before and after regulatory relaxation. (A) The bar chart illustrates the changes in positivity rates before and after relaxation. The values within the bars represent positivity rates (in pink) and negativity rates (in gray), with the sample size indicated below each graph. p‐values were calculated using chi‐squared tests. (B) Temporal changes in monthly positivity rates before and after relaxation. Each dot represents the positivity rate for each month, while the lines depict predictions based on a linear regression model. Blue dots indicate data before relaxation, orange dots represent data after relaxation. The black dashed line indicates the point of relaxation in May 2023.
FIGURE 2
FIGURE 2
Changes in respiratory pathogens before and after regulatory relaxation. (A) Bar graphs show the monthly trends in the number of infections for each pathogen. Blue represents data before relaxation, and orange represents data after relaxation. (B) Bar graphs illustrate the changes in detection frequency (%) before and after relaxation. The values above the bars represent the frequency percentages. (C) The bar graph displays the percentage point difference between after and before relaxation. Error bars indicate 95% confidence intervals (CI).
FIGURE 3
FIGURE 3
Changes in respiratory pathogen infections before and after regulatory relaxation in different age groups. (A) Balloon plots show age‐specific positivity rates before and after relaxation for each respiratory infection. The size and color intensity of the circles represent the frequency. (B) Scatter plots show the relationship between changes before and after relaxation and their statistical significance. The horizontal axis represents the difference in frequencies (difference) between after and before relaxation in percentage points. The vertical axis shows the reciprocal of the log10 value of the p‐value calculated by the chi‐squared test, indicated as −log10(p‐value).

Similar articles

Cited by

References

    1. Lai S., Ruktanonchai N. W., Zhou L., et al., “Effect of Non‐Pharmaceutical Interventions to Contain COVID‐19 in China,” Nature 585, no. 7825 (2020): 410–413. - PMC - PubMed
    1. Feng L., Zhang T., Wang Q., et al., “Impact of COVID‐19 Outbreaks and Interventions on Influenza in China and the United States,” Nature Communications 12, no. 1 (2021): 3249. - PMC - PubMed
    1. Flaxman S., Mishra S., Gandy A., et al., “Estimating the Effects of Non‐Pharmaceutical Interventions on COVID‐19 in Europe,” Nature 584, no. 7820 (2020): 257–261. - PubMed
    1. Oh J., Lee H.‐Y., Khuong Q. L., et al., “Mobility Restrictions Were Associated With Reductions in COVID‐19 Incidence Early in the Pandemic: Evidence From a Real‐Time Evaluation in 34 Countries,” Scientific Reports 11, no. 1 (2021): 13717. - PMC - PubMed
    1. Xiao J., Dai J., Hu J., et al., “Co‐Benefits of Nonpharmaceutical Intervention Against COVID‐19 on Infectious Diseases in China: A Large Population‐Based Observational Study,” The Lancet Regional Health – Western Pacific 17 (2021): 17. - PMC - PubMed

Publication types