. 2024 May 7;36(5):1105-1125.e10.
doi: 10.1016/j.cmet.2024.02.015. Epub 2024 Mar 20.

Transcriptomic, epigenomic, and spatial metabolomic cell profiling redefines regional human kidney anatomy

Affiliations

Transcriptomic, epigenomic, and spatial metabolomic cell profiling redefines regional human kidney anatomy

Haikuo Li et al. Cell Metab. .

Abstract

A large-scale multimodal atlas that includes major kidney regions is lacking. Here, we employed simultaneous high-throughput single-cell ATAC/RNA sequencing (SHARE-seq) and spatially resolved metabolomics to profile 54 human samples from distinct kidney anatomical regions. We generated transcriptomes of 446,267 cells and chromatin accessibility profiles of 401,875 cells and developed a package to analyze 408,218 spatially resolved metabolomes. We find that the same cell type, including thin limb, thick ascending limb loop of Henle and principal cells, display distinct transcriptomic, chromatin accessibility, and metabolomic signatures, depending on anatomic location. Surveying metabolism-associated gene profiles revealed non-overlapping metabolic signatures between nephron segments and dysregulated lipid metabolism in diseased proximal tubule (PT) cells. Integrating multimodal omics with clinical data identified PLEKHA1 as a disease marker, and its in vitro knockdown increased gene expression in PT differentiation, suggesting possible pathogenic roles. This study highlights previously underrepresented cellular heterogeneity underlying the human kidney anatomy.

Keywords: MALDI-MS; SHARE-seq; acute kidney injury; anatomy; chronic kidney disease; lipid metabolism; metabolism; multiomics; single-cell combinatorial indexing; spatial metabolomics.


Conflict of interest statement

Declaration of interests B.D.H. is a consultant for Janssen Research & Development, LLC, Pfizer, and Chinook Therapeutics, held equity in Chinook Therapeutics and grant funding from Chinook Therapeutics, Pfizer and Janssen Research & Development, LLC; all interests are unrelated to the current work.

Figures
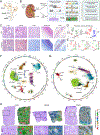
Figure 1.
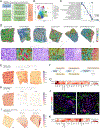
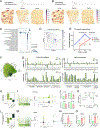
Figure 1.. A multimodal and anatomically stratified single-cell atlas of the human kidney.
(A) The structure of human kidney anatomy. DCT, distal convoluted tubule. Renal collecting ducts are not shown for the convenience of visualization. (B) Study overview. Figure created with BioRender.com. (C) PAS and trichrome histology staining on human kidney regions. (D) Pseudobulk analysis. (E) Visualization of region-specific gene expression/activity in the pseudobulk analysis. (F-G) UMAP presentations of 446,267 single-cell transcriptomes (F) and 401,875 chromatin accessibility profiles (G). The surrounding circular layouts indicate the cell number of each population (log10-transformed scale bar), major cell clusters (outer layout), and distributions of 5 anatomical regions in cell cluster (inner layout; color legend same as Figure 1D). PT_dediff, dedifferentiated PT; PT_VCAM1, VCAM1-expressing PT; TAL, thick ascending limb of loop of Henle; CNT, connecting tubule; PC, principal cell of collecting duct; ICA/ICB, type A/B intercalated cell of collecting duct; POD, podocyte; PEC, parietal epithelial cell; JGA, juxtaglomerular apparatus; ENDO, endothelial cell; Fib, fibroblast; Ma, macrophage; B/T, B and T cells; Uro, urothelium; SMC, smooth muscle cell. (H) Spatially resolved metabolomics of human kidney regions. For each sample, PAS staining (left) and metabolomics Leiden clustering (right) are shown. Zoom-in regions are shown below.
Figure 2.
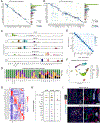
Figure 2.. SHARE-seq multiomics analysis identifies anatomical heterogeneity of the human kidney.
(A) Dot plot showing cluster-specific marker gene expression and bar plot showing the number of cells. (B) Dot plot showing cluster-specific gene activities and bar plot showing the number of cells. (C) Cell type composition of each kidney region. (D) Regional distribution of each cell type. (E) Heat map showing the proportion of snATAC-seq cells with identical cluster annotations as annotated by snRNA-seq analysis. (F) Integrative analysis of both modalities with WNN analysis. (G) Heat map showing cell type-specific motif activities. (H) Coverage plots of three tL marker genes. (I) Immunostaining of SLC44A5, UMOD and AQP2 on kidney medullary sections. Scale bars on the left panels: 100 μm.
Figure 3.
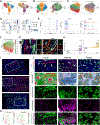
Figure 3.. Spatially resolved metabolomics highlights anatomical heterogeneity of the human kidney.
(A) MALDIpy, a package for IMS data analysis. (B) UMAP presentation of 408,218 spatially resolved metabolomes. Glom, glomerulus; CoD, collecting duct; LoH, loop of Henle; Matrix, MALDI technical background matrix. (C) Dot plot showing cluster-specific metabolomics. Each feature is labeled by its common name and chemical formula. (D) Spatially resolved metabolomics profiling of 6 human kidney samples, colored by metabolomics Leiden clustering. Scale bars: 300 μm. Donor #1 samples are highlighted in Figure 1H and zoom-in regions are shown with specialized kidney structures highlighted. (E) Spatial feature plot of metabolite SM(d18:1/16:0), with the chemical structure shown. The value on the color bar indicates IMS intensity post total ion count (TIC) normalization (see Methods). See also Mendeley Data. (F) Biological functions of enzymes of interest. (G) Gene expression of CERS6 and CDS2 in the kidney cortex. (H) Spatial feature plot of metabolite PA(18:1(9Z)/15:0), with the chemical structure shown. (I) Spatial feature plot of metabolite LysoPC(22:4(7Z,10Z,13Z,16Z)), with the chemical structure shown. (J) Immunostaining of CDS2 and LTL (Lotus tetragonolobus lectin) in the human kidney cortex, with specialized kidney structures highlighted. Scale bars: 25 μm. (K) Gene expression of LYPLA1/2 in the snRNA-seq data. Uro1/2 cells are combined for the convenience of visualization.
Figure 4.
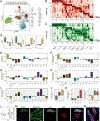
Figure 4.. tL, PC and TAL cells have distinct signatures depending on regional locations.
(A-C) Subclustering analysis of tL (A), distal nephron (B) and TAL cells (C). Cells are colored by either cluster annotations (left) or sample origins (right). (D) Dot plots showing cluster-specific gene expression. (E) Coverage plots of marker genes of tL, PC and TAL cells. Differential accessible regions are highlighted. (F) ANK2 expression in TAL cells. (G) Immunostaining of ANK2, UMOD and LTL on kidney cortex and medulla samples. Scale bars: 25 μm. (H) TFs sorted by regulatory score on TAL-M vs. TAL-C (left) and TAL-P vs. TAL-M (right). (I) Immunostaining of AQP2 (green) and UMOD (red) on serial MALDI sections of cortex (top), medulla (middle) and papilla (bottom) tissues. See Mendeley Data for scale bars and whole-area scanning. (J) Comparative analysis between immunostaining, metabolomics clustering and features. Regions of interest are highlighted in Figure 4I. 1st row: AQP2+ collecting ducts are indicated by arrows; UMOD+ TAL cells are indicated by triangles. 2nd row: Leiden clustering, with color scheme same as Figure 3B. 3rd/4th rows: Visualization of metabolites C45H78NO7PNa and C42H80NO8PNa. 5th row: Concurrent visualization indicates the two metabolites do not colocalize with each other. (K) UMAP presentations of two features, C45H78NO7PNa and C42H80NO8PNa, with chemical structures shown.
Figure 5.
Figure 5.. Unique metabolism-associated profiles between nephron segments.
(A) UMAP presentation of cells analyzed by a subset of metabolic genes. (B-C) Heat maps showing metabolic gene expression (B) and activity profiles (C) of each TEC. (D) Bar plots showing metabolism-associated gene module scores across kidney cortex (C), medulla (M) and papilla (P). Values are shown as mean with a 95% confidence interval error bar. (E-H) Bar plots showing metabolism-associated gene module scores. (I-J) Bar plots showing the osmotic stress score across TECs (I) and across kidney regions (J). (K) Bar plots showing the osmotic stress score in the subclustering analysis. (L) SCCPDH gene expression specific to tL and collecting duct cells. (M) Immunostaining of SCCPDH, AQP2 and UMOD on a human kidney medullary section. Scale bars: 10 μm. (N) Immunostaining of SCCPDH and SLC44A5 on a medullary section. Scale bars: 12.5 μm.
Figure 6.
Figure 6.. Surveying proximal tubule lipid metabolism in health and disease.
(A-B) Spatial feature plots of metabolites palmitoylcarnitine and oleoylcarnitine, with the chemical structures shown. (C) Dot plot showing expression of acylcarnitine species across clusters. (D) UMAP presentation showing the acylcarnitine score is specific to Cluster #10. (E) Composition of PT-specific acylcarnitine species with carbon chain length and relative abundance presented. (F) Pseudotemporal ordering of PT cells with a subset of metabolic genes. (G) Relative gene expression (top) or activity (bottom) of genes involved in FAO (left) or lipid accumulation (right) across PT subclusters. Data are shown as mean ± SEM. All genes are dysregulated with statistical significance (p<0.0001). (H) Bar plots showing FAO score across PT subclusters. Data are shown as mean with a 95% confidence interval error bar. (I) Expression of CYP4A11 over pseudotime (left), chromatin accessibility (middle) and gene expression (right) in PT and PT_VCAM1 cells. (J) qPCR analysis of RPTEC/TERT1 cells treated with TNF-α. (K) Seahorse analysis of RPTEC/TERT1 cells treated with TNF-α. (L) Bar plots showing lipid accumulation score across PT subclusters. (M) Expression of FAAH2 over pseudotime (left), chromatin accessibility (middle) and gene expression (right) in PT and PT_VCAM1 cells. (N) Quantification of ORO staining in primary RPTECs treated with oleate or palmitate fatty acids. (O) qPCR analysis of lipid accumulation genes on primary RPTECs. *p < 0.05, **p < 0.01, ***p < 0.001 and ****p < 0.0001 by Student’s t test.
Figure 7.
Figure 7.. Clinical data integration identified target genes in disease progression.
(A-B) Violin plots showing expression of VCAM1 (A) and HAVCR1 (B) in all PT cells across donors of control, AKI and CKD. *p < 0.05, **p < 0.01 and ***p < 0.001 by Mann-Whitney U test. (C-D) Correlation between patient creatinine levels and expression of VCAM1 (C) and HAVCR1 (D) in PT cells with a simple linear regression fit. Pearson correlation coefficient (r) and p-value (p) are shown. Color scheme presented in Figure 7E. (E) Correlation between patient ages and expression of collagen genes in kidney cortex. (F) Violin plot showing expression of COL1A1. (G) 13 genes associated with diseased PT cell state with clinical significance were selected based on four criteria. (H) Correlation between patient creatinine levels and expression of two candidate genes PPFIBP1 (left) and PLEKHA1 (right) in PT cells. (I) PPFIBP1 or PLEKHA1 were knocked down in primary RPTECs. (J-K) Heat maps showing dysregulated genes after siPPFIBP1 (J) or siPLEKHA1 (K) treatments with gene ontology associations presented. CPM, counts per million.

References

    1. McMahon AP (2016). Development of the Mammalian Kidney. Curr. Top. Dev. Biol. 117, 31. 10.1016/BS.CTDB.2015.10.010. - DOI - PMC - PubMed
    1. Kalantar-Zadeh K, Jafar TH, Nitsch D, Neuen BL, and Perkovic V (2021). Chronic kidney disease. Lancet 398, 786–802. 10.1016/S0140-6736(21)00519-5. - DOI - PubMed
    1. Hill NR, Fatoba ST, Oke JL, Hirst JA, O’Callaghan CA, Lasserson DS, and Hobbs FDR (2016). Global Prevalence of Chronic Kidney Disease – A Systematic Review and Meta-Analysis. PLoS One 11, e0158765. 10.1371/journal.pone.0158765. - DOI - PMC - PubMed
    1. Kriz W, Bankir L, Bulger RE, Burg MB, Goncharevskaya OA, Imai M, Kaissling B, Maunsbach AB, Moffat DB, Morel F, et al. (1988). A standard nomenclature for structures of the kidney. Kidney Int. 33, 1–7. 10.1038/ki.1988.1. - DOI - PubMed
    1. Bankir L, Figueres L, Prot-Bertoye C, Bouby N, Crambert G, Pratt JH, and Houillier P (2020). Medullary and cortical thick ascending limb: Similarities and differences. Am. J. Physiol. - Ren. Physiol. 312, F422–F442. 10.1152/AJPRENAL.00261.2019. - DOI - PubMed

Publication types