. 2024 Apr 10;32(4):527-542.e9.
doi: 10.1016/j.chom.2024.03.001. Epub 2024 Mar 20.

Opposing diet, microbiome, and metabolite mechanisms regulate inflammatory bowel disease in a genetically susceptible host

Affiliations

Opposing diet, microbiome, and metabolite mechanisms regulate inflammatory bowel disease in a genetically susceptible host

Gabriel Vasconcelos Pereira et al. Cell Host Microbe. .

Abstract

Inflammatory bowel diseases (IBDs) are chronic conditions characterized by periods of spontaneous intestinal inflammation and are increasing in industrialized populations. Combined with host genetics, diet and gut bacteria are thought to contribute prominently to IBDs, but mechanisms are still emerging. In mice lacking the IBD-associated cytokine, interleukin-10, we show that a fiber-deprived gut microbiota promotes the deterioration of colonic mucus, leading to lethal colitis. Inflammation starts with the expansion of natural killer cells and altered immunoglobulin-A coating of some bacteria. Lethal colitis is then driven by Th1 immune responses to increased activities of mucin-degrading bacteria that cause inflammation first in regions with thinner mucus. A fiber-free exclusive enteral nutrition diet also induces mucus erosion but inhibits inflammation by simultaneously increasing an anti-inflammatory bacterial metabolite, isobutyrate. Our findings underscore the importance of focusing on microbial functions-not taxa-contributing to IBDs and that some diet-mediated functions can oppose those that promote disease.

Keywords: dietary fiber; inflammatory bowel disease; microbiome; mucus.


Conflict of interest statement

Declaration of interests E.C.M. works as a consultant and an advisory board member at January, Inc., United States. M.S.D. works as a consultant and an advisory board member at Theralution GmbH, Germany.

Figures
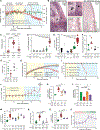
Figure 1.
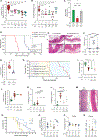
Figure 1.. Low fiber driven inflammation in Il10−/− mice.
A. Weights of adult Il10−/− mice colonized with the SM14 and maintained on a fiber rich (FR) diet or switched to a fiber free (FF) diet at 14d. Curves represent polynomial (quadratic) equations fit to all of the weights gathered at various days. Animals that were euthanized were excluded from the curve at later points. Two FF-fed animals from an early experiment were found dead and were not included in subsequent analyses. Right axis shows survival over time. B. Representative cecal histology of FF (left) and FR (right) fed SM14-colonized Il10−/− mice (middle, higher magnification insets). Block arrows points to a large ulcer, line arrow to an area of edema. C. Quantitative, blinded histological scoring of ileal, cecal, and colonic tissue from colonized Il10−/− mice fed the FF diet (n=15–20, one-way ANOVA and post hoc test with Holm-Šídák's multiple comparison test) D. Histological scoring of cecal tissue taken from colonized Il10−/− mice fed the FR and FF diets, along with additional treatments to manipulate diet, colonization and host genotype variables (n=5–20). E. Cecal Lipocalin-2 (LCN-2) measurements in the same treatments shown in D (n=5–23). F. Mucus penetrability by 1 um-sized beads in the distal colon of Il10−/− and WT mice fed the FR and FF diets. G. Distance of 1 um-sized beads from the epithelium in the same mice in F. H. Weights of Il10−/− mice born to either SM14 or SPF parents and weaned to FR or FF. By 79d post weaning, only the SM14/FF group (red) displays weight loss. Curves are fit to weight data as in A. I. Survival curves for 4 separate groups of WT C57bl/6 or Il10−/− mice colonized by parental transfer of SM14 bacteria at birth. J. Fecal LCN-2 measurements over time in SM14 colonized Il10−/− pups weaned to FR and FF. K. Endpoint cecal LCN-2 in SM14 and SPF colonized mice (n=4–7). L. Mucus measurements in SM14 and SPF colonized mice. Sample size indicated below each treatment group (n=4–5). M. Cecal LCN-2 in mice fed versions of the FF diet with glucose replaced by dietary fiber from apple, wheat, oat or soluble starch. Concentrations of each supplement are noted below the ingredient (n=5–23). N. Endpoint histology of the cecal tissue from SM14 colonized adult mice shifted to FF at 14d post colonization and then shifted back to FR at either 30d or 40d. (n=5–20). O. Endpoint cecal LCN-2 on mice shown in N. P. Fecal LCN-2 measurements over time on mice shown in N and O. For each time point/treatment the mean is shown along with individual points and error bars represent S.E.M. Experiments in panels F. and G. were done at the University of Luxembourg; all others were done at the University of Michigan. In panels C, D, E, J, K, L, M, bold horizontal bar represents the mean and lighter error bars the S.E.M. P values: * ≤ 0.05; ** ≤ 0.01; ** ≤ 0.001; *** ≤ 0.001; **** ≤ 0.0001; ns = not significant. In panels D, E, K, L, M, N, O, two-way ANOVA and post hoc test with Original FDR method of Benjamini and Hochberg was used for statistics.
Figure 2.
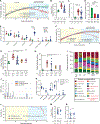
Figure 2.. Mucus integrity is central to diet-induced inflammation.
A. Cecal LCN-2 measurements at 60d after colonization in Il10−/− mice with full or reduced complexity synthetic microbiota as indicated in the “Colonized” line below each graph: Full SM14, just the SM10 species that do not degrade mucin O-glycans, or SM10 plus individual mucin degraders, B. thetaiotaomicron (Bt), B. caccae (Bc), B. intestinhominis (Bi) or A. muciniphila (Am) (n=7–23). B. Cecal histology scores of the same treatment group shown in A (n=5–20). C. Mucus thickness in SM10 colonized mice fed the FF diet (gray) compared to SM14 colonized mice fed either diet (n=5). D. Survival curves of Il10−/− adult mice colonized with SM14, SM10 and SM10+Bt to 150d. E. Representative histology from SM10, SM10+Bt and SM10+Am at 60d. F. Regional histology of gastrointestinal tissues from SM10+Bt. G. Cecal LCN-2 from SM14 and SM10+Bt colonized mice. H. Survival curves of Il10−/− and DKO adult mice colonized with the SM14. I.-L. Individual endpoint weight loss (I.), Cecal LCN-2 (J.), colon histology (K.) and cecal histology (L.) for SM14-colonized Il10−/−Muc2−/− double knockout (DKO) mice fed the FR or FF diets (n=5–23). M. Representative colon histology in DKO (left) and Il10−/− (right) mice showing worse disease in DKO mice. N. Survival curves of mono-colonized DKO adult mice. O.-Q. Cecal LCN-2 (O.), colon histology (P.) and cecum histology (Q.) of mice shown in N. In panels A, B, I-K, O bold horizontal bar represents the mean and lighter error bars the S.E.M. In panels A-C, I-K, O two-way ANOVA and post hoc test with Original FDR method of Benjamini and Hochberg was used for statistics.
Figure 3.
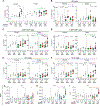
Figure 3.. Co-housing SPF- and SM14-colonized mice after weaning worsens disease.
A. Weights of SPF or SM14-colonized mice co-housed at weaning (21d) with pups harboring the opposite colonization. B. Cecal LCN-2 levels in co-housed or non-co-housed SPF and SM14 mice (co-housing status is indicated at the bottom of this and other panels; n=5–11, one-tailed Studenťs t-test and Wilcoxon test). C. Cecal histology of the same treatments shown in B (n=5–11, one-tailed Student’s t-test and Wilcoxon test). D. Cecal LCN-2 over time in co-housed and non-co-housed SPF and SM14 mice. E.–G. Relative abundances of select SM14 species invading SPF co-housed mice, E. coli, A. muciniphila, Ba. intestinihominis, respectively. Data are represented as mean ± SEM. *p < 0.05; **p < 0.01; ***p < 0.001; ****p < 0.0001.
Figure 4.
Figure 4.. EEN diet improves inflammation in part through isobutyrate production.
A. Weights of mice weaned onto FR, FF, and EEN diets. B. Cecal LCN-2 levels in mice weaned onto FF, FR, and EEN diets (n=7–15). C. Cecal histology scores of the mice shown in B. (n=7–15). D. Mucus thickness measurements in mice shown in B.-C. (n=5). E. Short- and branched-chain fatty acid measurements in mice fed FF, FR, or EEN diets (n=5–15). F. Weights of mice fed the FF diet and water supplemented with either 35mM isobutyrate (orange) or butyrate (purple) (n=6–15). G. Cecal LCN-2 levels in the mice from panel F. H. Cecal histology scores of the mice shown in F. (n=6–15). I. SM14 community composition in mice fed the FR, FF and EEN diets. Red asterisks denote FR, FF and EEN diet comparison. J. Short- and branched-chain fatty acid measurements in culture supernatants of indvidual SM14 bacteria. K. Short and branched chain fatty acid measurements in EEN fed mice colonized with either the full SM14 or an SM14 lacking E. rectale (n=6–15, one-tailed Studenťs t-test and Wilcoxon test). L. Survival of SM14 and SM14 minus E. rectale colonized mice on the FF and EEN diets. M. Cecal LCN-2 measurements of the mice shown in L. (n=6–15, one-tailed Studenťs t-test and Wilcoxon test). N. Cecal histology scores of the mice shown in L. (n=10,15). Data are represented as mean ± SEM. *p < 0.05; **p < 0.01; ***p < 0.001; ****p < 0.0001. In panels B, C, D, E, G, H, two-way ANOVA and post hoc test with Original FDR method of Benjamini and Hochberg was used for statistics.
Figure 5.
Figure 5.. Mucin-degrading bacteria mediate low fiber-induced immune responses.
A. LCN-2 levels in the cecal contents and feces of GF and colonized Il10−/− mice (n=4–7). Numbers on the X axis indicate the number of samples in which LCN-2 was not detected. B. Proportion of NK cells among CD3CD45+ cells in the cecum and colon lamina propria of SM10- and SM14-colonized Il10−/− mice (n=4–11). C.–F. Proportion of CD3+CD4+ (C.), CD3+CD8+ (D.), Th1 (E.) and Th17 (F.) cells among CD45+ cells in the cecum and colon of SM10- and SM14-colonized Il10−/− mice (n=4–11). Helper T (Th) cell subsets are defined as CD3+ CD4+ Foxp3. Cytokine mRNA expression in the Mesenteric Lymph Nodes (G.-I., MLN) Data are represented as mean ± SD. *p < 0.05; **p < 0.01; ***p < 0.001; ****p < 0.0001. In panels A-F, two-way ANOVA and post hoc test with Original FDR method of Benjamini and Hochberg was used for statistics.
Figure 6.
Figure 6.. Fiber deprivation alters IgA–bacteria interactions.
A. Concentrations of free IgA in the cecal contents and feces of GF and colonized Il10−/− mice (n=4–9). B. Percentages of total IgA-coated bacteria in the feces of FR- and FF-fed, SM14-colonized mice at 21, 56 and 79 dpw (n=5–13). C. Percentages of total IgA-coated bacteria in the feces of SM10-, SM14- or SPF-colonized Il10−/− mice and SM14-colonized WT mice fed the FR or the FF diet for 79 days (n=5–8). D. IgA-coating profiles of fecal bacteria from SM14-colonized mice fed a FR (left) or a FF (right) diet for 56 days showing the gating strategy of populations being low-coated (IgAlow) and high-coated (IgAhigh). Total IgA coating consists of the addition of IgAhigh and IgAlow coating. E–F. Percentages of IgAlow- (E.) and IgAhigh- (F.) coated bacteria in the feces of indicated groups at 79 dpw (n=5–8). G. IgA-coating index (Kau index) of fecal bacteria from SM14-colonized Il10−/− and WT mice (n=2–5, multiple unpaired t-test and post hoc test with the two-stage linear step-up procedure of Benjamini, Krieger and Yekutieli). Data are represented as mean ± SD. *p < 0.05; **p < 0.01; ***p < 0.001; ****p < 0.0001. In panels A., B., C., E., F., two-way ANOVA and post hoc test with the two-stage linear step-up procedure of Benjamini, Krieger and Yekutieli was used for statistics.

References

    1. Shan Y, Lee M & Chang EB (2021). The Gut Microbiome and Inflammatory Bowel Diseases. Annu. Rev. Med. 27;73:455–468. - PMC - PubMed
    1. Mirkov MU, Verstockt B & Cleynen I (2017).Genetics of inflammatory bowel disease: beyond NOD2. Lancet Gastroenterol. Hepatol. 2, 224–234. - PubMed
    1. Maloy KJ & Powrie F (2011). Intestinal homeostasis and its breakdown in inflammatory bowel disease. Nature 474, 298–306. - PubMed
    1. Ng SC et al. (2017). Worldwide incidence and prevalence of inflammatory bowel disease in the 21st century: a systematic review of population-based studies. Lancet 390, 2769–2778. - PubMed
    1. Agrawal M, Burisch J, Colombel JF & S CS (2020). Viewpoint: Inflammatory Bowel Diseases Among Immigrants From Low- to High-Incidence Countries: Opportunities and Considerations. J. of Crohn's & colitis 14, 267–273. - PubMed

LinkOut - more resources