. 2024 May 2;84(9):1742-1752.e5.
doi: 10.1016/j.molcel.2024.02.030. Epub 2024 Mar 20.

H3K4me1 facilitates promoter-enhancer interactions and gene activation during embryonic stem cell differentiation

Affiliations

H3K4me1 facilitates promoter-enhancer interactions and gene activation during embryonic stem cell differentiation

Naoki Kubo et al. Mol Cell. .

Abstract

Histone H3 lysine 4 mono-methylation (H3K4me1) marks poised or active enhancers. KMT2C (MLL3) and KMT2D (MLL4) catalyze H3K4me1, but their histone methyltransferase activities are largely dispensable for transcription during early embryogenesis in mammals. To better understand the role of H3K4me1 in enhancer function, we analyze dynamic enhancer-promoter (E-P) interactions and gene expression during neural differentiation of the mouse embryonic stem cells. We found that KMT2C/D catalytic activities were only required for H3K4me1 and E-P contacts at a subset of candidate enhancers, induced upon neural differentiation. By contrast, a majority of enhancers retained H3K4me1 in KMT2C/D catalytic mutant cells. Surprisingly, H3K4me1 signals at these KMT2C/D-independent sites were reduced after acute depletion of KMT2B, resulting in aggravated transcriptional defects. Our observations therefore implicate KMT2B in the catalysis of H3K4me1 at enhancers and provide additional support for an active role of H3K4me1 in enhancer-promoter interactions and transcription in mammalian cells.

Keywords: H3K4me1; KMT2B; KMT2C/D; MLL2; MLL3/4; chromatin contacts; differentiation; enhancer; gene regulation; histone methyltransferases.


Conflict of interest statement

Declaration of interests B.R. is a co-founder of Arima Genomics, Inc. and Epigenome Technologies, Inc.

Figures
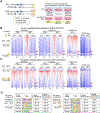
Figure 1 |
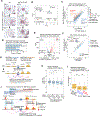
Figure 1 |. KMT2C/D (MLL3/4) catalytic activity is required for H3K4me1 at candidate enhancers induced during differentiation of ESC to NPC.
(A) Mouse embryonic stem cells (mESCs) expressing wild-type (WT) or catalytically deficient (dCD) mouse KMT2C and KMT2D proteins are induced to differentiate towards neural progenitor cells (NPC). Cells at Day 0, Day 2.5 and Day 5 of differentiation were subject to various genomic assays.. (B)(C) Heatmaps showing histone modifications and chromatin accessibility at candidate enhancers in WT and dCD ESC and NPC cells. In (B), candidate enhancers with increased H3K4me1 in NPCs (FDR < 0.05, log2FC > 0.5) (N=3,373) were shown. In (C) candidate enhancers showing persistent H3K4me1 levels were shown (N=30,404) (C). The candidate enhancers were further classified into enhancers KMT2C/D-dependent (N=3,028 and 4,150) and KMT2C/D-independent (N=345 and 26,254). Data of two biological replicates are shown. (D) The top 5 TF binding motifs enriched at KMT2C/D-dependent (left) and -independent candidate enhancers (right) are shown. (see Figure S1I for the same analysis of persistent candidate enhancers). See also Figures S1 and S2.
Figure 2 |
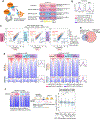
Figure 2 |. KMT2C/D catalytic activities are required for the formation of enhancer-promoter (E–P) contacts during NPC differentiation.
(A) Scatter plots showing differential chromatin contacts anchored on promoters (y-axis) between ESCs and NPCs in WT and KMT2C/D dCD (right) cells. Significantly induced and reduced chromatin contacts are shown as red and blue dots, respectively (FDR < 0.05). (B) Genome browser snapshots of Zbtb16 gene, which depends on KMT2C/D for induction upon NPC differentiation. The arcs denote chromatin contacts between Zbtb16 promoters and nearby candidate enhancers. The colors of arcs indicate significance of changes (blue to red, −log10(p value)) with + or − marking direction of change. (C) Heatmaps showing the changes of E-P contacts at the KMT2C/D-dependent de novo enhancers (N=882) and the KMT2C/D-independent de novo enhancers (N=111) upon cell differentiation from ESCs towards NPCs in WT (left column) and KMT2C/D dCD cells (right column). The pseudo color indicates significance of change (−log10(p value)) with + or − marking direction of change. Boxplots show the fold changes of E-P contacts in WT and KMT2C/D dCD cells. All boxplots hereafter are defined as following: Central bar, median; lower and upper box limits, 25th and 75th percentiles, respectively; whiskers, minimum and maximum value within the range of (1st quartile −1.5*(3rd quartile - 1st quartile)) to (3rd quartile + 1.5*(3rd quartile - 1st quartile)). *** p value < 0.001, two-tailed t-test. (D) Scatter plots showing changes of chromatin contacts anchored on promoters and enhancers of NPC-induced genes (N=1303) in WT cells and KMT2C/D dCD cells. (E) Heatmaps showing the changes of E-P contacts centered at the 1303 NPC-induced genes in WT (left column) and KMT2C/D dCD cells (right column). See also Figures S3–S6, and STAR Methods.
Figure 3 |
Figure 3 |. Transcriptional defects upon loss of KMT2C/D catalytic activities in NPC cells.
(A) Microscopic images of mouse ESCs differentiation towards NPCs (at day 2.5, and day 5) in WT and KMT2C/D dCD cells. Alkaline phosphatase staining was performed at each time point to monitor their loss of pluripotency during cell differentiation. (B) Principal component analysis of gene expression profiles of WT and KMT2C/D dCD cells at specified time points of cell differentiation. Two replicates of each cell line and treatment condition are shown. (C) Scatter plots showing transcription levels of NPC-differentiation induced genes (FDR < 0.05, FC > 2, RPKM in NPCs > 1.0) in NPCs (x-axis) of WT and KMT2C/D dCD cells (day 5) (y-axis). Blue and light-blue dots mark down-regulated genes in KMT2C/D dCD NPCs (FC > 2 and 2 > FC > 1.5, respectively, FDR < 0.05). Red and orange dots mark up-regulated gene in KMT2C/D dCD NPCs (FC > 2 and 2> FC > 1.5, respectively, FDR < 0.05). (D) Top three enriched gene ontology (GO) terms in genes that failed to be induced in KMT2C/D cells. p values (Fisher’s exact test) are also indicated. (E) Volcano plots showing transcriptional changes during NPC differentiation in WT ESCs at genes that have significant chromatin contacts (MAPS, FDR < 0.01) with the KMT2C/D-dependent candidate enhancers (N=3028). Significantly up-regulated and down-regulated genes are marked as red and blue dots, respectively (FDR < 0.05, FC > 2). (F) Scatter plots showing transcription levels of genes in NPCs of WT and KMT2C/D dCD cells. Only genes that are induced upon NPC differentiation and making significant chromatin contacts with KMT2C/D-dependent candidate enhancers are shown. Down-regulated genes in KMT2C/D dCD NPCs (2> FC > 1.5, FDR < 0.05) are marked as light-blue dots. (G) Schematic representation of the method used to calculate the ratio of chromatin contact counts mapped at KMT2C/D-dependent or independent candidate enhancers. See STAR Methods for details of the calculation. (H) Boxplots showing transcriptional changes between WT and KMT2C/D dCD cells during NPC differentiation. NPC-differentiation induced genes were classified into four groups based on the ratios of chromatin contact counts on the KMT2C/D-independent enhancers (ratio of C.C.). * p value < 0.05, *** p value < 0.001, one-tailed t-test. (I) Boxplots showing the number of KMT2C/D-independent candidate enhancers making significant contacts (MAPS, FDR < 0.01) with each group of NPC-differentiation induced genes classified based on differential gene expression as in Figure 3C. ns p value > 0.05, *** p value < 0.001, one-tailed t-test. (J) Schematic representation depicting the requirement of KMT2C/D catalytic activities at different groups of candidate enhancers. See also Figure S7–S9.
Figure 4 |
Figure 4 |. KMT2B contributes to H3K4me1 at KMT2C/D-independent enhancers and transcription.
(A) Schematic representation of the dTAG system utilized to acutely deplete KMT2B in wild type and KMT2C/D dCD ESCs. (B) Average H3K4me3 signals on TSSs (N=14090) in WT ESCs and NPCs. The ChIP-seq signals of WT (light brown), KMT2B-depleted (red), KMT2C/D dCD (light blue), and KMT2C/D dCD + KMT2B-depleted (purple) ESCs and NPCs are shown. (C) Scatter plots showing transcription levels of NPC-differentiation induced genes (FDR < 0.05, FC > 2, RPKM in NPCs > 1.0) in WT NPCs (x-axis) and each indicated mutated NPCs (left: KMT2B-depleted NPCs, middle: KMT2C/D-dCD NPCs, right: KMT2C/D-dCD + KMT2B-depleted NPCs) (y-axis). Blue and light-blue dots mark down-regulated in mutated NPCs (FC > 2 and 2> FC > 1.5, respectively, FDR < 0.05). Red and orange dots mark up-regulated in mutated NPCs (FC > 2 and 2>FC > 1.5, respectively, FDR < 0.05). Three replicates of each sample were analyzed to determine the differentially expressed genes. (D) Venn-diagram showing the overlap of down-regulated genes in KMT2C/D dCD (KMT2B(+)) NPCs (N=126) and KMT2B-depleted (KMT2C/DWT) NPCs (N=368). (E) Heatmaps showing H3K4me1 signals centered at KMNT2C/D-independent and -dependent candidate enhancers. KMT2C/D-independent enhancers: N=26,254 and 26,599 in ESCs and NPCs, respectively. KMT2C/D-dependent enhancers: N=4,150 and 7,178 in ESCs and NPCs, respectively. Average enrichments of the H3K4me1 signals are also shown on the right with same color scheme as in panel B. (F) (left) Heatmaps showing H3K4me1 signals at candidate distal enhancers exhibiting significant reduction in KMT2B-depleted NPCs (N=2,765). (center and right) Boxplots showing transcriptional changes between WT and KMT2B-depleted (KMT2C/DWT) NPCs at NPC-differentiation induced genes, classified based on the ratio of C.C. on the 2,765 KMT2B-dependent enhancers. * p value < 0.05, *** p value < 0.001, one-tailed t-test. See also Figure S10.

References

    1. Heintzman ND, Hon GC, Hawkins RD, Kheradpour P, Stark A, Harp LF, Ye Z, Lee LK, Stuart RK, Ching CW, et al. (2009). Histone modifications at human enhancers reflect global cell-type-specific gene expression. Nature 459, 108–112. 10.1038/nature07829. - DOI - PMC - PubMed
    1. Long HK, Prescott SL, and Wysocka J (2016). Ever-Changing Landscapes: Transcriptional Enhancers in Development and Evolution. Cell 167, 1170–1187. 10.1016/j.cell.2016.09.018. - DOI - PMC - PubMed
    1. Clapier CR, and Cairns BR (2009). The biology of chromatin remodeling complexes. Annu Rev Biochem 78, 273–304. 10.1146/annurev.biochem.77.062706.153223. - DOI - PubMed
    1. Euskirchen G, Auerbach RK, and Snyder M (2012). SWI/SNF chromatin-remodeling factors: multiscale analyses and diverse functions. J Biol Chem 287, 30897–30905. 10.1074/jbc.R111.309302. - DOI - PMC - PubMed
    1. Creyghton MP, Cheng AW, Welstead GG, Kooistra T, Carey BW, Steine EJ, Hanna J, Lodato MA, Frampton GM, Sharp PA, et al. (2010). Histone H3K27ac separates active from poised enhancers and predicts developmental state. Proc Natl Acad Sci U S A 107, 21931–21936. 10.1073/pnas.1016071107. - DOI - PMC - PubMed

Publication types

MeSH terms

LinkOut - more resources