. 2024 Apr 9;57(4):859-875.e11.
doi: 10.1016/j.immuni.2024.02.020. Epub 2024 Mar 20.

Epithelial-derived interleukin-23 promotes oral mucosal immunopathology

Affiliations

Epithelial-derived interleukin-23 promotes oral mucosal immunopathology

Tae Sung Kim et al. Immunity. .

Abstract

At mucosal surfaces, epithelial cells provide a structural barrier and an immune defense system. However, dysregulated epithelial responses can contribute to disease states. Here, we demonstrated that epithelial cell-intrinsic production of interleukin-23 (IL-23) triggers an inflammatory loop in the prevalent oral disease periodontitis. Epithelial IL-23 expression localized to areas proximal to the disease-associated microbiome and was evident in experimental models and patients with common and genetic forms of disease. Mechanistically, flagellated microbial species of the periodontitis microbiome triggered epithelial IL-23 induction in a TLR5 receptor-dependent manner. Therefore, unlike other Th17-driven diseases, non-hematopoietic-cell-derived IL-23 served as an initiator of pathogenic inflammation in periodontitis. Beyond periodontitis, analysis of publicly available datasets revealed the expression of epithelial IL-23 in settings of infection, malignancy, and autoimmunity, suggesting a broader role for epithelial-intrinsic IL-23 in human disease. Collectively, this work highlights an important role for the barrier epithelium in the induction of IL-23-mediated inflammation.

Keywords: IL-23; Pseudomonas aeruginosa; TLR5; barrier immunity; epithelial; epithelial-intrinsic; flagellin; oral mucosa; pathogenic Th17; periodontitis.


Conflict of interest statement

Declaration of interests The authors declare no competing interests.

Figures
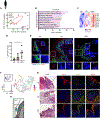
Figure 1.
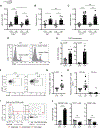
Figure 1.. IL23A is highly expressed in chronic and LAD1-Periodontitis
(A-C) Bulk RNAseq in human gingival tissues from HC (n=4), CP (n=8) and LAD1 (n=5) patients. (A) Principal components analysis (PCA). (B) Gene Ontology (GO) biological processes in ascending order of p-value. (C) Heatmap analysis of select differentially expressed genes between HC, CP and LAD1. Each column represents an individual sample. (D) qPCR analysis for IL23A mRNA expression in human gingiva tissues with HC, CP and LAD1. (n=5–6). (E) RNAscope Hiplex fluorescence assay was used to determine the expression of IL23A mRNA (red) and epithelial cell marker CK19 mRNA (green) transcripts in human gingival tissues from HC (n=3), CP (n=3) and LAD1 (n=3). Representative images shown, Scale bars are 50 μm. (F) UMAP representation of epithelial cell expression of IL23A. Volcano plot depicting IL23A expression within subpopulation between HC (n=13) and LAD1 (n=1). (G) Representative immunofluorescence images for IL23A (yellow) and CK19 (red) in human gingiva tissue from HC (n=3), CP (n=3) and LAD1 (n=1). scale bars are 50 μm. (H) Schematic representation of oral cavity and crevicular epithelium, created with BioRender.com. Data are representative of three (D) independent experiments. Graphs show the mean ± SEM. *P < 0.05. One-way ANOVA with Tukey’s multiple comparison test (D). Please also see Figure S1.
Figure 2.
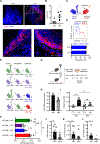
Figure 2.. IL23A cell sources in experimental periodontitis
(A-C) Bone loss measurements with or without LIP in (A) Il23a+/+ and Il23a −/− (n=8), (B) Il6+/+ and Il6−/− (n=6–7) and (C) Il1r1+/+ and Il1r1−/− (n=7–8) mice. Bar graph depicts bone loss (6 days). (D) CD45+ and CD45 cells were FACS sorted from the gingival tissues with or without LIP (n=5). (D) Gating strategy to identify subsets of CD45+ and CD45 cells in the gingival tissues, shown. (E) Bar graphs show Il23a mRNA expression determined by qPCR and in CD45+ and CD45 cells sorted from CTL and LIP. (F-H) Flow cytometry analysis of mouse gingiva CTL/LIP (18 h, n=9) mice. (F) FACS plot and (G-H) graph indicating absolute number of CD45+IL23A+ or CD11b+IL23A+ cells. (I-J) CD45 cell populations were FACS sorted from gingival tissues with or without LIP (n=3). (I) Gating strategy to identify subsets of CD45 cells in the gingival tissues. (J) Bar graphs show Il23a mRNA expression determined by qPCR in CD45 EpCAM+, CD31+ and CD90+ cells sorted from LIP relative to that in CTL. Data are representative of three (A,B,C,E, and J) or four (G and H) independent experiments. Graphs show the mean ± SEM. *P < 0.05, **P < 0.01, ***P < 0.001, ****P < 0.0001. ns, not significant. One-way ANOVA with Tukey’s multiple comparison test (A,B,C and H), Unpaired t test (E,G and J). Please also see Figure S1.
Figure 3.
Figure 3.. Non-hematopoietic cell derived IL23A triggers bone destruction in experimental periodontitis
(A-B) Immunofluorescence for IL23A in gingival tissues (CTL/LIP, 18 h). (A) Representative confocal Images, scale bars are 50 μm (B) Quantification of percentage of IL23A stained area, respectively (n=6). (C) Experimental scheme for non-competitive repopulation experiment. Sub-lethally irradiated CD45.2+ B6 were transplanted with bone marrow purified from congenic CD45.1+ mice. Schematic created with BioRender.com. (D) Top, FACS plots demonstrate the contribution of donor CD45.1+ cells in gingival tissues with or without LIP placement (n=4–5). Numbers indicate percentage of cells. Bottom, bar graph showing frequencies of donor CD45+ cells. (E) Schematic of Il23a bone marrow chimera experiment. Il23a+/+ mice were reconstituted with Il23a+/+ or Il23a−/− bone marrow-derived cells, and Il23a−/− mice reconstituted with Il23a+/+ or Il23a−/− bone marrow-derived cells. Schematic created with BioRender.com. (F) Bone loss measurements after LIP in each chimeric mouse (n=3–6). Bar graph depicts bone loss. (G) Schematic of LIP model with Abx treatment, created with BioRender.com. (H) Total oral microbial biomass at CTL/LIP (5 days) with NW or ABX and (I) bone loss measurements (n=7). (J-L) mRNA expression of Il23a, CTL/ LIP with NW or ABX (n=6–9). Data are representative of three (B,D,F,H-L) independent experiments. Graphs show the mean ± SEM. *P < 0.05, **P < 0.01, ***P < 0.001. ns, not significant. One-way ANOVA with Tukey’s multiple comparison test (F and I), Unpaired t test (B,D,H,J,K and L). Please also see Figure S2.
Figure 4.
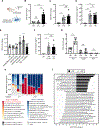
Figure 4.. Disease-associated microbiome triggers IL-23 production in mouse oral keratinocytes
(A) Schematic representation of the isolated primary epithelial cells from mouse oral tissues (MOK), created with BioRender.com. (B-C) qPCR and (D) ELISA analysis of Il23a and IL-23 (p19/p40, heterodimer) production in MOKs incubated with 0 (UN), silk ligature alone (CTL silk sutures, 100 μl), ligatures removed after LIP placement (LIP or Live silk sutures, 100 μl) or heat inactivated (HK, 100 μl). (E) qPCR and (F) ELISA analysis of Il23a and IL-23 (p19/p40, heterodimer) production in MOKs incubated with 0 (UN), Pam3CSK4 (100 ng/ml), HKLM (107 cells/ml), LPS-E.coli (100 ng/ml), FLA-ST (1 μg/ml) and FSL-1 (100 ng/ml). (G) qPCR analysis of Il23a expression in MOKs from WT, TLR4/5−/− and TLR5−/− mice incubated with 0 (UN) or heat inactivated ligatures removed after LIP placement (HK, 100 μl). (H) Microbiome composition at the operational taxonomic unit (OTU) level at 2 and 24 h after ligature placement. Most abundant OTUs are classified at the species-level (when possible) and less dominant OTUs are shown combined at phylum level. (I) Lefse analysis showed bacteria over and underrepresented in abundance, in ABX and NW treated mice at 24 h (n=6). Data are representative of three (B-G) independent experiments. Graphs show the mean ± SEM. *P < 0.05, **P < 0.01, ***P < 0.001, ****P < 0.0001. ns, not significant. One-way ANOVA with Tukey’s multiple comparison test (B-G), LEfSe was utilized to test for differences in relative abundance considering 0.01 as the α value for significance (I). Please also see Figure S3.
Figure 5.
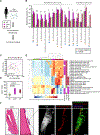
Figure 5.. Oral microbiome in chronic and LAD1-periodontitis is characterized by expansion of flagellated bacteria
(A) Schematic of human oral microbiome metagenome sequencing analysis from HC (n=10), CP (n=5), and LAD1 (n=3). (B) Species enriched in CP or LAD1 compared with HC. Bars depict the relative abundance of each species. Orange and blue shapes beside each name indicate Gram-negative or motile species, respectively. (C) Differences in the content of flagella-related genes among groups. Plot is a principal component analysis (PCA) depicting Euclidian distances among samples (beta-diversity) based on the abundance of UniRef90 gene clusters related to flagella. Ellipses represent 95 % CI. p<0.01 for HC vs. CP; p=0.06 for HC vs. LAD1; p=1 for CP vs. LAD1. (D) Differences in the within-sample diversity (Chao1 alpha-diversity index) of UniRef90 gene clusters related to flagella. Boxes and whiskers depict the minimum, first quartile, median, third quartile, and maximum. (E) Flagella-related genes differentially represented in HC, LAD1 or CP. Heatmap plot depicts the abundance of UniRef90 gene clusters related to flagella (in rows) in individual samples (in columns) organized by unsupervised hierarchical clustering. Shown UniRef90 gene clusters had p<0.05. Colored bars on the right depict the group in which the UniRef90 gene cluster was enriched in each pair-wise comparison. (F) Unmixed multispectral image of dental plaque on a tooth from LAD (n=1). Presence of specific species (Pseudomonas aeruginosa) and genus (Fusobacterium sp, Streptococcus sp, Campylobacter sp) Pseudomonas aeruginosa cells visualized using specific probes. Scale bars are 25 μm. *P < 0.05, **P < 0.01, ***P < 0.001. One-way ANOVA with Dunn-Sidak multiple comparison test (B,D and E) or permutational multivariate analysis of variance (PERMANOVA) (C). Please also see Figures S4 and S5.
Figure 6.
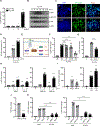
Figure 6.. Pseudomonas aeruginosa triggers IL-23 production in human oral epithelial cells in a TRL5-dependent manner
(A) qPCR analysis of IL23A mRNA expression in HOKs incubated for 3 h with 0 (UN), LPS-PA (1 or 10 μg/ml) or FLA-PA (1 μg/ml). (B) Immunoblot analysis of p-JNK, p-ERK1/2, and p-p38 proteins in HOKs treated with FLA-PA (1 μg/ml) for the indicated times. β-actin was used as a loading control. (C and D) Immunofluorescence microscopy analysis of NF-kB p65 nuclear translocation (C) Representative immunofluorescence images of NF-kB p65 and (D) quantitation of NF-kB p65 nuclear translocation (n=6). Scale bars are 50 μm. (E) Schematic of inhibition strategy of MAPK/ NF-kB inhibitors in TLR5 signaling, created with Biorender. (F-G) qPCR analysis of IL23A mRNA expression in HOKs cultured in the presence or absence of a JNK inhibitor (SP600125, 10 μM), MEK-1 inhibitor (U0126, 10 μM), p38 inhibitor (SB203580, 10 μM) or BAY 11–7082 (BAY11, 10 μM) for 45 min before treatment with FLA-PA (1 μg/ml). (H) qPCR and (I) ELISA analysis of IL23A and IL-23 (p19/p40 heterodimer) production in HOKs exposed to Pseudomonas aeruginosa reference strains (PAO1 and PA14; moi=1 or 5) and clinical isolates (LAD112 and LAD113; moi=1 or 5). (J and K) Expression of Tlr5, IL23A mRNA in HOKs transfected with nonspecific siRNA (siNS) or specific siRNAs against human TLR5 (siTLR5) followed by exposure to reference strains (PAO1 and PA14, moi=5) or clinical strains (LAD112 and LAD113, moi=5). Data are representative of three (A-D,H,I,J and K) or four (F and G) independent experiments. Graphs show the mean ± SEM. *P < 0.05, **P < 0.01, ****P < 0.0001. ns, not significant. One-way ANOVA with Tukey’s multiple comparison test (A,D,F,G,H,I and K), Unpaired t test (J). Please also see Figures S6 and S7.
Figure 7.
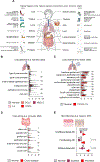
Figure 7.. Epithelial expression of IL23A in human health and disease
(A-E) IL23A expression in human tissues. Normalized expression of IL23A in epithelial subtypes of (A) healthy human tissues or in (B-E) healthy and diseased tissues. SCLC, squamous cell lung carcinoma; NSCLC, non-squamous cell lung carcinoma; LA, lung adenocarcinoma; COPD, chronic obstructive pulmonary disease. *P < 0.05, **P < 0.01, ***P < 0.001. One-way ANOVA with Tukey’s multiple comparison test (B and E), Unpaired t test (C and D).

Comment in

References

    1. Peterson LW, and Artis D (2014). Intestinal epithelial cells: regulators of barrier function and immune homeostasis. Nat Rev Immunol 14, 141–153. 10.1038/nri3608. - DOI - PubMed
    1. Belkaid Y, and Harrison OJ (2017). Homeostatic Immunity and the Microbiota. Immunity 46, 562–576. 10.1016/j.immuni.2017.04.008. - DOI - PMC - PubMed
    1. Rakoff-Nahoum S, Paglino J, Eslami-Varzaneh F, Edberg S, and Medzhitov R (2004). Recognition of commensal microflora by toll-like receptors is required for intestinal homeostasis. Cell 118, 229–241. 10.1016/j.cell.2004.07.002. - DOI - PubMed
    1. Lotz M, Gutle D, Walther S, Menard S, Bogdan C, and Hornef MW (2006). Postnatal acquisition of endotoxin tolerance in intestinal epithelial cells. J Exp Med 203, 973–984. 10.1084/jem.20050625. - DOI - PMC - PubMed
    1. Hajishengallis G, Lamont RJ, and Koo H (2023). Oral polymicrobial communities: Assembly, function, and impact on diseases. Cell Host Microbe 31, 528–538. 10.1016/j.chom.2023.02.009. - DOI - PMC - PubMed

Publication types