. 2024 May 16;63(5):2400386.
doi: 10.1183/13993003.00386-2024. Print 2024 May.

Th2-skewed peripheral T-helper cells drive B-cells in allergic bronchopulmonary aspergillosis

Affiliations

Th2-skewed peripheral T-helper cells drive B-cells in allergic bronchopulmonary aspergillosis

Rong-Guang Luo et al. Eur Respir J. .

Abstract

Introduction: Patients with allergic bronchopulmonary aspergillosis (ABPA) suffer from repeated exacerbations. The involvement of T-cell subsets remains unclear.

Methods: We enrolled ABPA patients, asthma patients and healthy controls. T-helper type 1 (Th1), 2 (Th2) and 17 (Th17) cells, regulatory T-cells (Treg) and interleukin (IL)-21+CD4+T-cells in total or sorted subsets of peripheral blood mononuclear cells and ABPA bronchoalveolar lavage fluid (BALF) were analysed using flow cytometry. RNA sequencing of subsets of CD4+T-cells was done in exacerbated ABPA patients and healthy controls. Antibodies of T-/B-cell co-cultures in vitro were measured.

Results: ABPA patients had increased Th2 cells, similar numbers of Treg cells and decreased circulating Th1 and Th17 cells. IL-5+IL-13+IL-21+CD4+T-cells were rarely detected in healthy controls, but significantly elevated in the blood of ABPA patients, especially the exacerbated ones. We found that IL-5+IL-13+IL-21+CD4+T-cells were mainly peripheral T-helper (Tph) cells (PD-1+CXCR5-), which also presented in the BALF of ABPA patients. The proportions of circulating Tph cells were similar among ABPA patients, asthma patients and healthy controls, while IL-5+IL-13+IL-21+ Tph cells significantly increased in ABPA patients. Transcriptome data showed that Tph cells of ABPA patients were Th2-skewed and exhibited signatures of follicular T-helper cells. When co-cultured in vitro, Tph cells of ABPA patients induced the differentiation of autologous B-cells into plasmablasts and significantly enhanced the production of IgE.

Conclusion: We identified a distinctly elevated population of circulating Th2-skewed Tph cells that induced the production of IgE in ABPA patients. It may be a biomarker and therapeutic target for ABPA.


Conflict of interest statement

Conflict of interest: The authors have no potential conflicts of interest to disclose.

Figures

FIGURE 1
FIGURE 1
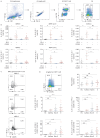
Interleukin (IL)-5+IL-13+IL-21+CD4+T-cells were identified in allergic bronchopulmonary aspergillosis (ABPA). a) Gating (left) and the ratio of IL-5+IL-13+CD4+ T-cells in the blood. b) The percentage of IL-5+IL-13+ cells in IL-13+CD4+T-cells in the blood. c) Gating (top) and the ratio of IL-21+CD4+ T-cells in the blood. d) Gating (left) and the ratio of IL-13+IL-21+CD4+ T-cells in the blood. e) Gating (left) and the ratio of IL-5+IL-13+IL-21+CD4+ T-cells in the blood. f) Receiver operating characteristics (ROC) curve analyses of IL-5+IL-13+IL-21+CD4+T-cells in the blood for the discrimination of ABPA patients from healthy controls (HC)/asthma patients (left) and ABPA exacerbation (right). g) The percentage of IL-5+IL-13+IL-21+ cells in IL-21+CD4+T-cells in the blood. HC (n=22), asthma patients (n=23) and ABPA patients (n=67, exacerbated (E, n=36), nonexacerbated (non-E, n=31)). Data are presented as median (interquartile range). ns: nonsignificant (p>0.05); AUC: area under the curve. *: p<0.05, **: p<0.01, ***: p<0.001, ****: p<0.0001. ANOVA with Dunnett's multiple comparisons or Mann–Whitney test.
FIGURE 2
FIGURE 2
Most interleukin (IL)-5+IL-13+IL-21+CD4+T-cells in the blood were peripheral T-helper (Tph) cells. a) Multigating strategy for flow cytometry sorting of PD-1+CXCR5+, PD-1+CXCR5, PD-1CXCR5+ and PD-1CXCR5CD4+T-cells in the blood. b) Comparing the percentages of IL-13+IL-21+ (top) and IL-5+IL-13+IL-21+ (bottom) PD-1+CXCR5+, PD-1+CXCR5, PD-1CXCR5+ and PD-1CXCR5CD4+T-cells in the blood of exacerbated allergic bronchopulmonary aspergillosis (ABPA) patients, nonexacerbated ABPA patients and asthma patients. Data were paired in each plot. c) Gating of PD-1+CXCR5Tph cells in the bronchoalveolar lavage fluid (BALF) of ABPA patients. d) Gating of PD-1+CXCR5+, PD-1+CXCR5, PD-1CXCR5+ and PD-1CXCR5CD4+T-cells in the blood (left) and the percentages of PD-1+CXCR5Tph cells in the blood (right). e) Summary plots of the percentages of IL-13+IL-21+ (left) and IL-5+IL-13+IL-21+ (right) cells in Tph cells (top). Summary plots of the percentages of IL-13+IL-21+ (left) and IL-5+IL-13+IL-21+ (right) Tph cells in the blood (bottom). Healthy controls (HC, n=7), asthma patients (n=6), non-exacerbated ABPA patients (non-E, n=10) and exacerbated ABPA patients (E, n=11). Data are presented as mean±sd. SSC: side scatter; FSC: forward scatter; ns: nonsignificant (p>0.05). *: p<0.05, **: p<0.01, ***: p<0.001, ****: p<0.0001. Dunnett's multiple-comparison test.
FIGURE 3
FIGURE 3
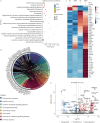
The heterogeneity of peripheral T-helper (Tph) cells was affirmed by transcriptome analysis. a) The scatterplot and b) chord diagram of gene ontology (GO) enrichment analysis between the Tph cells of allergic bronchopulmonary aspergillosis (ABPA) patients and healthy controls (HC). c) Heatmap of differentially expressed genes between Tph cells and PD-1CXCR5CD4+T-cells in ABPA patients (n=2) and healthy controls (n=2). d) Volcano plot of differentially expressed genes in the Tph cells of exacerbated ABPA patients compared to healthy controls. Red datapoints represent genes significantly upregulated in ABPA patients. Blue datapoints represent genes significantly downregulated in ABPA patients. FC: fold change
FIGURE 4
FIGURE 4
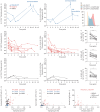
Circulating interleukin (IL)-5+IL-13+IL-21+ T-helper cells were relative to allergic bronchopulmonary aspergillosis (ABPA) disease status. a) The dynamic change of circulating IL-5+CD4+T-cells (left) and IL-5+IL-13+IL-21+CD4+T-cells (right) of ABPA patients. Patients in the repeated exacerbation (repeated E) group (n=2) experienced exacerbation twice; single exacerbation (single E) (n=13) and stable (n=3). Time point interval is 1 month. For patients in “repeated E” and “single E” groups, time point 1 is before treatment. b) The representative plot of IL-5 fluorescence distribution of IL-5+CD4+ T-cells before and 1 month after the treatment of an exacerbated ABPA patient. c) The median fluorescence index (MFI) of IL-5 (top), IL-13 (centre) and IL-21 (bottom) in IL-5+, IL-13+ and IL-21+CD4+T-cells, respectively, (n=11) at exacerbation and 1 month after the treatment. *: p<0.05, **: p<0.01 (t-test). d) Correlation of blood eosinophil counts with IL-5+IL-13+IL-21+CD4+T-cells (left) in exacerbated ABPA (n=36), nonexacerbated ABPA (ABPA non-E, n=29) and asthma patients (n=23). Correlation of serum total IgE with IL-5+IL-13+IL-21+CD4+T-cells (centre) in exacerbated ABPA (n=35), nonexacerbated ABPA (n=30) and asthma patients (n=23). Correlation of serum Asf-IgE with IL-5+IL-13+IL-21+CD4+T-cells (right) in exacerbated ABPA patients (n=34). Spearman test.
FIGURE 5
FIGURE 5
Peripheral T-helper (Tph) cells of allergic bronchopulmonary aspergillosis (ABPA) patients induced B-cell differentiation and IgE secretion in vitro. a) Schematic representation of Tph, follicular T-helper (Tfh) and B-cell sorting from peripheral blood of ABPA patients/healthy donors and T-/B-cell co-culture in vitro. b) Multigating strategy for sorting of B-cells. c) Multigating strategy of CD38+CD27+ plasmablasts after co-culture in vitro for 7 days. d) The percentages of CD38+CD27+ plasmablasts after co-culture in vitro for 7 days using cells from five ABPA donors and seven healthy donors. ANOVA with Tukey's multiple comparisons. e) IgG and IgE concentration in the supernatants of co-cultures using cells from four ABPA donors. Dunnett's multiple comparisons test. f) Representative ELISpot dot plots of IgG plasmablasts after co-culture in vitro. g) The frequency of IgG plasmablasts after co-culture in vitro from four ABPA and three healthy donors. SSC: side scatter; FSC: forward scatter; SEB: staphylococcal enterotoxin B; ns: nonsignificant (p>0.05). *: p<0.05, **: p<0.01. Dunnett's multiple comparisons test.

Comment in

References

    1. Agarwal R, Chakrabarti A, Shah A, et al. . Allergic bronchopulmonary aspergillosis: review of literature and proposal of new diagnostic and classification criteria. Clin Exp Allergy 2013; 43: 850–873. doi:10.1111/cea.12141 - DOI - PubMed
    1. Agarwal R, Sehgal IS, Dhooria S, et al. . Allergic bronchopulmonary aspergillosis. Indian J Med Res 2020; 151: 529–549. doi:10.4103/ijmr.IJMR_1187_19 - DOI - PMC - PubMed
    1. Lu HW, Mao B, Wei P, et al. . The clinical characteristics and prognosis of ABPA are closely related to the mucus plugs in central bronchiectasis. Clin Respir J 2020; 14: 140–147. doi:10.1111/crj.13111 - DOI - PMC - PubMed
    1. Xu X, Xu JF, Zheng G, et al. . CARD9S12N facilitates the production of IL-5 by alveolar macrophages for the induction of type 2 immune responses. Nat Immunol 2018; 19: 547–560. doi:10.1038/s41590-018-0112-4 - DOI - PubMed
    1. Walker JA, McKenzie ANJ. TH2 cell development and function. Nat Rev Immunol 2018; 18: 121–133. doi:10.1038/nri.2017.118 - DOI - PubMed