. 2024 May 1;44(18):e1461232024.
doi: 10.1523/JNEUROSCI.1461-23.2024.

Differential Expression Analysis Identifies Candidate Synaptogenic Molecules for Wiring Direction-Selective Circuits in the Retina

Affiliations

Differential Expression Analysis Identifies Candidate Synaptogenic Molecules for Wiring Direction-Selective Circuits in the Retina

Joshua M Tworig et al. J Neurosci. .

Abstract

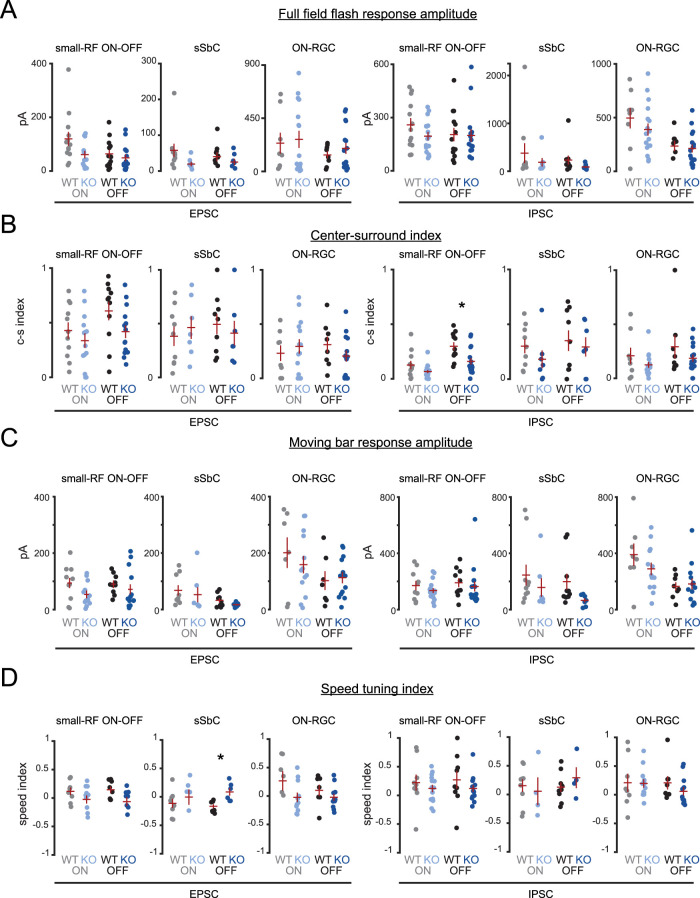
An organizational feature of neural circuits is the specificity of synaptic connections. A striking example is the direction-selective (DS) circuit of the retina. There are multiple subtypes of DS retinal ganglion cells (DSGCs) that prefer motion along one of four preferred directions. This computation is mediated by selective wiring of a single inhibitory interneuron, the starburst amacrine cell (SAC), with each DSGC subtype preferentially receiving input from a subset of SAC processes. We hypothesize that the molecular basis of this wiring is mediated in part by unique expression profiles of DSGC subtypes. To test this, we first performed paired recordings from isolated mouse retinas of both sexes to determine that postnatal day 10 (P10) represents the age at which asymmetric synapses form. Second, we performed RNA sequencing and differential expression analysis on isolated P10 ON-OFF DSGCs tuned for either nasal or ventral motion and identified candidates which may promote direction-specific wiring. We then used a conditional knock-out strategy to test the role of one candidate, the secreted synaptic organizer cerebellin-4 (Cbln4), in the development of DS tuning. Using two-photon calcium imaging, we observed a small deficit in directional tuning among ventral-preferring DSGCs lacking Cbln4, though whole-cell voltage-clamp recordings did not identify a significant change in inhibitory inputs. This suggests that Cbln4 does not function primarily via a cell-autonomous mechanism to instruct wiring of DS circuits. Nevertheless, our transcriptomic analysis identified unique candidate factors for gaining insights into the molecular mechanisms that instruct wiring specificity in the DS circuit.

Keywords: RNA-seq; direction selectivity; retina; retinal ganglion cell; two-photon calcium imaging.


Conflict of interest statement

The authors declare no competing financial interests.

Figures

Figure 1.
Figure 1.
Asymmetric inhibitory SAC→DSGC synaptogenesis emerges beginning at P10. A, Top, Schematic showing paired recording between a SAC and DSGC at P10 in the Chat-Cre;nGFP;Trhr-GFP mouse. Bottom, SACs were depolarized to 0 mV while holding DSGCs at the varying potentials (VH) indicated. Corresponding currents recorded in the DSGC are shown below the voltage step. Depolarization of the SAC induces release of GABA onto the DSGC throughout the duration of the depolarization and during the subsequent tail current in the SAC upon hyper-repolarization. DSGC currents have been leak subtracted. B, Peak inhibitory conductances at P9 and P10 for null and preferred side SAC→DSGC pairs. Inhibitory conductances are small at P9 for all SAC→DSGC pairs. By P10, null-side SAC→DSGC pairs exhibit an increased inhibitory conductance while preferred side pairs do not. n = 4 DSGCs at P9, n = 5 DSGCs at P10. Multiple preferred- and null-side SACs were recorded from each DSGC. Peak inhibitory conductances from P7 and P14–40 null and preferred side pairs (Wei et al., 2010) are shown on the right y-axis. Error bars represent standard deviation. n.s., nonsignificant; *p = 0.014; t test. C, Left, Z-projections of confocal image stacks of SACs stained for tdTomato at P7 (top) and P14 (bottom). Middle, Imaris reconstructions. Right, Magnified image of dendritic processes of SACs and Imaris reconstructions. Dotted circles indicate manually identified varicosities. D, Number of manually identified varicosities per SAC during the second postnatal week. n = 5 SACs per age. Kruskal–Wallis rank sum *p < 0.01. Pairwise Wilcoxon rank sum tests revealed significant differences in varicosity count beginning at P10 (P10 vs P9, p = 0.048; P10 vs P8, p = 0.026; P10 vs P12, p = 0.015; P9 vs P8, p = 0.119; P12 vs P14, p = 0.690; false discovery rate corrected).
Figure 2.
Figure 2.
RNA sequencing strategy and identification of differentially expressed genes. A, Representative fluorescence images of live whole-mount retinas showing the distribution of GFP+ DSGCs in the Drd4- (left), Trhr- (middle), and Hb9-GFP (right) BAC transgenic mouse lines. Drd4-GFP and Trhr-GFP images adapted from Huberman et al. (2009) and Rivlin-Etzion et al. (2011). Arrows indicate population tuning preferences among each DSGC type. Scale bar, 500 μm. B, Sample collection and bulk RNA sequencing protocol. Retinas were isolated from P10 mice and then dissociated in papain. GFP+ cells were separated via FACS and processed for RNA isolation, cDNA library preparation, and RNA sequencing. P10 mouse image from The Jackson Laboratory (2012). C, Validation of RNA-seq using known RGC or DSGC markers. Scaled expression is calculated as the log2 transformation of estimated counts for each gene. D, Top 15 differentially expressed transcripts which were enriched in horizontal-preferring DSGCs (left) or vertical-preferring DSGCs (right). E, Volcano plot of −log10(qval) versus β value (effect size) showing transcripts significantly upregulated (red) or downregulated (blue) in ventral-preferring DSGCs. q value cutoff was 0.01, and β cutoffs were less than or equal to −2 and ≥2. A subset of transcripts which passed these criteria are denoted with text and a gold outline around the corresponding point. F, Top 10 GO terms for cellular component (top) and cellular function (bottom) for genes identified as significantly differentially expressed between nasal- and ventral-preferring DSGCs. Similar analysis was completed comparing differentially expressed transcripts between Trhr-GFP and Drd4-GFP DSGCs (Extended Data Fig. 2-1), Drd4-GFP and Hb9-GFP DSGCs (Extended Data Fig. 2-2), Trhr-GFP and Hb9-GFP DSGCs (Extended Data Fig. 2-3), and the intersection of transcripts that were differentially expressed between Drd4-GFP and Hb9-GFP DSGCs and between Trhr-GFP and Hb9-GFP DSGCs (Extended Data Fig. 2-4).
Figure 3.
Figure 3.
Cbln4 mRNA is enriched in ventral-preferring DSGCs and other RGC and amacrine cell subpopulations. A, Estimated read counts generated from Kallisto quantification of Cbln4 mRNA expression from bulk RNA-seq (Drd4-GFP, 19.96 ± 5.29; Trhr-GFP, 11.03 ± 3.33; Hb9-GFP, 2,654 ± 71.25; Wald test q value = 1.97 × 10−47. n = 3 biological replicates per genotype). B, Top, FISH images showing Cbln4 mRNA expression (magenta) in Drd4-GFP (left), Trhr-GFP (middle), and Hb9-GFP DSGCs (right) at P10. Arrowheads denote Cbln4 mRNA-positive somas in the GCL. Arrows indicate Cbln4 mRNA puncta colocalized with an Hb9-GFP dendrite in the IPL. Bottom, insets from top fluorescence images with GFP and Cbln4 mRNA channels separated to highlight differential expression between GFP+ DSGCs, which are outlined in white. Scale bar, 20 μm. C, Quantification of Cbln4 mRNA expression at P10. Each dot denotes the number of fluorescent puncta for a given DSGC. One-way ANOVA p = 1.14 × 10−6. Two-sample t tests were performed for pairwise expression comparisons in C; *p < 0.05 (Drd4-GFP, 4.6 ± 2.1 puncta/cell; Trhr-GFP, 3.0 ± 1.5 puncta/cell; Hb9-GFP, 25.8 ± 3.1 puncta/cell; n, Drd4-GFP = 5 cells/2 mice; n, Trhr-GFP = 9 cells/2 mice; n, Hb9-GFP = 9 cells/2 mice). D, scRNA-seq expression data exported from the Broad Institute Single Cell Portal (Tran et al., 2019; Yan et al., 2020; Shekhar et al., 2022). Left and middle, Expression data for all P5 and adult RGC transcriptional clusters which express Cbln4 mRNA in 10% or more cells. The rightmost cluster for these panels contains expression data for nasal/temporal (NT) ON–OFF DSGCs, which do not express detectable Cbln4 mRNA. P5 clusters were matched to adult clusters via coexpression of cluster-defining markers at each age. Bottom left and middle panels show expression of postsynaptic markers which have been reported to interact with Cbln4 in some capacity. Right, Expression data for Cbln4 in amacrine cell clusters. Also shown are expression levels of presynaptic neurexins in SACs. Scaling of expression is relative to each gene's expression across all cells in each cluster.
Figure 4.
Figure 4.
Cerebellin-4 reporter expression in Cbln4fl/fl mice and Vglut2-Cre;Cbln4fl/fl mice and approach for DSGC targeting. A, Confocal images of Cbln4fl/fl (left) and Vglut2-Cre;Cbln4fl/fl (right) retina slices stained using RNAscope in situ hybridization using probes for Cbln4 (green) and immunohistochemistry using RBPMS antibody to label RGCs (red). Panels on the right are magnifications of insets in the left panels for each condition. Scale bar, 20 µm. GCL, ganglion cell layer; IPL, inner plexiform layer; INL, inner nuclear layer. B, Quantification of Cbln4 expression as histograms showing the percent of RBPMS+ RGCs that express varying levels of Cbln4 in Cbln4fl/fl (black; 267 cells) and Vglut2-Cre;Cbln4fl/fl (blue; 354 cells) retinas. C, Quantification of Cbln4 expression counted as punctate dots per RBPMS+ cell in Cbln4fl/fl (black; 102 cells) and Vglut2-Cre;Cbln4fl/fl (blue; 51 cells) retinas. Unpaired t test. D, Representative two-photon fluorescence images of reporter expression in the GCL. Left, mVenus expression in Cbln4fl/fl retina. Arrowheads denote putative Cbln4+ RGCs, the lower of which corresponds to the DSGC targeted in B. Middle, tdTomato and mVenus expression in VGlut2-Cre;Cbln4fl/fl retina. Arrowheads denote tdTomato+ Cbln4−/− RGCs. Right, GFP, tdTomato, and mVenus expression in Hb9-GFP;VGlut2-Cre;Cbln4fl/fl retina. Arrowheads denote Hb9-GFP+, Cbln4−/− DSGCs. Scale bar, 20 μm. E, Left, Fluorescence image of the same field of view as in A, left, showing a targeted ventral-preferring DSGC cell body filled with Alexa-594 from a recording electrode. Scale bar, 20 μm. Right, Maximum intensity projection of a 3D fluorescence image of the dye-filled DSGC in B, left. ON- (green) and OFF-stratifying (magenta) dendrites were segmented for further analysis. Scale bar, 50 μm. F, Schematic of experimental setup. A two-photon microscope is fitted with an LED and digital mirror device for visual stimulation and a whole-cell recording electrode for voltage-clamp recording from DSGCs. Visually evoked calcium transients or synaptic currents were recorded during presentation of moving bars in eight directions.
Figure 5.
Figure 5.
Population calcium imaging of Cbln4fl/fl and Vglut2-Cre;Cbln4fl/fl DSGCs during moving bar stimuli. A, Two example fields of view (FOVs) showing Hb9-GFP DSGCs (ventral-preferring) in Cbln4fl/fl (top) and Vglut2-Cre;Cbln4fl/fl (which we refer to as Cbln4−/−, bottom). Scale bar, 100 µm. B, Left, Example tuning curves for individual Hb9-GFP DSGCs with calcium responses corresponding to each of the eight presented directions. Right, Polar plots of Hb9-GFP population tuning from Cbln4fl/fl and Vglut2-Cre;Cbln4fl/fl mice, where each line represents a cell's preferred direction and vector sum. n, Cbln4fl/fl, 265 Hb9-GFP DSGCs/5 mice; n, Vglut2-Cre;Cbln4fl/fl, 252 Hb9-DSGCs/4 mice. C, Left, Average number of Hb9-GFP cells per FOV in Cbln4fl/fl and Vglut2-Cre;Cbln4fl/fl mice. p = 0.88, unpaired t test. Right, Summary data for the percentile rank of each cell's DSI compared with permutations where the directions of the moving bar are block shuffled. For reference, 95th percentile is considered statistically significantly direction selective (red dashed line; p = 0.53; unpaired t test). D, Summary data of max ΔF / F response to moving bars among significantly direction selective Hb9-GFP cells in the preferred and null direction in Cbln4fl/fl and Vglut2-Cre;Cbln4fl/fl mice. n, Cbln4fl/fl, 73 Hb9-GFP DSGCs/5 WT mice; n, Cbln4−/−, 57 Hb9-DSGCs/4 KO mice. For all panels, data corresponding to Cbln4fl/fl (WT) are black, and those corresponding to Vglut2-Cre;Cbln4fl/fl (KO) are blue. *p < 0.05, unpaired t test. E, Average ΔF / F response for moving bars in eight different directions for all significantly direction-selective RGCs for each preferred direction. F, DSI and vector sum of significantly direction-selective ventral-preferring ganglion cells compared with those of significantly direction-selective nasal-preferring cells in Cbln4fl/fl and Vglut2-Cre;Cbln4fl/fl mice. n, Cbln4fl/fl, 163 ventral-preferring, 171 nasal-preferring/5 mice; n, Vglut2-Cre;Cbln4fl/fl, 96 ventral-preferring, 133 nasal-preferring/4 KO mice. *p < 0.05, unpaired t test. G, Same as F but for only Hb9-GFP DSGCs (ventral-preferring). n, Cbln4fl/fl, 48 Hb9-GFP DSGCs/5 mice; n, Vglut2-Cre;Cbln4fl/fl, 39 Vglut2-Cre;Cbln4fl/fl; Hb9 mice. See Table 1 for description of populations.
Figure 6.
Figure 6.
Dendritic morphology of ventral-preferring ON–OFF DSGCs is preserved in Cbln4−/− retinas. A, Maximum intensity projections of ventral-preferring ON–OFF DSGC reconstructed dendritic skeletons, color coded by IPL depth, in Cbln4fl/fl (top) and Vglut2-Cre;Cbln4fl/fl (bottom) mice. Scale bar, 50 µm. B, Sholl intersection profiles for ventral-preferring ON–OFF DSGCs. Top, ON-dendritic arbor. Bottom, OFF-dendritic arbor. C, Summary data for dendritic morphology quantification of ventral-preferring DSGCs from Cbln4fl/fl and Vglut2-Cre;Cbln4fl/fl mice. Top, from left to right, Total dendrite length, dendrite–soma center-on-mass (COM) distance, and number of dendritic tips. Bottom, from left to right, Dendrite ON–OFF index, dendrite–soma angle deviation from ventral direction, and number of branch points. Error bars represent SEM. n, Cbln4fl/fl, 16 ventral-preferring DSGCs/10 mice; n, Vglut2-Cre;Cbln4fl/fl, 18 ventral-preferring DSGCs/8 mice.
Figure 7.
Figure 7.
Tuning, strength, and timing of synaptic inputs onto ventral-preferring ON–OFF DSGCs during moving bar stimuli are preserved in Vglut2-Cre;Cbln4fl/fl retinas. A, Maximum intensity projections of volumetric two-photon images of dye-filled ventral-preferring ON–OFF DSGCs in Cbln4fl/fl (top) and Vglut2-Cre;Cbln4fl/fl (bottom) mice. Scale bar, 50 µm. B, Example EPSCs (left) and IPSCs (right) recorded from Cbln4fl/fl (top) and Vglut2-Cre;Cbln4fl/fl (bottom) ventral-preferring DSGCs during drifting bar stimuli at 1,000 µm/s. Recordings correspond to cells in A. Polar plots in middle of current traces show peak onset (gray or light blue) and offset (black or dark blue) current for each direction, along with vector sum magnitudes and directions. C, Population polar plots showing tuning of EPSCs (left) and IPSCs (right) among ventral-preferring DSGCs from Cbln4fl/fl and Vglut2-Cre;Cbln4fl/fl mice, where each line represents a cell's preferred direction and vector sum for EPSCs or IPSCs. n, Cbln4fl/fl: 35 ventral-preferring DSGCs/10 mice; n, Vglut2-Cre;Cbln4fl/fl: 17 ventral-preferring DSGCs/8 mice. D, Summary data showing all ventral-preferring DSGC synaptic responses to stimuli moving at 1,000 µm/s. IPSC magnitude in the null direction (top left), IPSC magnitude in the preferred direction (top right), IPSC DSI (bottom left), and average EPSC magnitude (bottom right) for both genotypes and for ON and OFF responses. Preferred and null directions for each DSGC were determined using the vector sum angle for IPSCs. Cells that did not have asymmetric dendrites (based on the asymmetry index) are denoted with gray-filled circles. E, Same for as D for stimuli moving at 250 µm/s. F, Timing offsets between peak EPSCs and IPSCs in the preferred and null directions for both genotypes for bars moving at 1,000 µm/s (top) and bars moving at 250 µm/s (bottom). These analyses included cells that did not have asymmetric dendrites (gray-filled circles). All error bars represent SEM.
Figure 8.
Figure 8.
Cbln4 reporter and knock-out RGCs qualitatively align with defined morphological types. A, Dendritic reconstructions of the most commonly encountered Cbln4-expressing RGC types are plotted and colored by normalized IPL depth for Cbln4fl/fl (left) and VGlut2-Cre;Cbln4fl/fl (right). B, Cbln4-expressing RGC types were qualitatively matched to Eyewire Museum RGC types by their stratification profiles, arbor size, and dendritic branching characteristics. Scale bar, 50 μm. Dendritic reconstructions are also provided for Cbln4 reporter-expressing ON–OFF DSGCs (Extended Data Fig. 8-1), small receptive field ON–OFF RGCs (Extended Data Fig. 8-2), suppressed-by-contrast and other ON–OFF RGCs (Extended Data Fig. 8-3), and other unclassified RGCs (Extended Data Fig. 8-4).
Figure 9.
Figure 9.
Cbln4 reporter-expressing RGCs exhibit distinct but overlapping morphological properties and ventrally oriented dendrites. A, Sholl intersection profiles for the major Cbln4-positive RGC types identified. Top, ON-dendritic arbor. Bottom, OFF-dendritic arbor. B, Sholl intersection profiles for the same cell types in A, compared with type-matched Vglut2-Cre;Cbln4fl/fl RGCs. C, Dendritic asymmetry index versus angle of asymmetry, calculated as deviation of dendrite–soma vector from the ventral orientation.
Figure 10.
Figure 10.
Strength and tuning of synaptic inputs in Cbln4 reporter-expressing non-direction-selective RGCs are preserved in Vglut2-Cre;Cbln4fl/fl retinas. A, Peak ON- and OFF-EPSCs (left) and ON- and OFF-IPSCs (right) for Cbln4fl/fl (WT) and Vglut2-Cre;Cbln4fl/fl (KO) mice during full-field flash stimuli. Responses are plotted separately for all small-receptive field (RF) ON–OFF, sustained suppressed-by-contrast (sSbC), and ON-RGCs. B, Center-surround indices during stimulation with variable size spots, plotted as in A. C, Peak ON- and OFF-EPSCs (left) and ON- and OFF-IPSCs (right) during moving bar stimuli, plotted as in A and B. D, Speed tuning indices for the same cells as in A–C, calculated from peak current responses to moving bars at 250 µm/s and 1,000 µm/s. All error bars represent SEM. *p < 0.05, unpaired t test.

References

    1. Akrouh A, Kerschensteiner D (2015) Morphology and function of three VIP-expressing amacrine cell types in the mouse retina. J Neurophysiol 114:2431. 10.1152/JN.00526.2015 - DOI - PMC - PubMed
    1. Al-Khindi T, Sherman MB, Kodama T, Gopal P, Pan Z, Kiraly JK, Zhang H, Goff LA, du Lac S, Kolodkin AL (2022) The transcription factor Tbx5 regulates direction-selective retinal ganglion cell development and image stabilization. Curr Biol 32:4286–4298.e5. 10.1016/J.CUB.2022.07.064 - DOI - PMC - PubMed
    1. Andrews, S. (2010). FastQC: a quality control tool for high throughput sequence data. Babraham bioinformatics. http://www.bioinformatics.babraham.ac.uk/projects/fastqc/
    1. Antinucci P, Suleyman O, Monfries C, Hindges R (2016) Neural mechanisms generating orientation selectivity in the retina. Curr Biol 26:1802–1815. 10.1016/j.cub.2016.05.035 - DOI - PMC - PubMed
    1. Araç D, Li J (2019) Teneurin structure: splice variants of a bacterial toxin homolog specifies synaptic connections. Front Neurosci 13:838. 10.3389/fnins.2019.00838 - DOI - PMC - PubMed

Publication types