. 2024 Apr 16;9(4):e0020624.
doi: 10.1128/msystems.00206-24. Epub 2024 Mar 22.

Dual RNA sequencing of Helicobacter pylori and host cell transcriptomes reveals ontologically distinct host-pathogen interaction

Affiliations

Dual RNA sequencing of Helicobacter pylori and host cell transcriptomes reveals ontologically distinct host-pathogen interaction

Wei Hu et al. mSystems. .

Abstract

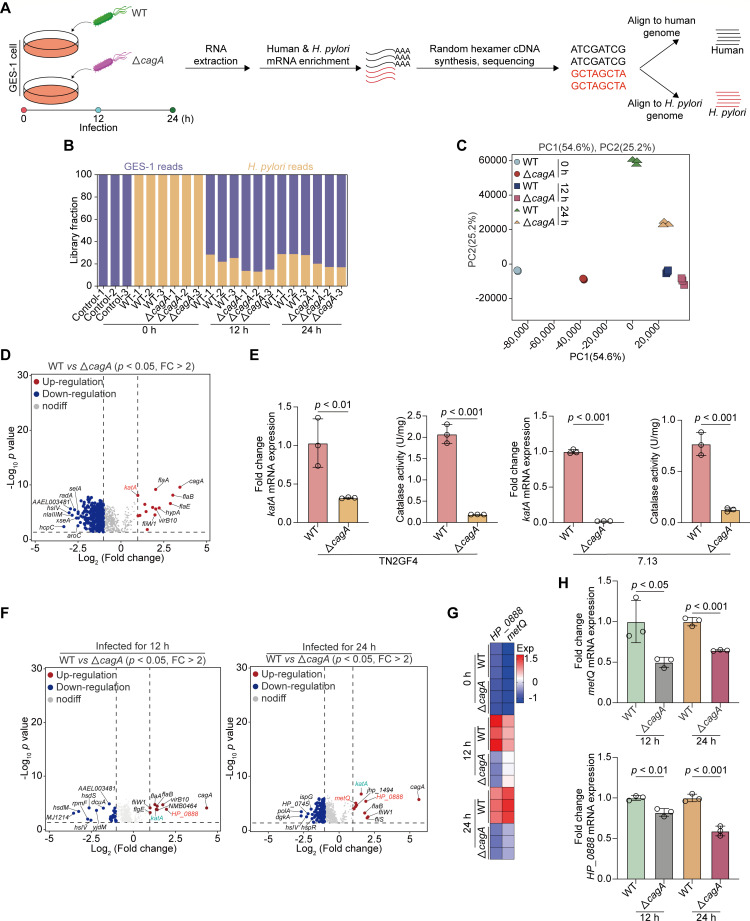
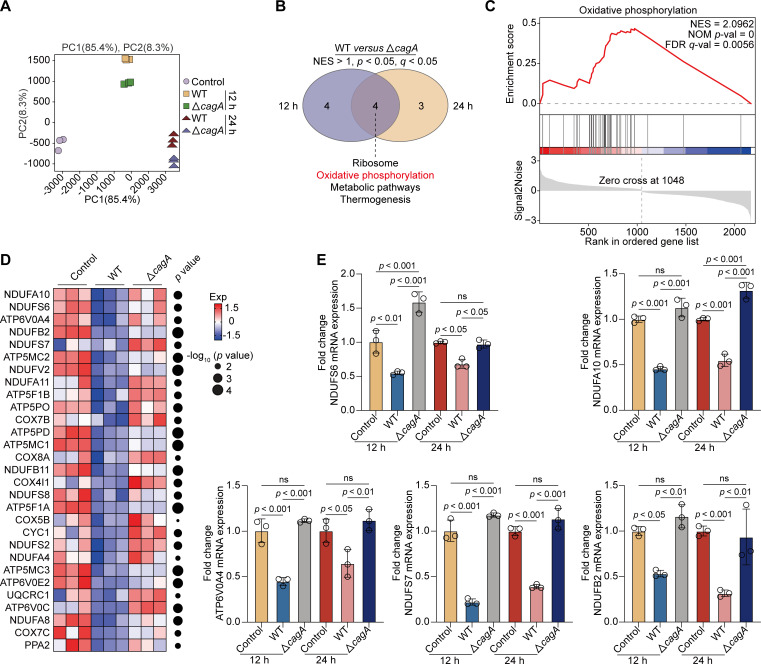
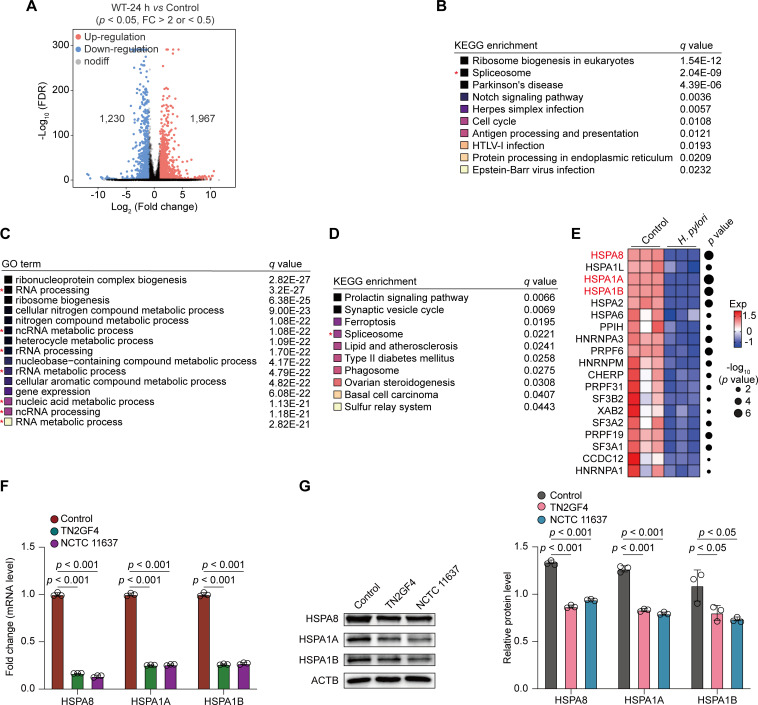
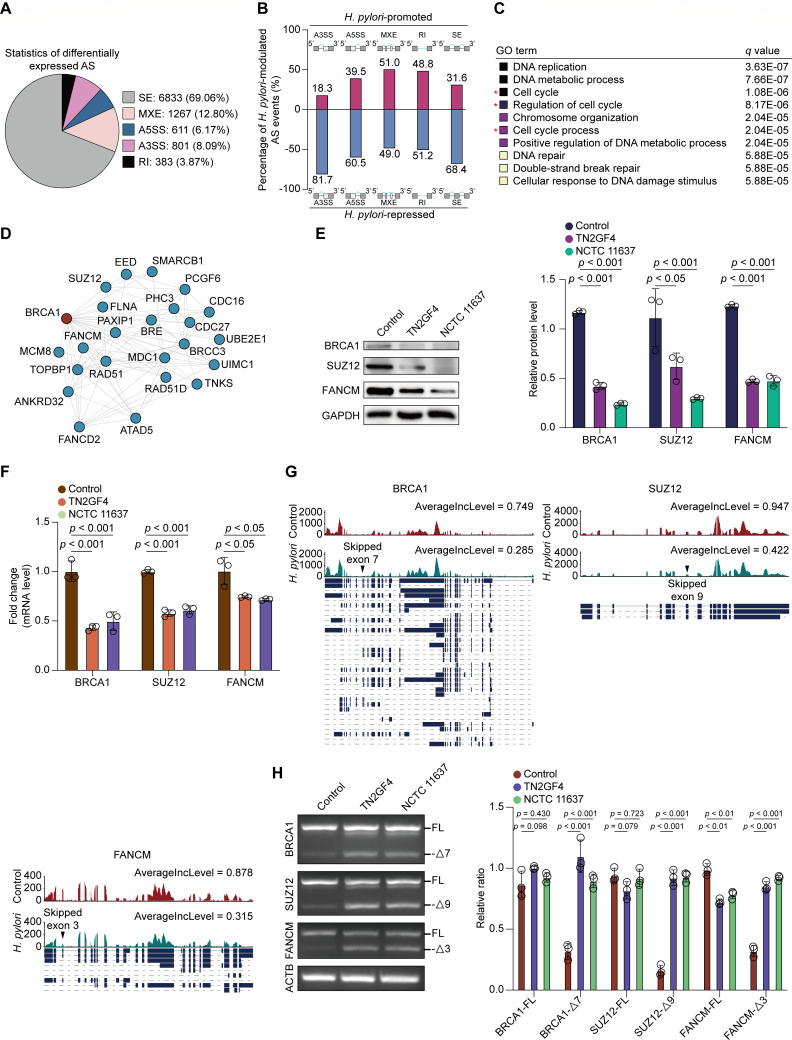
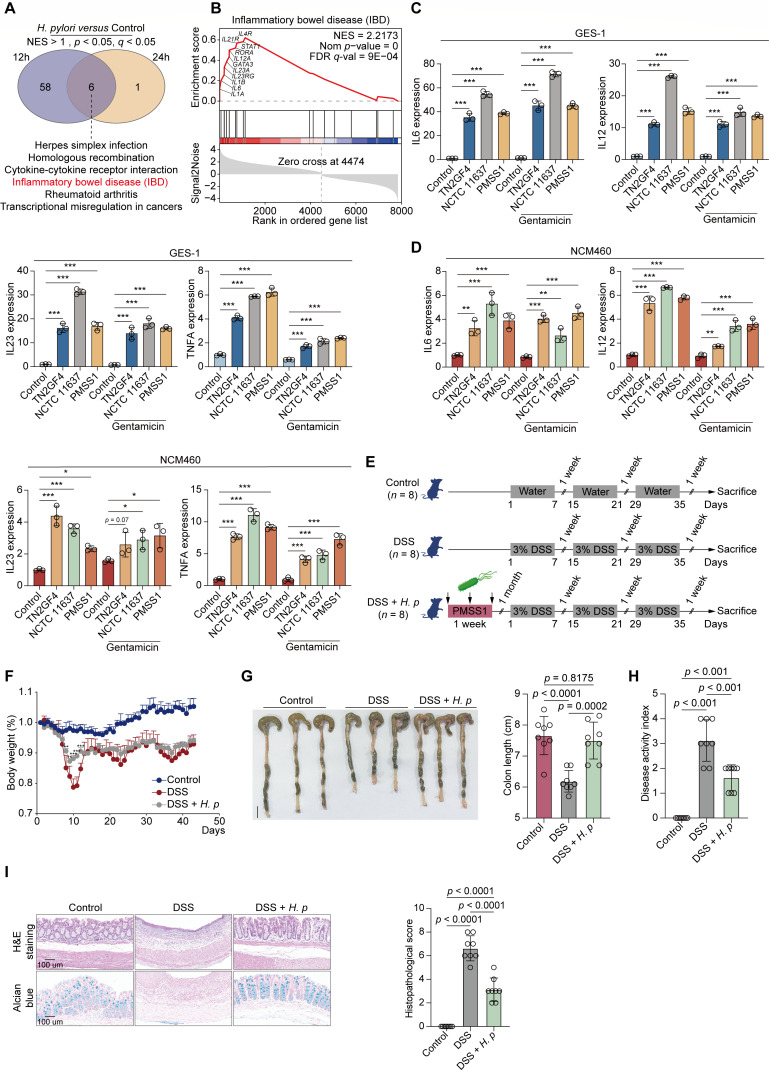
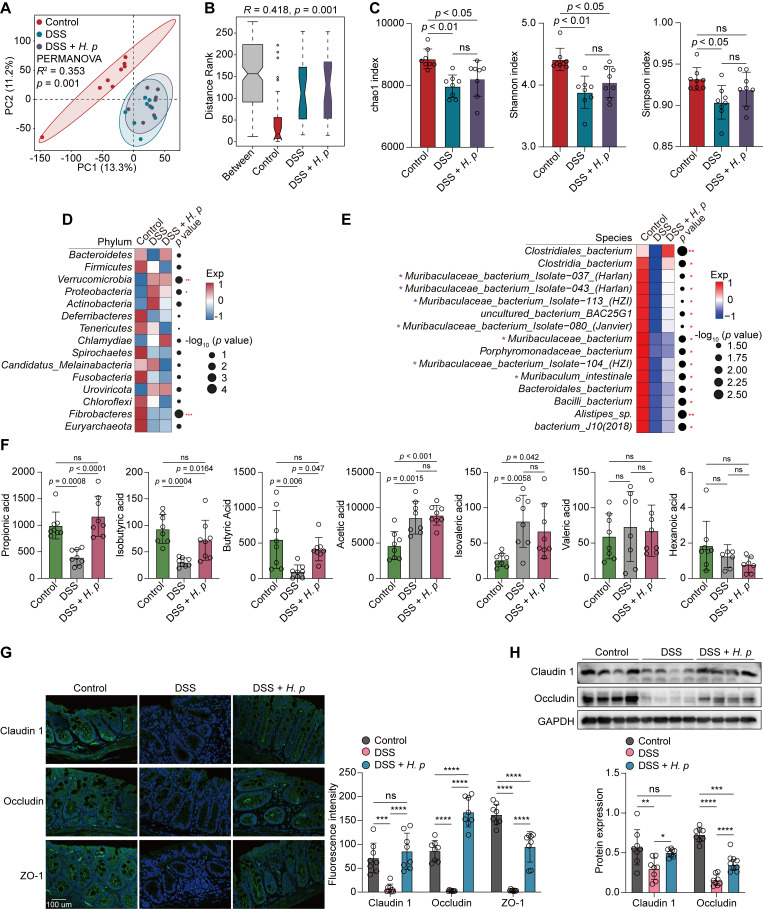
Helicobacter pylori is a highly successful pathogen that poses a substantial threat to human health. However, the dynamic interaction between H. pylori and the human gastric epithelium has not been fully investigated. In this study, using dual RNA sequencing technology, we characterized a cytotoxin-associated gene A (cagA)-modulated bacterial adaption strategy by enhancing the expression of ATP-binding cassette transporter-related genes, metQ and HP_0888, upon coculturing with human gastric epithelial cells. We observed a general repression of electron transport-associated genes by cagA, leading to the activation of oxidative phosphorylation. Temporal profiling of host mRNA signatures revealed the downregulation of multiple splicing regulators due to bacterial infection, resulting in aberrant pre-mRNA splicing of functional genes involved in the cell cycle process in response to H. pylori infection. Moreover, we demonstrated a protective effect of gastric H. pylori colonization against chronic dextran sulfate sodium (DSS)-induced colitis. Mechanistically, we identified a cluster of propionic and butyric acid-producing bacteria, Muribaculaceae, selectively enriched in the colons of H. pylori-pre-colonized mice, which may contribute to the restoration of intestinal barrier function damaged by DSS treatment. Collectively, this study presents the first dual-transcriptome analysis of H. pylori during its dynamic interaction with gastric epithelial cells and provides new insights into strategies through which H. pylori promotes infection and pathogenesis in the human gastric epithelium.

Importance: Simultaneous profiling of the dynamic interaction between Helicobacter pylori and the human gastric epithelium represents a novel strategy for identifying regulatory responses that drive pathogenesis. This study presents the first dual-transcriptome analysis of H. pylori when cocultured with gastric epithelial cells, revealing a bacterial adaptation strategy and a general repression of electron transportation-associated genes, both of which were modulated by cytotoxin-associated gene A (cagA). Temporal profiling of host mRNA signatures dissected the aberrant pre-mRNA splicing of functional genes involved in the cell cycle process in response to H. pylori infection. We demonstrated a protective effect of gastric H. pylori colonization against chronic DSS-induced colitis through both in vitro and in vivo experiments. These findings significantly enhance our understanding of how H. pylori promotes infection and pathogenesis in the human gastric epithelium and provide evidence to identify targets for antimicrobial therapies.

Keywords: ATP-binding cassette transporter; Helicobacter pylori; alternative splicing; cytotoxin-associated genes A; dual RNA sequencing; inflammatory bowel disease; oxidative phosphorylation.


Conflict of interest statement

The authors declare no conflict of interest.

Figures

Fig 1
Fig 1
Identification of host-induced H. pylori-specific stress responses using dual RNA-Seq. (A–D) GES-1 cells were infected with WT or cagA-mutated H. pylori TN2GF4 strains (MOI 100) for 3 h and then exposed to gentamicin (100 µg/mL) for 12 or 24 h to eliminate the extracellular bacteria as detailed in “supplemental Materials and Methods.” (A) Experimental workflow for dual RNA-seq RNA extraction, library preparation, and sequencing processing. (B) The proportions of reads aligned to H. pylori or GES-1 cells in each library. On average, there are 46 million reads per library: 71.6% of the reads aligned to the human genome and 28.4% to the H. pylori genome. (C) Principal component analysis (PCA) of the H. pylori transcriptome from different experiment conditions. (D) Volcano plot showing the DEGs obtained from WT H. pylori TN2GF4 strain compared with cagA-mutated TN2GF4 strain at time 0 using the DESEq2 toolkit. P value < 0.05 was considered statistically significant, Benjamini-Hochberg adjusted two-sided Wilcoxon test. (E) Total mRNA or proteins were extracted from WT or cagA-mutated H. pylori TN2GF4 (left) or 7.13 (right) strains. The expression levels of katA mRNA and catalase activity were determined. H. pylori 16S rRNA was used as the loading control for katA mRNA. (F) Volcano plot showing the DEGs obtained from WT H. pylori TN2GF4 strain compared with cagA-mutated TN2GF4 strain after coculturing with GES-1 cells for 12 (left) or 24 h (right). P value < 0.05 was considered statistically significant, Benjamini-Hochberg adjusted two-sided Wilcoxon test. (G) Heatmap showing the expression of ATP-binding cassette (ABC) transporter-related genes, metQ and HP_0888, in WT or cagA-mutated H. pylori TN2GF4 strains after coculturing with GES-1 cells for 0, 12, or 24 h. Color coding was based on normalized expression levels. (H) GES-1 cells were infected with WT or cagA-mutated H. pylori TN2GF4 strains (MOI 100) for 3 h and then exposed to gentamicin (100 µg/mL) for 12 or 24 h to eliminate the extracellular bacteria. The expression levels of metQ (upper) and HP_0888 (down) mRNA were determined. H. pylori 16S rRNA was used as the loading control. All the quantitative data were presented as means ± SD from three independent experiments. *P < 0.05, **P < 0.01, and ***P < 0.001.
Fig 2
Fig 2
H. pylori cagA activated oxidative phosphorylation by disrupting the electron transportation. (A–D) GES-1 cells were infected with WT or cagA-mutated H. pylori TN2GF4 strains (MOI 100) for 3 h and then exposed to gentamicin (100 µg/mL) for 12 or 24 h to eliminate the extracellular bacteria. (A) PCA diagram showing the host cell transcriptome from different experiment conditions. (B) Venn diagram showing the number of GSEA-enriched biological pathways in GES-1 cells infected with WT versus cagA-mutated H. pylori TN2GF4 strains for 12 (left) or 24 h (right), with four pathways including oxidative phosphorylation (red) being simultaneously enriched in both two timepoints. (C) GSEA enrichment plot showed that the “oxidative phosphorylation” pathway was enriched in GES-1 cells infected with WT versus cagA-mutated H. pylori TN2GF4 strains for 24 h. (D) Heatmap showing the expression of ETC-related genes in uninfected GES-1 cells or cells infected with WT or cagA-mutated H. pylori TN2GF4 strains for 24 h. Dot size indicates the −log10 transformed P values, color coding based on normalized expression levels. (E) GES-1 cells were infected with WT or cagA-mutated H. pylori TN2GF4 strains (MOI 100) for 3 h and then exposed to gentamicin (100 µg/mL) for 12 or 24 h to eliminate the extracellular bacteria. The mRNA expression of NDUFS6, NDUFA10, ATP6V0A4, NDUFS7, and NDUFB2 was determined. β-Actin was used as the loading control. All the quantitative data were presented as means ± SD from three independent experiments. *P < 0.05, **P < 0.01, and ***P < 0.001.
Fig 3
Fig 3
Repressed expression of multiple splicing factors in response to H. pylori infection. (A–E) GES-1 cells were infected with WT or cagA-mutated H. pylori TN2GF4 strains (MOI 100) for 3 h and then exposed to gentamicin (100 µg/mL) for 24 h to eliminate the extracellular bacteria. (A) Volcano plot showing the DEGs obtained from GES-1 cells infected with WT H. pylori TN2GF4 strain for 24 h compared with mock infection (FC > 2 or <0.5, P value < 0.05). Of these, 1,967 DEGs were upregulated, whereas 1,230 DEGs were downregulated in H. pylori-infected cells. Benjamini-Hochberg adjusted two-sided Wilcoxon test. (B) KEGG annotation of the top 10 enriched biological pathways using the downregulated DEGs from WT H. pylori TN2GF4-infected GES-1 cells compared with mock infection after 24 h post-challenge. Colored squares represented the q value (black, small; yellow, big). (C) GO annotation of the top 15 enriched biological pathways using the downregulated DEGs from WT H. pylori TN2GF4-infected GES-1 cells compared with mock infection after 24 h post-challenge. Colored squares represented the q value (black, small; yellow, big). (D) KEGG annotation of the top 10 enriched biological pathways using the downregulated DEGs from cagA-mutated H. pylori TN2GF4-infected GES-1 cells compared with mock infection after 24 h post-challenge. Colored squares represented the q value (black, small; yellow, big). (E) Heatmap showing the expression of splicing regulators in uninfected GES-1 cells or cells infected with WT H. pylori TN2GF4 strains for 24 h. Dot size indicates the −log10 transformed P values, color coding based on normalized expression levels. (F and G) GES-1 cells were infected with H. pylori TN2GF4 or NCTC11637 strains (MOI 100) for 3 h and then exposed to gentamicin (100 µg/mL) for 24 h to eliminate the extracellular bacteria. The mRNA (F) and protein (G) expression of HSPA8, HSPA1A, and HSPA1B was determined in uninfected GES-1 cells or cells infected with H. pylori TN2GF4 or NCTC 11637 strains. β-Actin was used as the loading control. All the quantitative data were presented as means ± SD from three independent experiments. *P < 0.05 and ***P < 0.001.
Fig 4
Fig 4
H. pylori infection modulated mRNA splicing of functional genes that were involved in cell cycle process. (A–D) GES-1 cells were infected with WT H. pylori TN2GF4 strain (MOI 100) for 3 h and then exposed to gentamicin (100 µg/mL) for 24 h to eliminate the extracellular bacteria. (A) Pie charts showing the proportion of each type of significantly altered splicing events in H. pylori-infected GES-1 cells compared with the controls using the rMATS algorithm. (B) Percentage of H. pylori-promoted or repressed splicing events in GES-1 cells. (C) GO annotation of the top 10 enriched biological pathways using the functional genes affected by H. pylori-promoted splicing events. Colored squares represented the q value (black, small; yellow, big). (D) The protein-protein interaction network for functional genes involved in the cell cycle process based on the STRING database. (E and F) GES-1 cells were infected with H. pylori TN2GF4 or NCTC11637 strains (MOI 100) for 3 h and then exposed to gentamicin (100 µg/mL) for 24 h to eliminate the extracellular bacteria. (E) The protein levels of BRCA1, SUZ12, and FANCM were determined and quantified in uninfected GES-1 cells or cells infected with H. pylori TN2GF4 or NCTC 11637 strains for 24 h. GAPDH was used as the internal control. (F) The mRNA expression of BRCA1, SUZ12, and FANCM was determined in uninfected GES-1 cells or cells infected with H. pylori TN2GF4 or NCTC 11637 strains for 24 h. (G) Exon skipping in the seventh exon of BRCA1, the nineth exon of SUZ12, and the third exon of FANCM as visualized by the IGV software. Black arrowheads indicate splicing sites. (H) GES-1 cells were infected with H. pylori TN2GF4 or NCTC11637 strains (MOI 100) for 3 h and then exposed to gentamicin (100 µg/mL) for 24 h to eliminate the extracellular bacteria. RT-PCR analysis of alternative splicing patterns of the changed splicing genes in control and H. pylori-infected GES-1 cells. β-Actin was used as the internal control. The expression of full-length and exon-skipping isoforms of the three genes was quantified. All the quantitative data were presented as means ± SD from three independent experiments. *P < 0.05, **P < 0.01, and ***P < 0.001.
Fig 5
Fig 5
Gastric H. pylori colonization alleviated the severity of chronic DSS-induced colitis. (A and B) GES-1 cells were infected with WT H. pylori TN2GF4 strain (MOI 100) for 3 h and then exposed to gentamicin (100 µg/mL) for 12 or 24 h to eliminate the extracellular bacteria. (A) Venn diagram showing the number of GSEA-enriched biological pathways in H. pylori-infected GES-1 cells compared with mock infection after 12 or 24 h challenge, with six pathways including IBD pathway (red) being simultaneously enriched in both two timepoints. (B) GSEA enrichment plot showed that the “IBD” pathway was enriched in H. pylori-infected GES-1 cells for 24 h compared with mock infection. IBD pathway-related genes that were upregulated in response to H. pylori infection were labeled. (C and D) GES-1 (C) or NCM460 (D) cells were infected with H. pylori TN2GF4, NCTC 11637, or PMSS1 strains (MOI 100) for 24 h with or without gentamicin (100 µg/mL) treatment. The mRNA expression of IL6, IL12, IL23, and TNFA were determined. β-Actin was used as the loading control. The quantitative data were presented as means ± SD from three independent experiments. (E–J) C57BL/6J mice were orally inoculated with H. pylori PMSS1 strain (n = 8 animals) or the vehicle (n = 8 animals) for 1 month, followed by the administration of three cycles of 3% DSS (7 days/cycle), each separated by 7 days of regular water. (E) Schematic overview of the experimental design. (F) The changes of mice body weight after DSS administration were monitored. Mean ± SD from eight mice in each group. (G) (Left) Representative photographs of mouse colon tissue from each group were presented. Scale bar = 1 cm. (Right) The colon length of each mice was recorded. (H) The DAI index per mice was evaluated. (I) The histological analysis of mice colon tissue was performed by hematoxylin and eosin (H&E) and alcian blue staining. Scale bar = 100 µm. Histological scores of the DSS-induced colitis were evaluated. The quantitative data were presented as means ± SD. *P < 0.05, **P < 0.01, and ***P < 0.001.
Fig 6
Fig 6
H. pylori-sustained Muribaculaceae abundance contributed to the restoration of intestinal barrier function damaged by DSS treatment. (A–H) C57BL/6J mice were orally inoculated with H. pylori PMSS1 strain (n = 8 animals) or the vehicle (n = 8 animals) for 1 month, followed by the administration of three cycles of 3% DSS (7 days/cycle), each separated by 7 days of regular water. (A) PCA diagram showing the β-diversity of mice fecal microbiota among the three groups at the species level. (B) ANOSIM test was applied to compare microbial structure dissimilarity between and within groups. Two-sided Wilcoxon rank-sum test. (C) The α-diversity of intestinal microbiota in the three groups at the species level was evaluated by chao1 (left), Shannon (middle), and Simpson (right) indices. (D and E) Analysis of the differences in the mice intestinal microbiota at the phylum (D) or species (E) levels. Dot size indicates the −log10 transformed P values, color coding based on normalized expression levels. Two-sided Wilcoxon rank-sum test. (F) The concentrations of seven types of short-chain fatty acid (SCFA) in mice colon tissue from each group were determined by absolute quantitative metabolomics. (G) The fluorescence intensities of Claudin 1, Occludin, and ZO-1 in the mice colon were determined by immunofluorescence staining. Scale bar = 100 µm. (H) The protein levels of Claudin 1 and Occludin in the mice colon were determined and quantified by western blotting. GAPDH was used as the internal control. All the quantitative data were presented as means ± SD. *P < 0.05, **P < 0.01, and ***P < 0.001.

Similar articles

Cited by

References

    1. Malfertheiner P, Camargo MC, El-Omar E, Liou JM, Peek R, Schulz C, Smith SI, Suerbaum S. 2023. Helicobacter pylori infection. Nat Rev Dis Primers 9:19. doi:10.1038/s41572-023-00431-8 - DOI - PMC - PubMed
    1. Tacconelli E, Carrara E, Savoldi A, Harbarth S, Mendelson M, Monnet DL, Pulcini C, Kahlmeter G, Kluytmans J, Carmeli Y, Ouellette M, Outterson K, Patel J, Cavaleri M, Cox EM, Houchens CR, Grayson ML, Hansen P, Singh N, Theuretzbacher U, Magrini N, WHO Pathogens Priority List Working Group . 2018. Discovery, research, and development of new antibiotics: the WHO priority list of antibiotic-resistant bacteria and tuberculosis. Lancet Infect Dis 18:318–327. doi:10.1016/S1473-3099(17)30753-3 - DOI - PubMed
    1. Sugano K, Tack J, Kuipers EJ, Graham DY, El-Omar EM, Miura S, Haruma K, Asaka M, Uemura N, Malfertheiner P, Kyoto Global Consensus C. 2015. Kyoto global consensus report on Helicobacter pylori gastritis. Gut 64:1353–1367. doi:10.1136/gutjnl-2015-309252 - DOI - PMC - PubMed
    1. Correa P. 1988. A human model of gastric carcinogenesis. Cancer Res 48:3554–3560. - PubMed
    1. Hatakeyama M. 2014. Helicobacter pylori CagA and gastric cancer: a paradigm for hit-and-run carcinogenesis. Cell Host Microbe 15:306–316. doi:10.1016/j.chom.2014.02.008 - DOI - PubMed