. 2024 Mar 21;15(1):2551.
doi: 10.1038/s41467-024-46521-3.

The EIF3H-HAX1 axis increases RAF-MEK-ERK signaling activity to promote colorectal cancer progression

Affiliations

The EIF3H-HAX1 axis increases RAF-MEK-ERK signaling activity to promote colorectal cancer progression

Huilin Jin et al. Nat Commun. .

Abstract

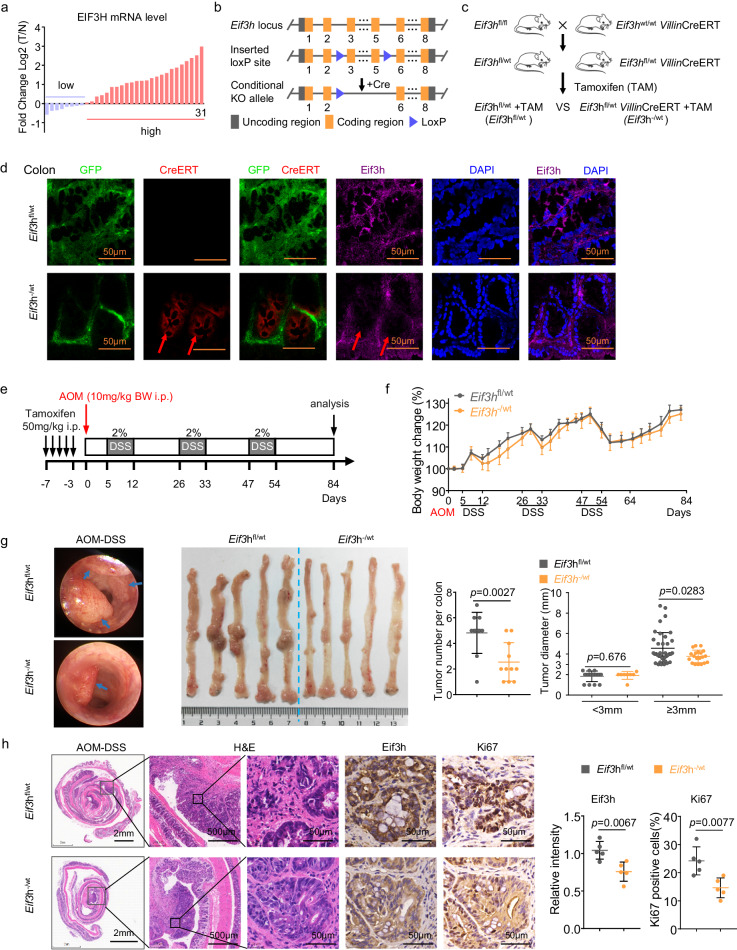
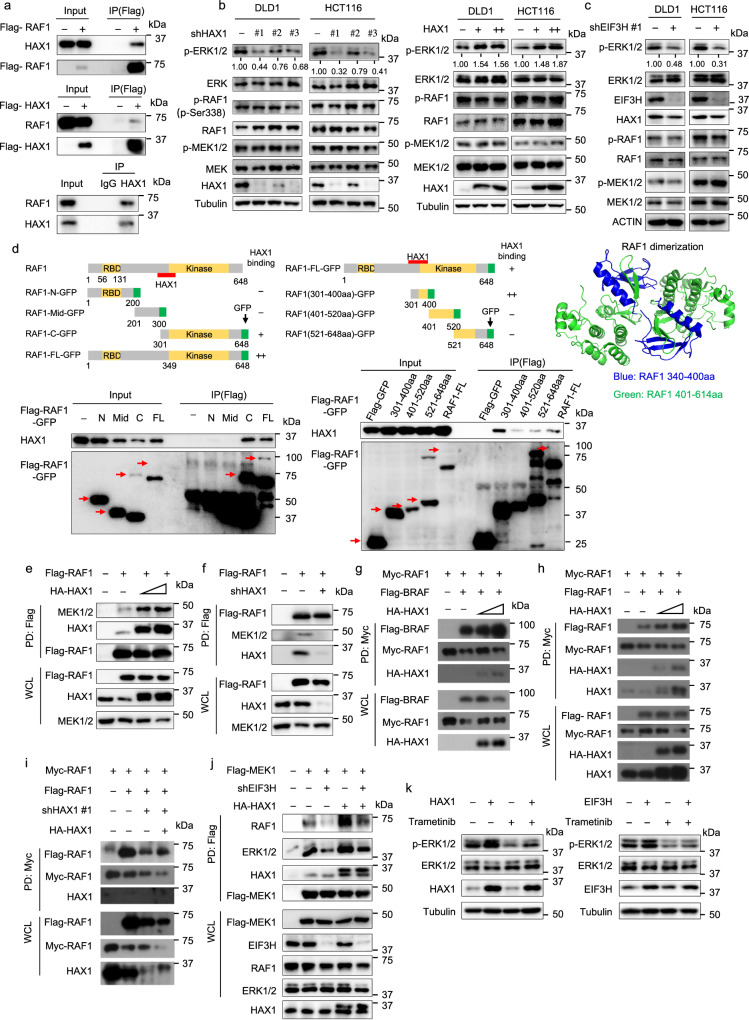
Eukaryotic initiation translation factor 3 subunit h (EIF3H) plays critical roles in regulating translational initiation and predicts poor cancer prognosis, but the mechanism underlying EIF3H tumorigenesis remains to be further elucidated. Here, we report that EIF3H is overexpressed in colorectal cancer (CRC) and correlates with poor prognosis. Conditional Eif3h deletion suppresses colorectal tumorigenesis in AOM/DSS model. Mechanistically, EIF3H functions as a deubiquitinase for HAX1 and stabilizes HAX1 via antagonizing βTrCP-mediated ubiquitination, which enhances the interaction between RAF1, MEK1 and ERK1, thereby potentiating phosphorylation of ERK1/2. In addition, activation of Wnt/β-catenin signaling induces EIF3H expression. EIF3H/HAX1 axis promotes CRC tumorigenesis and metastasis in mouse orthotopic cancer model. Significantly, combined targeting Wnt and RAF1-ERK1/2 signaling synergistically inhibits tumor growth in EIF3H-high patient-derived xenografts. These results uncover the important roles of EIF3H in mediating CRC progression through regulating HAX1 and RAF1-ERK1/2 signaling. EIF3H represents a promising therapeutic target and prognostic marker in CRC.


Conflict of interest statement

The authors declare no competing interests.

Figures

Fig. 1
Fig. 1. Villin–specific conditional Eif3h knockout attenuates colorectal tumorigenesis in AOM/DSS model.
a Waterfall plot of the relative EIF3H mRNA levels from 31 paired samples of CRC and adjacent non-tumorous colorectal tissues measured by qRT-PCR. b Schematic depiction of generating Eif3h conditional Eif3h knockout (KO) mouse model. Exons were indicated by filled orange blocks with numbers. Blue triangle, loxP site. Filled gray blocks, uncoding region. c Cartoon illustration of a cross between Eif3hflox/flox and Villin-CreERT to breed Eif3hflox/wt, Villin-CreERT mice. Tamoxifen was used to induce heterozygous conditional Eif3h KO. d Representative images of immunofluorescence staining (IF) of colon tissues obtained from the indicated tamoxifen-induced mice (n = 3). Nuclei stained with DAPI (blue). Scale bar = 50 µm. e A schematic overview of the AOM/DSS model. f The body weights of Eif3hflox/wt (n = 7) and Eif3h-/wt (n = 5) mice were measured during the procedures. Data were presented as means ± SEM. g Representative mini-endoscopy pictures (left), photographs (middle), tumor numbers and tumor size of tumor bearing colons from Eif3hflox/wt (n = 11) and Eif3h-/wt (n = 11) mice treated with AOM/DSS. Tumors were marked by a blue arrow (left). Data were presented as means ± SD. The p values were calculated by two-tailed t test. h Representative hematoxylin and eosin (H&E) and immunohistochemical (IHC) staining of colon tissues obtained from the indicated mice (n = 5 for each group) with AOM/DSS treatment. Quantification of IHC staining were shown as bar graph (right). Data were presented as means ± SD. The p values were calculated by two-tailed t test. Source data are provided as a Source Data file. wt, wild-type. AOM, azoxymethane. DSS, dextran sodium sulphate.
Fig. 2
Fig. 2. EIF3H knockdown decreases steady-state expression of HAX1 protein in CRC cells.
a Coomassie blue staining of the immunoprecipitated profile using anti-Flag M2 beads in HCT116 cells transfected with empty vector or Flag-tagged EIF3H. The purified EIF3H protein complex was subjected to mass spectrometry analysis. b The interaction between exogenous and endogenous EIF3H and HAX1 was determined by co-IP assay. HEK293T cells were transfected with Flag-EIF3H or Flag-HAX1 plasmid. The cell lysates were pulled down with anti-Flag M2 beads and immunoblotted with the indicated antibodies. HCT116 cell lysates were immunoprecipitated with either control rabbit IgG, EIF3H, or HAX1 antibodies followed by immunoblotting. c Proximity ligation assay. A representative image series was shown. Red spots mark positive PLA signals for EIF3H-HAX1 interactions. Nuclei were stained with DAPI. Scale bar = 50 µm. d Immunoblot analysis of HAX1 expression in shCtrl and shEIF3H DLD1 and HCT116 cells. e shCtrl and shEIF3H CRC cells were treated with or without 25 μM MG132 for 6 h. Cell lysates were immunoblotted. f HEK293T cells transfected with the indicated plasmids were treated with cycloheximide (CHX) (100 μg/mL) for indicated time. Cell lysates were immunoblotted. HAX1 levels were quantified, normalized, and the turnover of HAX1 is indicated graphically in the right panel. g shCtrl and shEIF3H DLD1 and HCT116 cells were treated with CHX. HAX1 turnover rate was analyzed by immunoblotting (left) and quantified (right). h HEK293T cells were transfected with the indicated plasmids and treated with MG132. The cell lysates were pulled down with Ni-NTA beads and immunoblotted. i Cellular extracts from shCtrl and shEIF3H HCT116 cells were concentrated and fractionated on Superose 6 size exclusion columns. An equal volume from each chromatographic fraction was analyzed by western-blot. Chromatographic eluate profiles and molecular size of eluted fraction were indicated. j shEIF3H HCT116 cells were infected with lentivirus containing control vector or Flag-HAX1 vector. The indicated protein levels, cell proliferation, colony formation, migration, and invasion were indicated. The data are presented as the means ± SD. The p values were obtained by two-tailed unpaired t test. All data shown (including immunoblotting, immunofluorescent staining) were obtained from at least three biological independent experiments with similar results. Source data are provided as a Source Data file.
Fig. 3
Fig. 3. E3 ubiquitin ligase βTrCP promotes HAX1 ubiquitination through binding phosphodegron of HAX1.
a 293 T cells were transfected with Flag-tagged HAX1 or Flag-tagged βTrCP. Cell lysates were pulled down with anti-Flag M2 beads and immunoblotted. b HCT116 cell lysates were pulled down with an anti-HAX1 or anti-βTrCP antibody and immunoblotted with βTrCP or HAX1. c Representative immunoblots showing HAX1 steady-state expression in 293 T and HCT116 cells upon βTrCP overexpression. d HCT116 cells transfected with either Flag-βTrCP or vector were treated with or without MG132. Lysates were immunoblotted with indicated antibodies. e HCT116 cells transfected with either WT Flag-βTrCP or Flag-△F-box-βTrCP were treated with CHX for the indicated times. The cell lysates were immunoblotted (left). The turnover rate of HAX1 was shown (right). f Representative immunoblots showing HAX1 steady-state expression in HCT116 cells upon △F-box-βTrCP overexpression. g 293T cells were cotransfected with Flag-HAX1 with or without Myc-βTrCP plus His-ubiquitin wild type (WT), K48R mutant or K63R mutant. Cells were treated with MG132 for 6 h before harvesting. The ubiquitinated HAX1 proteins were pulled down by Ni-NTA-agarose beads and detected with anti-Flag antibody. h Sequence alignment of the putative βTrCP-recognized degron on HAX1. 293 T cells were transfected with WT or mutant Flag-tagged HAX1 (2AA, 2DD). Location of S231 and T235 of HAX1 is indicated. The cell lysates were pulled down with anti-Flag M2 beads and immunoblotted. i Representative immunoblots showing the turnover rate of HA-tagged WT or dot mutant HAX1, with or without Myc-βTrCP overexpression in HCT116 cells (left). Quantification of HAX1 turnover rate by the Image J software (right). j, k 293 T cells were cotransfected with the indicated plasmids. Cells were treated with MG132 for 6 h before harvesting. The ubiquitinated HAX1 proteins were pulled down by Ni-NTA beads and detected with anti-Flag antibody. Representative immunoblots shown in figures were repeated three times independently with similar results. Source data are provided as a Source Data file.
Fig. 4
Fig. 4. HAX1 enhances the interaction between RAF1, MEK1, and ERK1, thereby potentiating phosphorylation/activation of ERK1/2.
a The interaction between HAX1 and RAF1 was determined by endogenous and semi-exogenous co-IP assay. (Top and middle) HEK293T cells were transfected with Flag-HAX1 or Flag-RAF1. The cell lysates were pulled down with anti-Flag M2 beads and immunoblotted with the indicated antibodies. (Bottom) HCT116 cell lysates were pulled down with an anti-HAX1 antibody and immunoblotted with RAF1. b Effect of HAX1 knockdown and overexpression on the phosphorylation of ERK in DLD1 and HCT116 cells was detected by western blotting. c Effect of EIF3H knockdown on the phosphorylation of ERK in DLD1 and HCT116 cells was detected by western blotting. d Full length and truncated mutant Flag-RAF1-GFP plasmids were transfected into 293T cells. Cell lysates were immunoprecipitated with anti-Flag M2 beads and immunoblotted with indicated antibodies for binding studies. RAF1 dimerization domain in RAF1 structure was indicated (340–400aa). e The HEK293T cells were transfected with Flag-RAF1 with increasing HA-HAX1 plasmids. Cell lysates were immunoprecipitated with anti-Flag M2 beads and immunoblotted with indicated antibodies. WCL, whole cell lysis. f The shCtrl and shHAX1 HCT116 cells were transfected with Flag-RAF1 plasmids. Cell lysates were immunoprecipitated with anti-Flag M2 beads and immunoblotted with indicated antibodies. g, h The HEK293T cells were transfected with Myc-RAF1, Flag-BRAF g or Flag-RAF1 h with increasing HA-HAX1 plasmids. Cell lysates were immunoprecipitated with anti-Myc beads and immunoblotted with indicated antibodies. i The shCtrl and shHAX1 HCT116 cells were transfected with Myc-RAF1, Flag-RAF1 with or without HA-HAX1 plasmids. Cell lysates were immunoprecipitated with anti-Myc beads and immunoblotted with indicated antibodies. j The shCtrl and shEIF3H HCT116 cells were transfected with Flag-RAF1 or HA-HAX1 plasmids. Cell lysates were immunoprecipitated with anti-Flag M2 beads and immunoblotted with indicated antibodies. k The overexpression of HAX1 or EIF3H HCT116 cells were treated with or without Trametinib. Western blot analysis of indicated proteins were performed. Representative immunoblots shown in figures were repeated three times independently with similar results. Source data are provided as a Source Data file.
Fig. 5
Fig. 5. EIF3H promotes CRC tumorigenesis/metastasis via HAX1 in an orthotopic CRC model.
a Schematic diagram of orthotopic xenograft CRC model (right). The HCT116 cells were orthotopically inoculated into the cecum of mice (n = 5 for each group). At day 2 and 23 after inoculation, the bioluminescent images were captured and quantified. Representative bioluminescence images of colorectal orthotopic inoculation mice, isolated intestines and livers (left). b Data of orthotopic CRC model (n = 5 for each group) were presented as mean ± SD. The p values were obtained by one-way ANOVA. c Representative images of H&E staining on liver and lung tissue sections (left) and quantification of metastatic tumor areas (right) (n = 5 for each group). The dark blue circles indicated the tumor borders; data were presented as means ± SD. The p values were calculated by one-way ANOVA. d Representative images of H&E staining and IHC staining for EIF3H, HAX1, Ki67, and pERK1/2 on orthotopic CRC sections (n = 5). The dark blue dashed lines indicated the tumor borders. Quantifications of IHC staining were shown as bar graphs. Data were presented as means ± SD. The p values were calculated by one-way ANOVA. e Representative images of immunofluorescence staining for EIF3H and HAX1 in primary CRC tumor, adjacent normal, and liver metastasis tissue obtained from the same CRC patient (left). Green, EIF3H; red, HAX1; blue, DAPI. The staining intensity of EIF3H and HAX1 was quantitated by ImageJ and presented as bar graphs (right) (n = 3). Data were presented as means ± SD. The p values were calculated by one-way ANOVA. Source data are provided as a Source Data file.
Fig. 6
Fig. 6. Activation of Wnt/β-catenin signaling induces EIF3H expression.
a qRT-PCR analysis of EIF3H mRNA in DLD1 and HCT116 cells treated with L-Wnt3a-expressing cell conditioned medium. Data are presented as the means ± SD, n  =  3 biologically independent experiments. b qRT-PCR and western-blot analysis of EIF3H and AXIN2 levels in DLD1 and HCT16 cells treated with different concentrations of Wnt pathway inhibitor ICG-001. Data are presented as the means ± SD, n  =  3 biologically independent experiments. c qRT-PCR and western-blot analysis of EIF3H and AXIN2 levels in DLD1, HCT16, and RKO cells treated with different concentrations of Wnt pathway inhibitor NCB0846. Data are presented as the means ± SD, n  =  3 biologically independent experiments. d, e qRT-PCR d and western-blot e analysis of EIF3H and c-Myc level in DLD1 and HCT116 cells cultured with L-Wnt3a-expressing cell CM, in the presence or absence of Wnt pathway inhibitor NCB0846 (10 µM). Data are presented as the means ± SD, n  =  3 biologically independent experiments. f The potential binding sequence of TCF4 obtained from JASPAR website. g Deletion mutants of the EIF3H promoter (middle); HCT116 cells were subjected to chromatin immunoprecipitation using antibodies against IgG, TCF4, or β-catenin, followed by qRT-PCR for the loci on EIF3H promoter (right). NLIF3 was a positive control. Data are presented as the means ± SD, n  =  3 biologically independent experiments. h, i CRC line DLD1, HCT116 and RKO cells were transfected with Flag-TCF4 or Flag-β-catenin plasmids. qRT-PCR and western-blot analysis of EIF3H level. Data are presented as the means ± SD, n  =  3 biologically independent experiments. j DLD1 and HCT116 cells were treated with different concentrations of Wnt pathway inhibitor LGK974 plus MEK1/2 inhibitor trametinib. The colony formation assay was performed. The p values were determined by unpaired two-tailed t test for ad, g, h. Representative immunoblots shown in the figures were repeated three times independently with similar results. Source data are provided as a Source Data file.
Fig. 7
Fig. 7. Combined Wnt and RAF1-ERK1/2 signaling inhibitors treatment suppresses tumor growth in EIF3H-high PDX with better efficacy.
a Representative IHC staining images showing high and low expression of EIF3H in human CRC and adjacent non-tumor tissue from tissue microarray (TMA) (left). EIF3H protein levels in 76 paired human CRC and the non-tumor tissues. Data were presented as means ± SD. The p value was based on the two-sided Wilcoxon test (middle). The correlation between EIF3H protein level and the overall survival of CRC patients (n = 104) was tested by Kaplan-Meier analysis (right). The p was based on the log-rank test. b Immunoblot images showing EIF3H expression in seven cases of PDX tumors. c Schematic diagram of the LGK974 and Trametinib combination treatment after the establishment of PDX tumors in NCG mice. d Representative images (top) and weight (middle) of the PDX tumors that were harvested at the end of the experiment. Growth curves showing the proliferation of PDX tumors in each indicated treatment group (bottom). n = 5 biological replicates. Data were presented as means ± SD. The p values were calculated by two-way ANOVA. e Immunoblot images showing the indicated protein levels analyzed from the PDX tumors that were treated with LGK974 and Trametinib. f Representative images (top) and quantifications (bottom) of IHC staining for Ki67 in PDX tumors from the indicated treatment groups. Data were presented as means ± SD, n  =  3 biologically independent experiments. The p values were calculated by one-way ANOVA. g Graphical summary of the key findings of the study. Representative immunoblots shown in figures were repeated three times independently with similar results. Source data are provided as a Source Data file. PDX patient-derived xenografts.

References

    1. Siegel RL, Miller KD, Fuchs HE, Jemal A. Cancer statistics, 2022. CA Cancer J. Clin. 2022;72:7–33. doi: 10.3322/caac.21708. - DOI - PubMed
    1. Dekker E, Tanis PJ, Vleugels JLA, Kasi PM, Wallace MB. Colorectal cancer. Lancet. 2019;394:1467–1480. doi: 10.1016/S0140-6736(19)32319-0. - DOI - PubMed
    1. Lee MH. Harness the functions of gut microbiome in tumorigenesis for cancer treatment. Cancer Commun. (Lond.) 2021;41:937–967. doi: 10.1002/cac2.12200. - DOI - PMC - PubMed
    1. Zou S, Fang L, Lee MH. Dysbiosis of gut microbiota in promoting the development of colorectal cancer. Gastroenterol. Rep. 2018;6:1–12. doi: 10.1093/gastro/gox031. - DOI - PMC - PubMed
    1. Xu H, Luo H, Zhang J, Li K, Lee MH. Therapeutic potential of Clostridium butyricum anticancer effects in colorectal cancer. Gut Microbes. 2023;15:2186114. doi: 10.1080/19490976.2023.2186114. - DOI - PMC - PubMed

MeSH terms

Substances