. 2024 Mar 21;15(1):2533.
doi: 10.1038/s41467-024-46813-8.

The binding and mechanism of a positive allosteric modulator of Kv3 channels

Affiliations

The binding and mechanism of a positive allosteric modulator of Kv3 channels

Qiansheng Liang et al. Nat Commun. .

Abstract

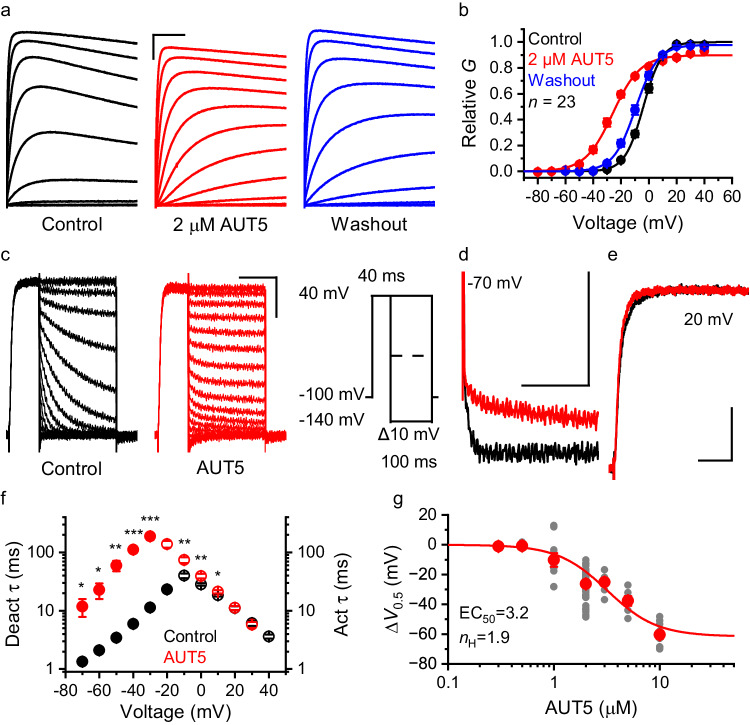
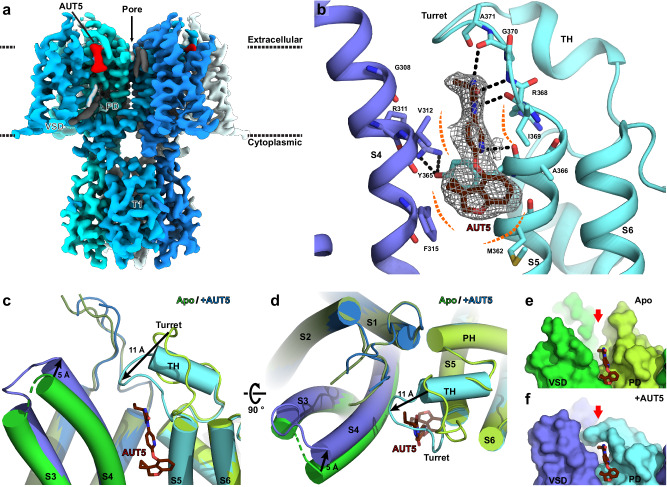
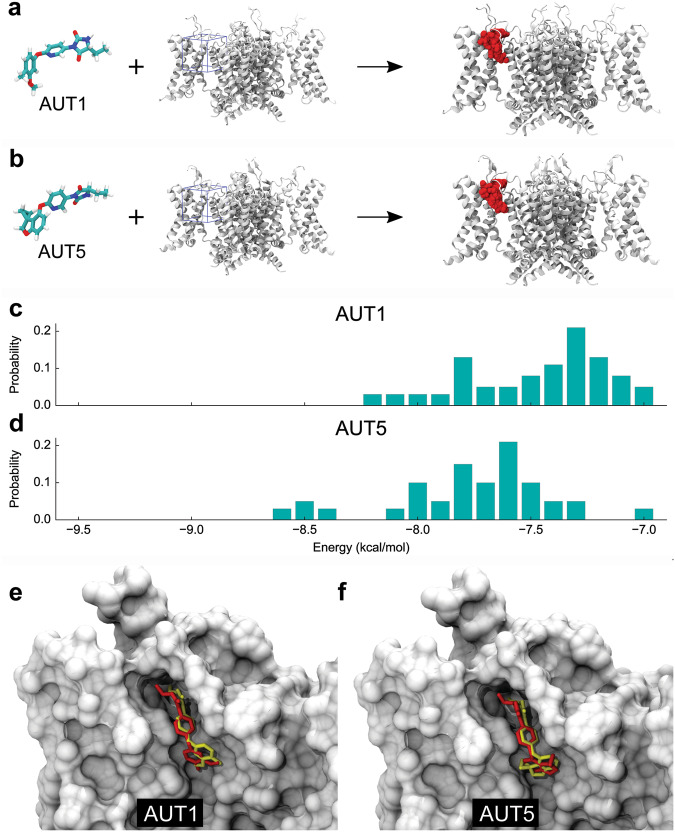
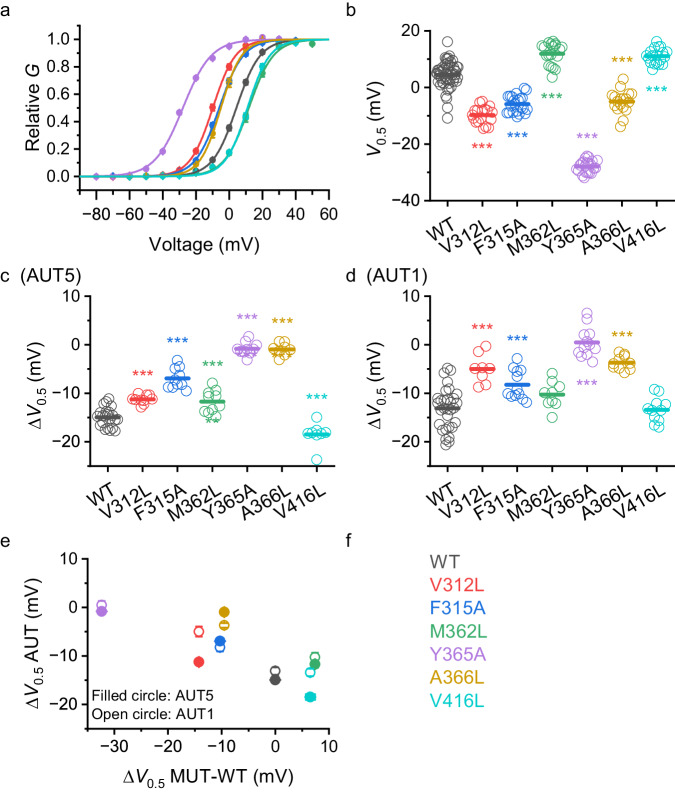
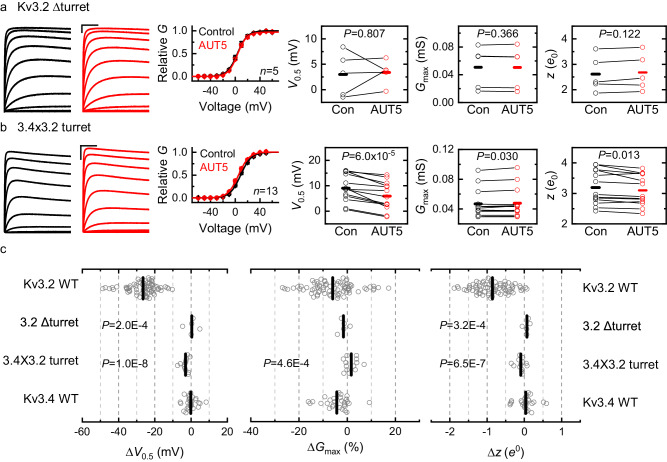
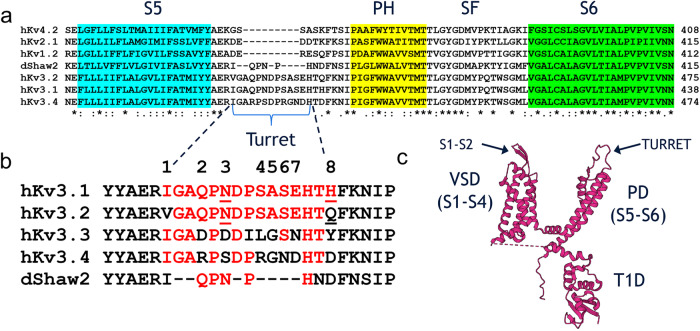
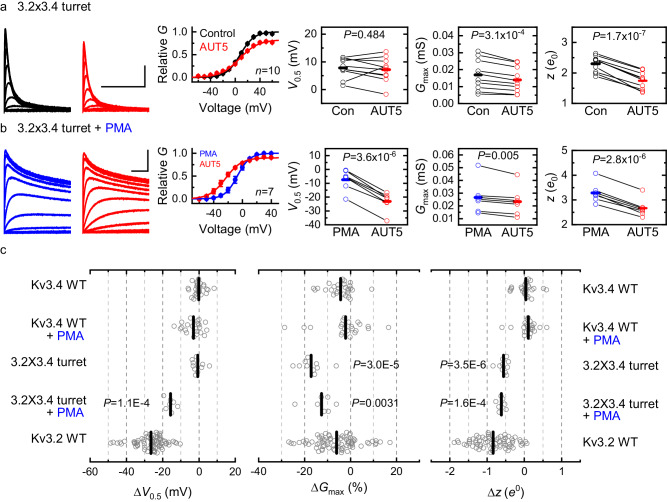
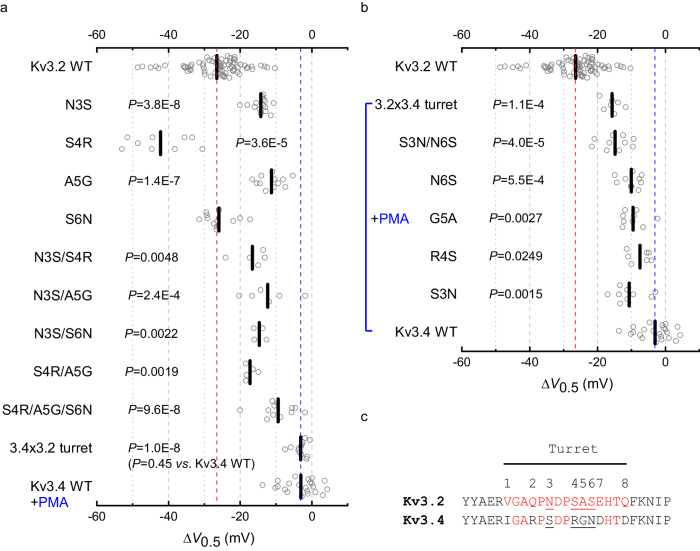
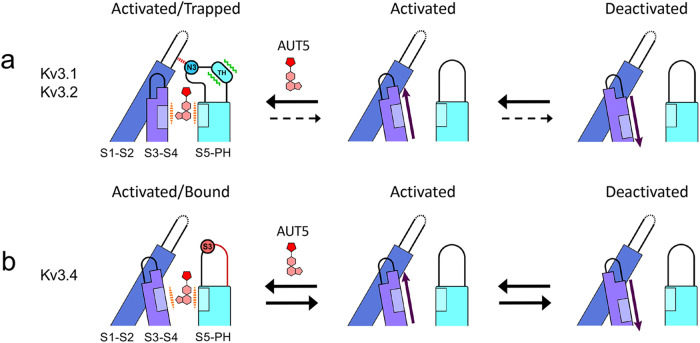
Small-molecule modulators of diverse voltage-gated K+ (Kv) channels may help treat a wide range of neurological disorders. However, developing effective modulators requires understanding of their mechanism of action. We apply an orthogonal approach to elucidate the mechanism of action of an imidazolidinedione derivative (AUT5), a highly selective positive allosteric modulator of Kv3.1 and Kv3.2 channels. AUT5 modulation involves positive cooperativity and preferential stabilization of the open state. The cryo-EM structure of the Kv3.1/AUT5 complex at a resolution of 2.5 Å reveals four equivalent AUT5 binding sites at the extracellular inter-subunit interface between the voltage-sensing and pore domains of the channel's tetrameric assembly. Furthermore, we show that the unique extracellular turret regions of Kv3.1 and Kv3.2 essentially govern the selective positive modulation by AUT5. High-resolution apo and bound structures of Kv3.1 demonstrate how AUT5 binding promotes turret rearrangements and interactions with the voltage-sensing domain to favor the open conformation.


Conflict of interest statement

A.M., N.P., G.A., M.J.G. and C.H.L. are employees and shareholders of Autifony Therapeutics, Ltd. Q.L., L.Z. and M.C. received funding from Autifony Therapeutics, Ltd. to conduct this work. The remaining authors declare no competing interests.

Figures

Fig. 1
Fig. 1. AUT5 is a positive allosteric modulator of Kv3.2.
a Families of whole-oocyte currents evoked by step depolarizations (protocol on Fig. S1d) before and after application to 2 μM AUT5 and following washout. Scale bars represent 1 μA and 100 ms. b Aggregate Gp – Vc curves. The solid lines are the best fits of the 1st-order Boltzmann equation (Methods). SEM bars are obscured by the symbols. The curves are normalized relative to the control in the absence of compound. n = 23 oocytes. The best-fit parameters are in Table S6. c Families of tail currents before (black) and after (red) bath application of 2 µM AUT5. Currents were evoked by the pulse protocol shown on this panel. To accurately measure slow time constants in the presence of AUT5, the tail current portion of the protocol was 1000 ms. d Overlay of tail currents at −70 mV in the absence (black) and presence (red) of 2 μM AUT5. e Overlay of currents evoked by a step depolarization from −100 to +20 mV the absence (black) and presence (red) of 2 μM AUT5. Scale bars (ce) represent 0.5 μA and 50 ms. f Voltage dependence of the time constants of current deactivation (filled symbols) and current activation (hollow symbols) before (black) and after (red) bath application of 2 μM AUT5 (n = 9 oocytes). At some voltages, SEM bars are obscured by the symbols. Asterisks in (f) indicate P < 0.05 (*), P < 0.01 (**) and P < 0.001 (***). P = 0.029, 0.015, 0.002, 7.0E-5, 1.4E-4 (−70 to −30 mV), and 0.002, 0.002, 0.027 (−10 to 10 mV) (two-sided paired Student t-test before and after bath application of AUT5). g The effect of AUT5 concentration on the ΔV0.5. Symbols and bars represent means ± SEM. Each filled gray symbol represents a measurement from an individual oocyte. Number of oocytes: 4 (0.3 μM), 5 (0.5 μM), 10 (1 μM), 74 (2 μM), 9 (3 μM), 13 (5 μM), and 25 (10 μM). The solid line is the best fit of the logistic equation with the parameters shown on the graph (Methods).
Fig. 2
Fig. 2. High-resolution cryo-EM structure reveals the AUT5 binding site in Kv3.1.
a Overall cryo-EM reconstruction of Kv3.1/AUT5 complex. EM map feature for AUT5 is highlighted in red. b Cartoon representation of AUT5-binding site. Key residues for interaction with AUT5 (dark red) are highlighted as stick representations. Hydrogen bonds and van der Waals contacts are shown as black and orange dashed lines, respectively. The black dashed lines indicate potential polar interactions within a distance ≤3.2 Å. c, d Cartoon representations of conformational change of AUT5-binding site upon compound binding. Compared to Kv3.1 in apo state (green, PDB ID: 7PHI), Kv3.1 in AUT5-bound state (blue/cyan) have S3–S4 loop (blue) and Turret (cyan) shifted towards AUT5 by 5 Å and 11 Å, respectively. The C-terminal half of turret organizes into a two-turn alpha helix-like structure (TH). e, f Surface representations of AUT5-binding site of Kv3.1 in apo state (e) and AUT5-bound state (f). AUT5-binding pocket (red arrow) is open toward extracellular side in apo state, but it is closed by the turret in the modulator-bound state.
Fig. 3
Fig. 3. Comparative analysis of AUT1 and AUT5 docking solutions.
a, b Molecular structures of AUT1 and AUT5, Kv3.1 (white) and docking solutions (red) across the search grid volume (blue). c, d Distribution of binding energy values in docking. Each distribution contains 38 independent solutions. e, f Shown are docking solutions (red) that best reproduce the cryo-EM determined configurations (yellow) of AUT1 and AUT5, with structural superposition of 2.33 and 2.60 Å RMSD and interactions energies of −7.5 and −7.4 kcal/mol, respectively. The negative shift between energy distributions in (c, d) suggests that the overall set of bound configurations of AUT5 is modestly more stable than that of AUT1.
Fig. 4
Fig. 4. Kv3.1 mutations in the binding site for AUT5 and AUT1 alter voltage dependence and modulation by the compounds.
a Gp – Vc relations of Kv3.1 wild-type (WT) and the Kv3.1 mutants listed, and color-coded on panel f. In most cases, the SEM bars are obscured by the symbols. The solid lines are the best fit of the Boltzmann function (Methods). Scatter plots comparing the V0.5 values of Kv3.1 wild-type and the indicated mutants (b) alone, (c) with AUT5, and (d) with AUT1. V0.5 is derived from the best-fit Boltzmann function. c, d Scatter plots comparing the ΔV0.5 induced by AUT5 and AUT1, respectively. One-way ANOVA was used to evaluate changes relative to WT. *** <0.001. e Correlation plot of the mean ΔV0.5 induced by AUT5 or AUT1 vs. the mean ΔV0.5 caused by the mutations from panels (bd). The SEM bars are in most cases smaller than the symbols. f Color coded names of the Kv3.1 mutations characterized on this figure. Number of oocytes tested with AUT5 (c, e): 22 (WT), 10 (V312L), 10 (F315A), 10 (M362L), 10 (Y365A), 8 (A366L), and 8 (V416L). Number of oocytes tested with AUT1 (d, e): 31 (WT), 8 (V312L), 12 (F315A), 9 (M362L), 12 (Y365A), 10 (A366L), and 11 (V416L). a and b are the summary of the above experiments before AUT5 or AUT1 was applied. b P = 4.7E-19 (V312L), 9.4E-15(F315A), 2.4E-8(M362L), 3.0E-44(Y365A), 3.9E-11(A366L), 1.5E-7(V416L). c P = 3.0E-6(V312L), 1.5E-11(F315A), 2.6E-4(M362L), 2.2E-19(Y365A), 1.8E-17(A366L), 3.1E-4(V416L). d P = 1.1E-5(V312L), 7.7E-4(F315A), 1.2E-12(Y365A), 3.8E-8(A366L).
Fig. 5
Fig. 5. The turret region is necessary for the positive modulation of Kv3.2 by AUT5.
a, b Representative families of Kv3.2ΔTurret and 3.4 × 3.2 Turret currents (left) before (black) and after (red) bath application of 2 μM AUT5, and the aggregate of Gp-Vc curves with their corresponding analysis of V0.5, Gmax and z (right). SEM bars are obscured by the symbols. The Gp-Vc curves are normalized relative to the control in the absence of a compound. Representative currents were evoked by the voltage protocol shown on Fig. S1d and described in the corresponding legend, and the solid lines across the symbols of the Gp-Vc curves are the best fit to the 1st-order Boltzmann equation (Methods). Scale bars represent 1 μA and 100 ms. c Aggregate scatter graphs of the AUT5-induced changes in V0.5, Gmax and z from individual oocytes. Short vertical bars indicate the mean values. The sample sizes of the wild-type groups are as indicated in Fig. S1. For each mutant, the indicated P values evaluate differences relative to wild-type Kv3.2 (Kruskal-Wallis test). The results from Kv3.2ΔTurret relative to wild-type Kv3.4 are indistinguishable. Each symbol represents a measurement from a single oocyte. Number of oocytes: 5 (ΔTurret), 13 (3.4 × 3.2 Turret), 74 (Kv3.2 WT), and 28 (Kv3.4 WT).
Fig. 6
Fig. 6. Kv3 channels with differential AUT sensitivity have distinct turret sequences.
a Sequence alignment comparing transmembrane segment S5, turret loop, pore helix (PH), selectivity filter (SF) and transmembrane segment S6 from homologous Kv channels. Note that the turrets of hKv4.2, hKv2.1, hKv1.2 and dShaw2 are shorter compared to those of hKv3.1, hKv3.2 and hKv3.4. b Detailed comparison of amino acid sequences in the turrets of Kv3 channels (dShaw is a Drosophila homolog). Note that, except for the flanking residues at the numbered positions 1 and 8, Kv3.1 and Kv3.2 have identical turret regions. c Topology of a single Kv3.1 subunit depicting the major domains: cytoplasmic T1 domain (T1D), voltage-sensing domain (VSD = S1–S4) and pore domain (PD = S5–S6). Arrows indicate the extracellular S1–S2 loop and turret region.
Fig. 7
Fig. 7. The Kv3.2 turret region confers positive modulation by AUT5 in Kv3.4 upon elimination of fast inactivation.
a, b Representative families of 3.2 × 3.4Turret currents (control and post-PMA, left, top and bottom, respectively) before (black) and after (red) bath application of 2 μM AUT5 and the aggregate of Gp-Vc curves with their corresponding analysis of V0.5, Gmax and z (right). SEM bars are obscured by the symbols. The Gp-Vc curves are normalized relative to the control in the absence of a compound. Representative currents were evoked by the voltage protocol shown in Fig. S1d, and the solid lines across the symbols of the Gp-Vc curves are the best fits of the 1st-order Boltzmann equation (“Methods”). Blue traces and symbols are from oocytes exposed to 50 nM PMA before applying AUT5. PMA remained in the chamber until the end of the experiment. c Aggregate scatter graphs of the AUT5-induced changes in V0.5, Gmax and z from individual oocytes. Short vertical bars indicate the mean values. The Kv3.2 WT results are replotted here as a reference. The sample sizes of the wild-type groups are as indicated in Fig. S1. For each mutant, the indicated P values evaluate differences relative to wild-type Kv3.4 either in the presence or absence of PMA (Kruskal-Wallis test). Each symbol represents a measurement from a single oocyte. Number of oocytes: 7 (3.2 × 3.4 Turret), 10 (3.2 × 3.4 Turret + PMA), 28 (Kv3.4 WT), 22 (Kv3.4 WT + PMA), and 74 (Kv3.2 WT).
Fig. 8
Fig. 8. Discrete turret mutations can eliminate or confer positive modulation by AUT5 in Kv3.2 and Kv3.4, respectively.
a, b Scatter plot of V0.5 changes induced by 2 μM AUT5. The red and blue dashed lines are shown as the reference values of the V0.5 of Kv3.2 WT and Kv3.4 WT, respectively. The location of the mutations is according to the key shown in (c), Fig. 6 and Table S2, which indicate eight turret differences between Kv3.2 and Kv3.4. Modulation of Kv3.4 WT and Kv3.4 mutants by 2 μM AUT5 was tested in the presence of 50 nM PMA (blue bracket) to eliminate fast inactivation as shown in Fig. 7. Short vertical bars indicate the mean values. The indicated P values evaluate differences relative to wild-type Kv3.2 in (a) and wild-type Kv3.4 in the presence of PMA in (b) (Kruskal-Wallis test). The sample sizes (number of oocytes) in (a) are: N3S, n = 15; S4R, n = 9; A5G, n = 12; S6N, n = 12; N3S/A5G, n = 6; N3S/S4R, n = 5; N3S/S6N, n = 4; S4R/A5G, n = 5; S4R/A5G/S6N, n = 12. The sample sizes (number of oocytes) in (b) are: S3N, n = 9; R4S, n = 7; G5A, n = 9; N6S, n = 10; S3N/N6S, n = 10. Each symbol represents a measurement from a single oocyte. c Sequence alignment comparing turret loop of Kv3.2 and Kv3.4.
Fig. 9
Fig. 9. The extracellular turret region of Kv3 channels governs the sensitivity to modulation by AUT5 and the mechanism of action.
For simplicity, this schematic only represents deactivation interactions that may take place between two neighboring subunits of the tetrameric domain-swapped Kv3 channel assembly. Our data suggest that positive modulation results from positive cooperativity involving four equivalent sites. a The deactivation pathway of Kv3.1 or Kv3.2 in the presence of AUT5. Upon binding of AUT5 in the conserved pocket, the turrets of Kv3.1 and Kv3.2 undergo a partial conversion to an alpha helix-like structure and fold over the bound AUT5 to trap it in the pocket. Consequently, the turret establishes new interactions with the S1–S2 and the S3–S4 loop to immobilize the S4 voltage sensor in its activated-UP conformation causing a slowing of deactivation and, therefore, the channel’s open state is preferentially stabilized. N3 represents the turret asparagine that is within atomic distance from the S1-S2 loop in the bound conformation of Kv3.1. b The deactivation pathway of Kv3.4 in the presence of AUT5. Since the binding site determinants are conserved in all Kv3 channels, AUT5 may occupy its pocket in Kv3.4. However, this binding results in no positive modulation because the Kv3.4 turret cannot undergo the critical rearrangements of its secondary and tertiary structure to stabilize the activated conformation of the VSD. Therefore, deactivation does not change in the presence of AUT5. S3 represents the Kv3.4 turret serine that occupies the equivalent N3 position in Kv3.1 and Kv3.2.

Similar articles

Cited by

References

    1. Hille, B. Ionic channels of excitable membranes. 2nd ed. (Sinauer Associates, 2001).
    1. Jan LY, Jan YN. Voltage-gated potassium channels and the diversity of electrical signalling. J. Physiol. 2012;590:2591–2599. doi: 10.1113/jphysiol.2011.224212. - DOI - PMC - PubMed
    1. Gutman GA, et al. International union of pharmacology. LIII. Nomenclature and molecular relationships of voltage-gated potassium channels. Pharm. Rev. 2005;57:473–508. doi: 10.1124/pr.57.4.10. - DOI - PubMed
    1. Trimmer JS. Subcellular localization of K+ channels in mammalian brain neurons: remarkable precision in the midst of extraordinary complexity. Neuron. 2015;85:238–256. doi: 10.1016/j.neuron.2014.12.042. - DOI - PMC - PubMed
    1. Ranjan R, et al. A kinetic map of the homomeric voltage-gated potassium channel (Kv) family. Front. Cell Neurosci. 2019;13:358. doi: 10.3389/fncel.2019.00358. - DOI - PMC - PubMed

MeSH terms

Substances