. 2024 Mar 21;15(1):2516.
doi: 10.1038/s41467-024-46937-x.

Mutational scanning pinpoints distinct binding sites of key ATGL regulators in lipolysis

Affiliations

Mutational scanning pinpoints distinct binding sites of key ATGL regulators in lipolysis

Johanna M Kohlmayr et al. Nat Commun. .

Abstract

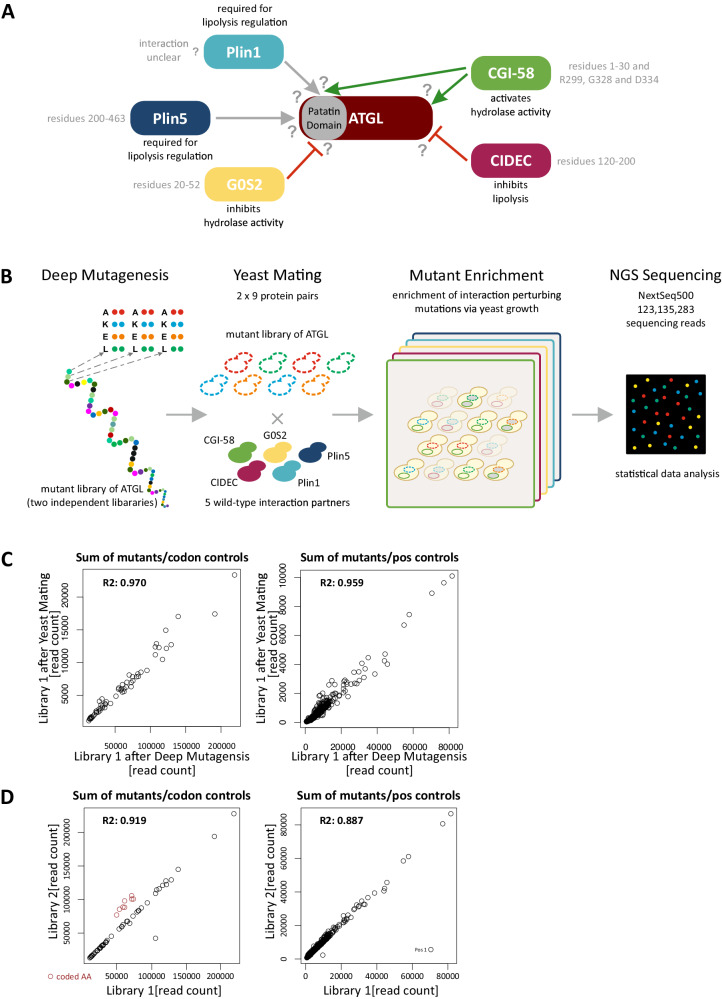
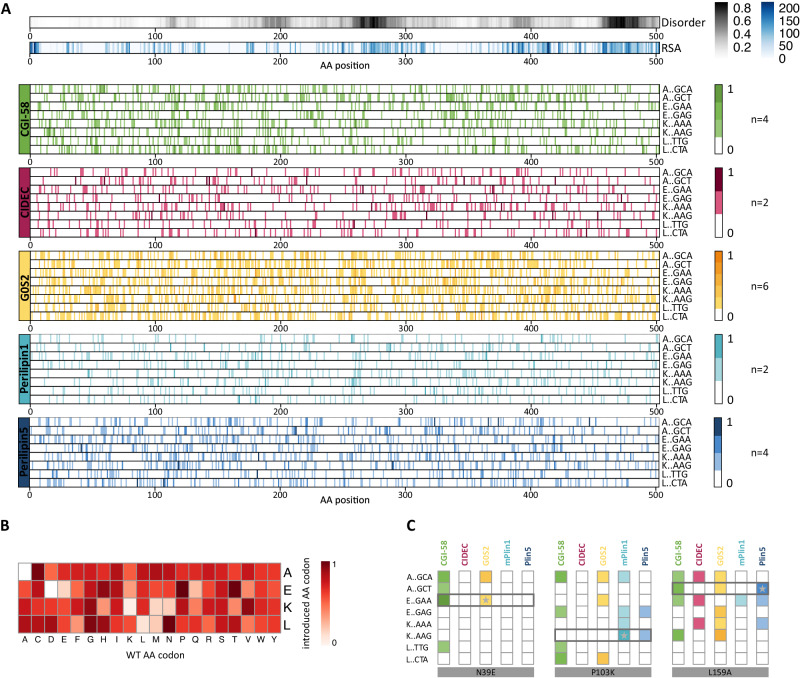
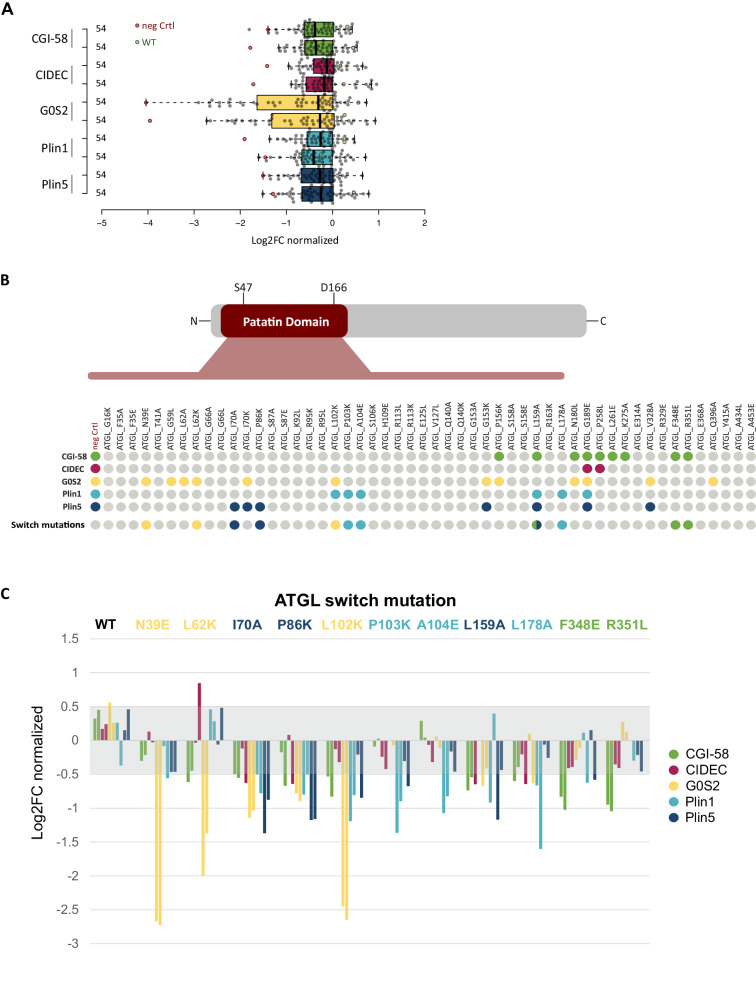
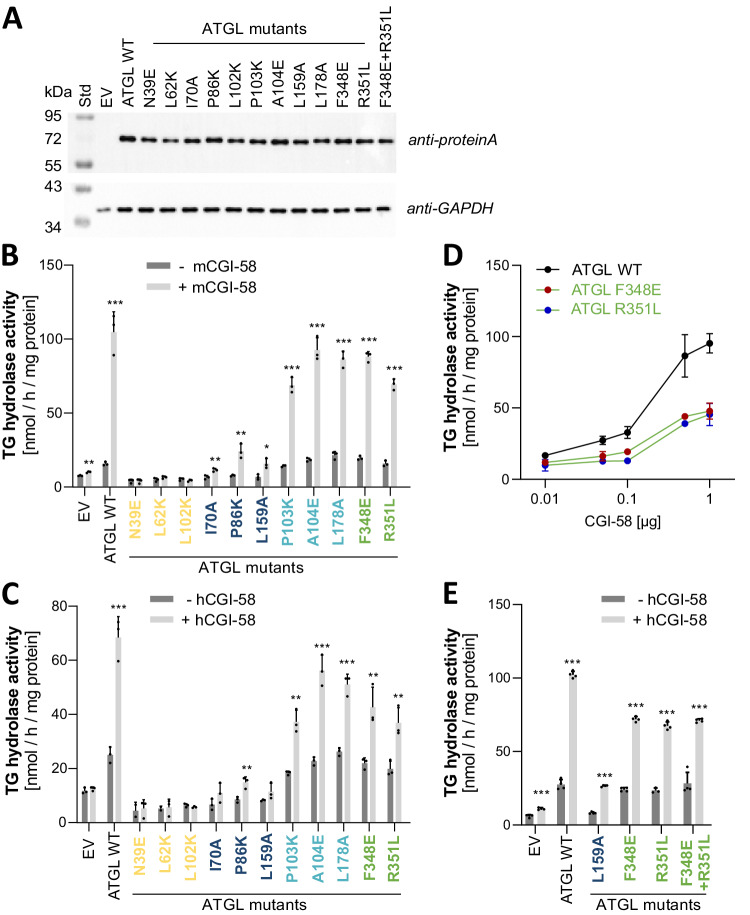
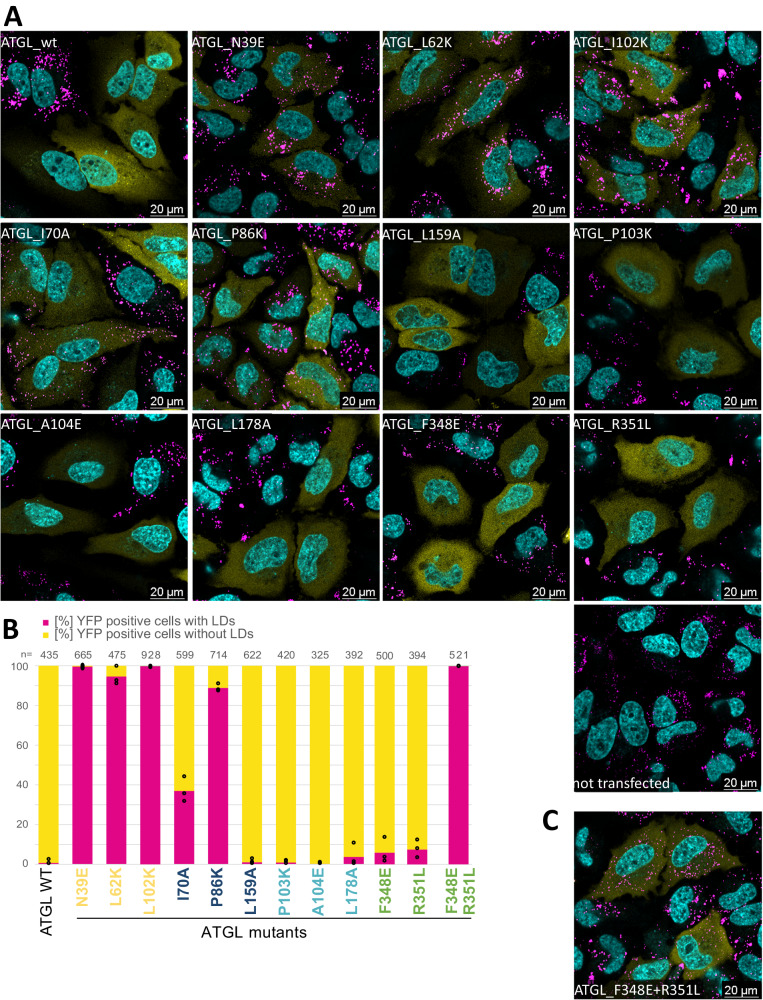
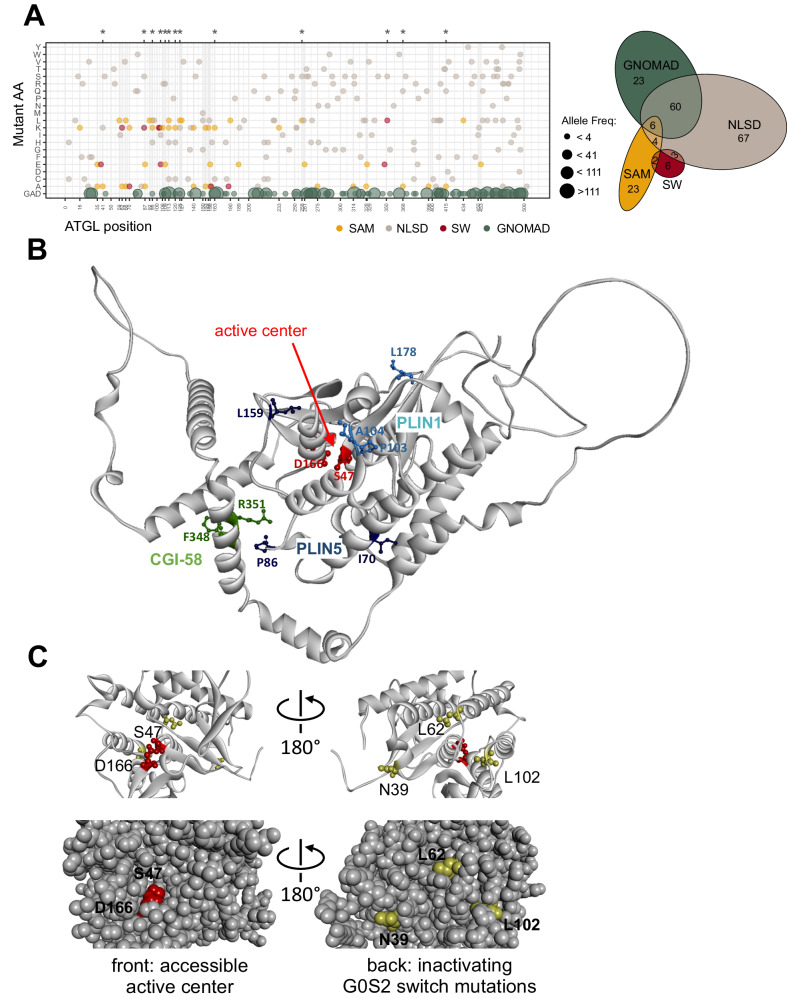
ATGL is a key enzyme in intracellular lipolysis and plays an important role in metabolic and cardiovascular diseases. ATGL is tightly regulated by a known set of protein-protein interaction partners with activating or inhibiting functions in the control of lipolysis. Here, we use deep mutational protein interaction perturbation scanning and generate comprehensive profiles of single amino acid variants that affect the interactions of ATGL with its regulatory partners: CGI-58, G0S2, PLIN1, PLIN5 and CIDEC. Twenty-three ATGL amino acid variants yield a specific interaction perturbation pattern when validated in co-immunoprecipitation experiments in mammalian cells. We identify and characterize eleven highly selective ATGL switch mutations which affect the interaction of one of the five partners without affecting the others. Switch mutations thus provide distinct interaction determinants for ATGL's key regulatory proteins at an amino acid resolution. When we test triglyceride hydrolase activity in vitro and lipolysis in cells, the activity patterns of the ATGL switch variants trace to their protein interaction profile. In the context of structural data, the integration of variant binding and activity profiles provides insights into the regulation of lipolysis and the impact of mutations in human disease.


Conflict of interest statement

The authors declare no competing interests.

Figures

Fig. 1
Fig. 1. Mapping ATGL protein interaction determinants using deep mutational interaction perturbation scanning.
A Schematic overview of ATGL and its interaction partners. Known AA residues mediating the interactions are annotated, see text for references. The Perilipin family members bind ATGL within the patatin domain. G0S2 also binds ATGL within the patatin domain, inhibits its hydrolytic activity. CIDEC, another lipolysis inhibiting protein interacts with the C-terminal part of ATGL. CGI-58 binds ATGL via the patatin domain as well as the C-terminal part. However, no interactions sites on ATGL for its partners were identified. B Schematic overview of the deep mutational interaction perturbation screening approach. Plasmid libraries of ATGL were generated using array programmed deep mutagenesis, exchanging single amino acid to A, K, E, or L, respectively. Reverse Y2H strains were transformed with the ATGL libraries and mated with yeast strains expressing a WT interaction partner. Interaction-disrupting mutations were enriched through yeast growth, and mutations perturbing the PPI were identified by NGS sequencing. C Scatter plot of read counts of library 1 in the Gateway Entry vector after deep mutagenesis with the library after yeast mating prior to growth selection. Read counts compared for sum of mutants per codon (left) as well as per position (right). R2 values indicate that the library did not change during the cloning procedure. D Scatter plot of read counts of the two independent ATGL libraries. Library 1 and Library 2 were compared for their sum of mutants observed per codon (left) as well as per position (right). Red colored circles indicate programmed AKEL mutations which are higher in library 2 than library 1. The outlier data point (Position 1) in library 1 in the right graph likely stems from an PCR amplification step early during preparation.
Fig. 2
Fig. 2. Interaction perturbation maps of ATGL with five key regulatory binding partners.
A Combined interaction perturbation profiles for each ATGL binding partner. Top two profiles indicate relative solvent accessibility (RSA) and disorder obtained from IUPRED over the ATGL sequence. Combined, normalized individual profiles at codon resolution for the programmed AEKL mutations for the five interaction partners are shown (n number of experiments). Source data are provided as a Source Data file. B Heat map of frequency of single amino acid substitutions across all interactions. AKEL substitutions were counted for every amino acid across all probed interactions and normalized to the frequency of occurrence in the ATGL wild-type sequence. C Zoom in at the perturbation profiles showing binding specificities of amino acid residues N39, P103, and L159. Mutations at position N39 affected the interaction of ATGL with CGI-58 and G0S2. The variant N39E (E::GAA) was selected as for further validation. Mutations at P103 influence several interactions with ATGL, however the exchange to K (K::AAG) selectively perturbed the interactions with Plin5 and Plin1. The L159A (A::GCT) substitution strongly perturbed the interaction with Plin5 and was selected for detailed variant analysis.
Fig. 3
Fig. 3. ATGL switch mutations selectively interrupt individual binding partners.
A Luciferase-based co-immunoprecipitation of 52 ATGL mutants with five protein interaction partners. Box plot of showing the mean of triplicate measurements of two experiments each probing murine Plin5 (blue), murine Plin1 (cyan), G0S2 (yellow), CIDEC (red), and CGI-58 (green) for interaction with the human ATGL variants (gray data points), ATGL wild-type (green data points) and a negative control (red data points). Log2 fold changes in binding relative to ATGL wild-type was determined within every experiment (Supplementary Data 4). Values were normalized across the experiments to the 3rd quartile indicating increased or decreased interaction signal. The boxes extend from 1st to 3rd quartile with the central band representing the median. The whiskers extend to the furthest point up to 1.5 times the interquartile range away from the nearest quartile. B Systematic overview of the binding data of the 52 ATGL variants. Variants are shown with their location within the patatin domain or in the C-terminal half of the protein. ATGL variants reducing the binding by more than twofold are marked as colored dots according to the affected interaction partner. The switch mutants are highlighted separately. Color code: CGI-58 green, CIDEC red, G0S2 yellow, mPlin1 cyan and mPlin5 blue. C Binding data for eleven ATGL switch mutations. For each interaction partner (color coded) normalized log2FC of two experiments performed in triplicates are shown. Single amino acid ATGL variants are color-coded according to the most specific binding alteration with a single partner, color code: CGI-58 green, CIDEC red, G0S2 yellow, mPlin1 cyan, and mPlin5 blue. Log2FC values within −0.5–0.5 (gray area) indicate wild-type-like binding behavior.
Fig. 4
Fig. 4. Enzymatic activity of ATGL switch variants.
A Western blot analysis of ATGL switch variant expression in Expi293 cells. 5 µg protein of the whole cell lysate was separated on a 10% SDS-gel and stained with anti-Protein A Ab (top) and anti-GAPDH Ab (bottom). B, C TAG hydrolase activity detected in lysates of Expi293 cells. Activity was determined in the absence (−CGI-58, dark gray bars) or presence (+CGI-58, light gray bars) of purified full-length mouse CGI-58 from E. coli (B) or 10 µg lysate from cells expressing full-length human CGI-58 (C). EV, lysate with empty vector control, for measures of basal activity (−CGI-58, dark gray bars), the CGI-58 preparation was heat inactivated before addition. Single amino acid ATGL variants are color-coded according to the most specific binding alteration with a single partner, color code: CGI-58 green, G0S2 yellow, PLIN1 cyan, and PLIN5 blue. All samples were measured in triplicates and are shown as mean values + standard deviation. Statistical significance was determined by unpaired two-tailed t-test (*p < 0.005, **p < 0.01, ***p < 0.001). Source data are provided as a Source Data file. D Dose-dependent CGI-58 stimulation of ATGL switch variants. Data are presented as mean values, error bars indicate ± standard deviation of triplicate experiments. E TAG hydrolase activity detected in lysates of Expi293 cells as in D including the ATGL-F348E + R351L double mutant protein variant. ATGL-WT, L159A, F348E, and R351L are shown for direct comparison. Data are shown as mean values + standard deviation. Statistics as in (B and C).
Fig. 5
Fig. 5. ATGL variant activity in live cells.
A Confocal images of HeLa cells transfected with YFP-ATGL variants. Pictures are merged fluorescent images with Hoechst in cyan, YFP-ATGL in yellow, and Bodipy in magenta. Experiments were repeated independently three times with similar results. Transfected cell with LDs are counted in (B) with n > 393. B Fraction [%] of YFP-positive cells with LDs (magenta) and without LDs (yellow). Cells expressing YFP-ATGL from three independent experiments (black open dots) were classified according to presence of absence (<2) of LDs. n = total number of cells counted. Single amino acid ATGL variants are color-coded according to the most specific binding alteration with a single partner, color code: CGI-58 green, G0S2 yellow, PLIN1 cyan, and PLIN5 blue. Source data are provided as a Source Data file. C Confocal image of HeLa cells transfected with YFP-ATGL-F348E + R351L double mutant. Picture as in (A). Experiments were repeated independently three times with similar results.
Fig. 6
Fig. 6. ATGL variants in a disease and structural context.
A Dotplot of annotated ATGL ClinVar missense substitutions associated with NLSD-M (ClinVar entries for PNPLA2, downloaded 10/2022). Gray dots: ClinVar mutations, yellow dots: selected ATGL mutations (SAM), red dots: switch mutations (SW). Green dots: variants from GnomAD (2.1.1. 03/2023). Asterisks on top highlight the positions T41, P86, R95, A104, H109, R113, R120, E125, R163, P258, R351, E368, and Y415, which overlap between the NLSD-M disease mutations and the SAM and SW mutants. Right: Euler diagram illustrating the overlaps of ClinVar missense mutations found in NLSD-M patients (gray), and the selected ATGL mutations (SAM, yellow) and the switch mutations (SW, red), and the missense variants from GnomAD (GNOMAD, green). B AlphaFold 3D structure model of the ATGL C-backbone [AF-E3VVS7] indicating binding partner contacts. Position and amino acid side chains (ball and stick) of (1) the Plin5 switch variants I70, P86, and L159 (blue) and (2) of the Plin1 switch variants P103, A104, and L178 (cyan) and (3) of the CGI-58 switch variants F348 and R351 are displayed. The catalytic dyad comprising S44 and D166 (red) are highlighting the active center within the patatin domain fold. C Zoom in of the patatin domain. Left: view through the hydrophobic cavity towards the catalytic dyad comprising S44 and D166 (red) and the G0S2 switch positions N39, L62, and L102 (yellow) in the back. Right: structure turned by 180° around a vertical axis providing a view from the back of the domain, the side where the G0S2 switch mutations are solvent exposed. Bottom left, space fill model showing open cavity to the catalytic center. Bottom right, 180° turned view as above with the three switch mutations exposed to the surface in the back of the domain. The active center is not accessible from the side of the G0S2 switch residues. G0S2 switch positions L62 and L102 are located closest (~15 Å) to the catalytic residue S47.

References

    1. Olzmann JA, Carvalho P. Dynamics and functions of lipid droplets. Nat. Rev. Mol. Cell Biol. 2019;20:137–155. doi: 10.1038/s41580-018-0085-z. - DOI - PMC - PubMed
    1. Grabner GF, Xie H, Schweiger M, Zechner R. Lipolysis: cellular mechanisms for lipid mobilization from fat stores. Nat. Metab. 2021;3:1445–1465. doi: 10.1038/s42255-021-00493-6. - DOI - PubMed
    1. Zimmermann R, et al. Fat mobilization in adipose tissue is promoted by adipose triglyceride lipase. Science. 2004;306:1383–1386. doi: 10.1126/science.1100747. - DOI - PubMed
    1. Haemmerle G, et al. Defective lipolysis and altered energy metabolism in mice lacking adipose triglyceride lipase. Science. 2006;312:734–737. doi: 10.1126/science.1123965. - DOI - PubMed
    1. Haemmerle G, et al. ATGL-mediated fat catabolism regulates cardiac mitochondrial function via PPAR-α and PGC-1. Nat. Med. 2011;17:1076–1085. doi: 10.1038/nm.2439. - DOI - PMC - PubMed