. 2024 Mar 21;15(1):2550.
doi: 10.1038/s41467-024-46819-2.

Electrically driven amplification of terahertz acoustic waves in graphene

Affiliations

Electrically driven amplification of terahertz acoustic waves in graphene

Aaron H Barajas-Aguilar et al. Nat Commun. .

Abstract

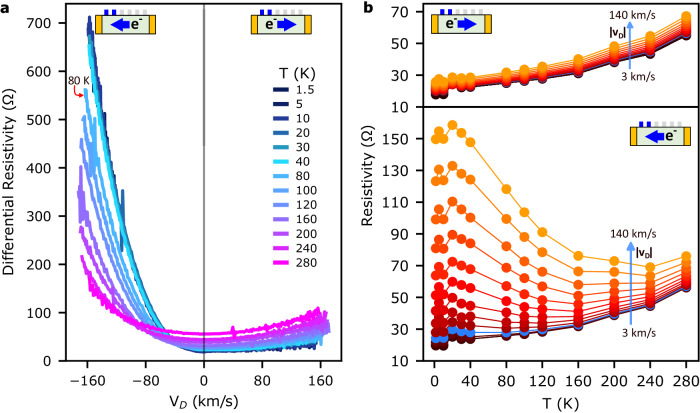
In graphene devices, the electronic drift velocity can easily exceed the speed of sound in the material at moderate current biases. Under these conditions, the electronic system can efficiently amplify acoustic phonons, leading to an exponential growth of sound waves in the direction of the carrier flow. Here, we show that such phonon amplification can significantly modify the electrical properties of graphene devices. We observe a superlinear growth of the resistivity in the direction of the carrier flow when the drift velocity exceeds the speed of sound - resulting in a sevenfold increase over a distance of 8 µm. The resistivity growth is observed at carrier densities away from the Dirac point and is enhanced at cryogenic temperatures. We develop a theoretical model for the resistivity growth due to the electrical amplification of acoustic phonons - reaching frequencies up to 2.2 THz - where the wavelength is controlled by gate-tunable transitions across the Fermi surface. These findings provide a route to on-chip high-frequency sound generation and detection in the THz frequency range.


Conflict of interest statement

The authors declare no competing interests.

Figures

Fig. 1
Fig. 1. Acoustic phonon amplification and observation of resistance growth in the direction of carrier flow.
a Top: Schematic of the graphene electronic distribution with a drift velocity (vD). The blue shaded region shows the occupied states. The Fermi surface is tilted such that the energy difference between right and left moving carriers is ħvD2kF. When vD > vS, the carriers can backscatter and emit a phonon of energy ħvS2kF (transition is indicated by the orange arrow). Bottom: device under the phonon amplification conditions, the phonon population grows exponentially with distance in the direction of the carrier flow. b Resistivity versus electron carrier density for device A, the absence of satellite peaks indicates that the graphene and hBN layers of the device are unaligned. c top: Voltage difference (ΔV) between pairs of consecutive contacts vs. source-drain current for device A. The voltage differences ΔV1-2 (blue) and ΔV5-6 (orange) exhibit the largest non-Ohmic behavior (n = 1.4 × 1012 cm2), bottom: differential resistivity vs. source-drain current for the outermost pairs of contacts (ΔV1-2 and ΔV5-6) showing asymmetric non-Ohmic behavior. Inset: the optical image of device A with a 13 μm length, 3 μm width, and center-to-center distance between voltage probe contacts of 2 μm. The colored bars label the pairs of contacts used to measure the voltage differences plotted in the top and bottom panels. d Position dependence of the resistivity at different drift velocities for n = +1.4 × 1012 cm2 (top panels) and n = −1.4 × 1012 cm2 (bottom panels). Lines are a visual aid connecting data points. The device cartoons show the carrier flow direction and carrier type for each case, the source contact is on the left, as in (c). The maximum drift velocity in the top panels is 154 km/s (j = 0.34 mA/μm), and 104 km/s in the bottom panels. Note that the maximum vD achieved for holes is lower than for electrons due to larger source-drain contact resistance. All measurements are performed at T = 1.5 K.
Fig. 2
Fig. 2. The resistance growth is sensitive to carrier density and only occurs when vD > vS.
Differential resistivity as a function of current (a) and drift velocity (b) at different carrier densities. The shadowed regions indicate drift velocities between 13 and 21 km/s, corresponding to the speed of sound for TA and LA phonons, respectively. Inset: Logarithmic plot of differential resistivity normalized to the value at vD = 0. c, d Same differential resistivity data plotted vs. carrier density for constant drift velocities (positive and negative for (c) and (d), respectively). The device cartoons indicate the carrier type and flow direction, as well as the contacts being measured in each case (contacts 1–2 for all the panels). The highlighted blue traces correspond to a drift velocity of 32 km/s, which is the lowest drift velocity above vS-LA = 21 km/s shown in this plot. All measurements are performed at T = 1.5 K. Note that data were taken within a maximum source-drain voltage of ±0.6 V. Hence the curves appear with different ranges when plotted versus current, vD, or for constant values of vD.
Fig. 3
Fig. 3. Resistance due to amplified acoustic phonons is largest at low temperatures.
a Differential resistivity vs. drift velocity was measured for contacts 1–2 at different temperatures from 1.5 to 280 K at n = 1.4 × 1012 cm2. b Resistivity for contacts 1–2 as a function of temperature for constant drift velocities. The blue arrows indicate the direction of growth of the vD magnitude. The blue traces correspond to vD = 37 km/s, from which the temperature dependence of the resistivity inverts when the carriers move downstream. The excess resistivity induced by high vD at 1.5 K is 130 Ω. The excess resistivity induced by heating from 1.5 K to 280 K for vD = 3 km/s is 37 Ω.

References

    1. van Capel PJS, et al. Correlated terahertz acoustic and electromagnetic emission in dynamically screened InGaN/GaN quantum wells. Phys. Rev. B. 2011;84:085317. doi: 10.1103/PhysRevB.84.085317. - DOI
    1. Armstrong MR, et al. Observation of terahertz radiation coherently generated by acoustic waves. Nat. Phys. 2009;5:285–288. doi: 10.1038/nphys1219. - DOI
    1. Park S-H, et al. Terahertz radiation from propagating acoustic phonons based on deformation potential coupling. Opt. Express. 2022;30:23544–23555. doi: 10.1364/OE.460471. - DOI - PubMed
    1. Mitrano M, et al. Possible light-induced superconductivity in K3C60 at high temperature. Nature. 2016;530:461–464. doi: 10.1038/nature16522. - DOI - PMC - PubMed
    1. Zhao P, et al. Acoustically induced giant synthetic hall voltages in graphene. Phys. Rev. Lett. 2022;128:256601. doi: 10.1103/PhysRevLett.128.256601. - DOI - PubMed