. 2024 Mar 21;15(1):2528.
doi: 10.1038/s41467-024-46873-w.

Tertiary lymphoid structures and B cells determine clinically relevant T cell phenotypes in ovarian cancer

Affiliations

Tertiary lymphoid structures and B cells determine clinically relevant T cell phenotypes in ovarian cancer

Lenka Kasikova et al. Nat Commun. .

Abstract

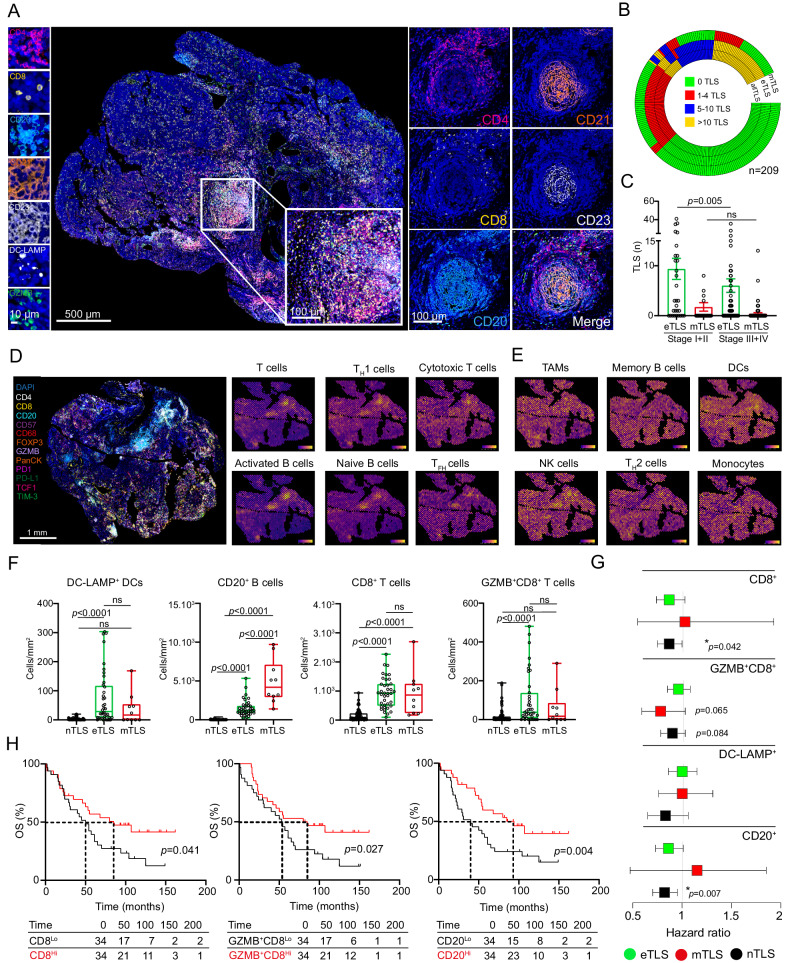
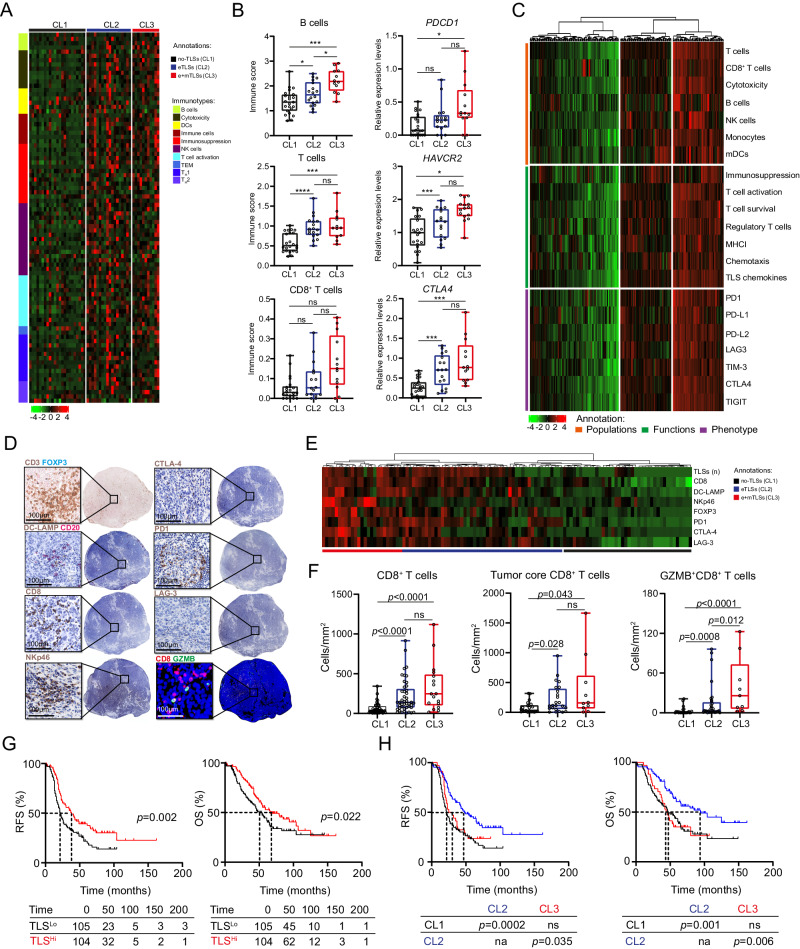
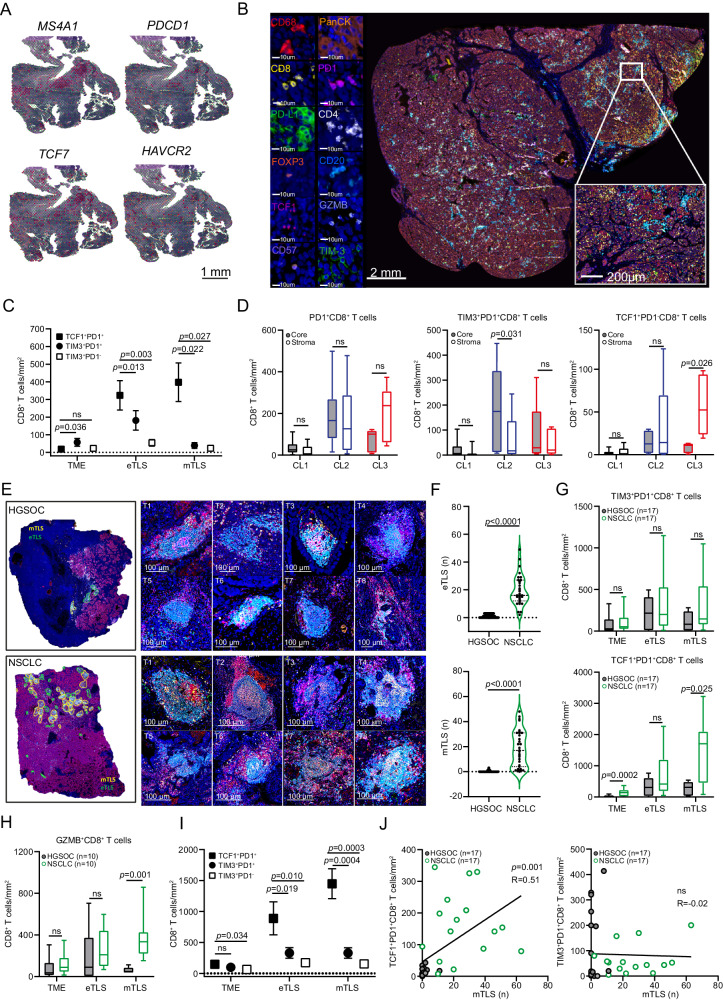
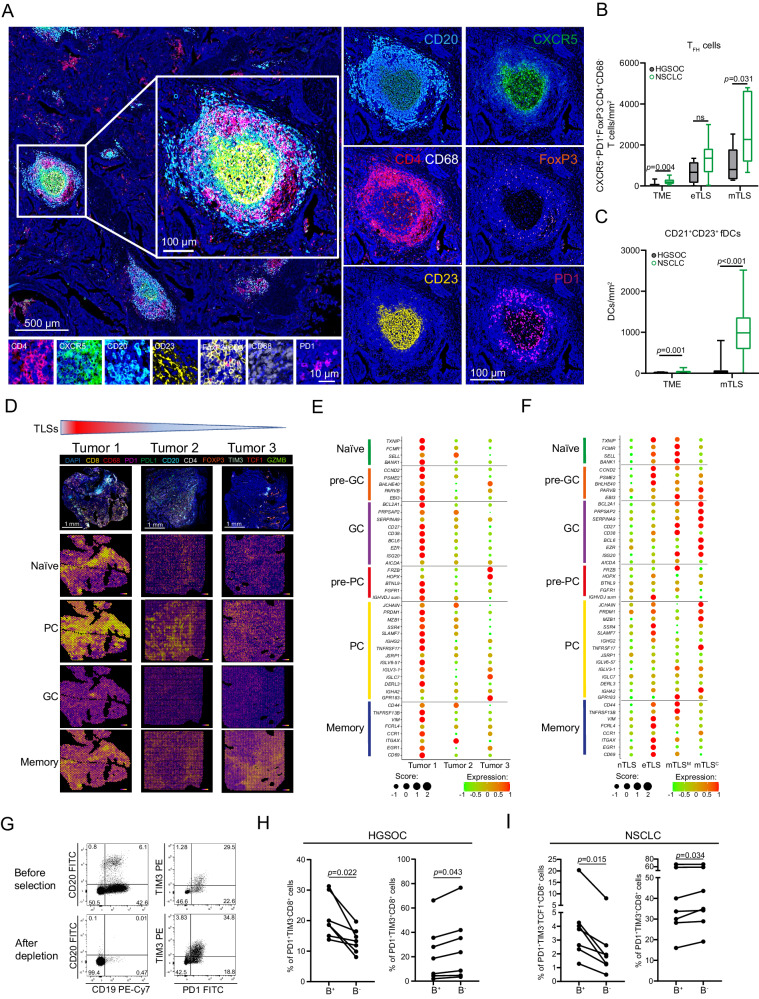
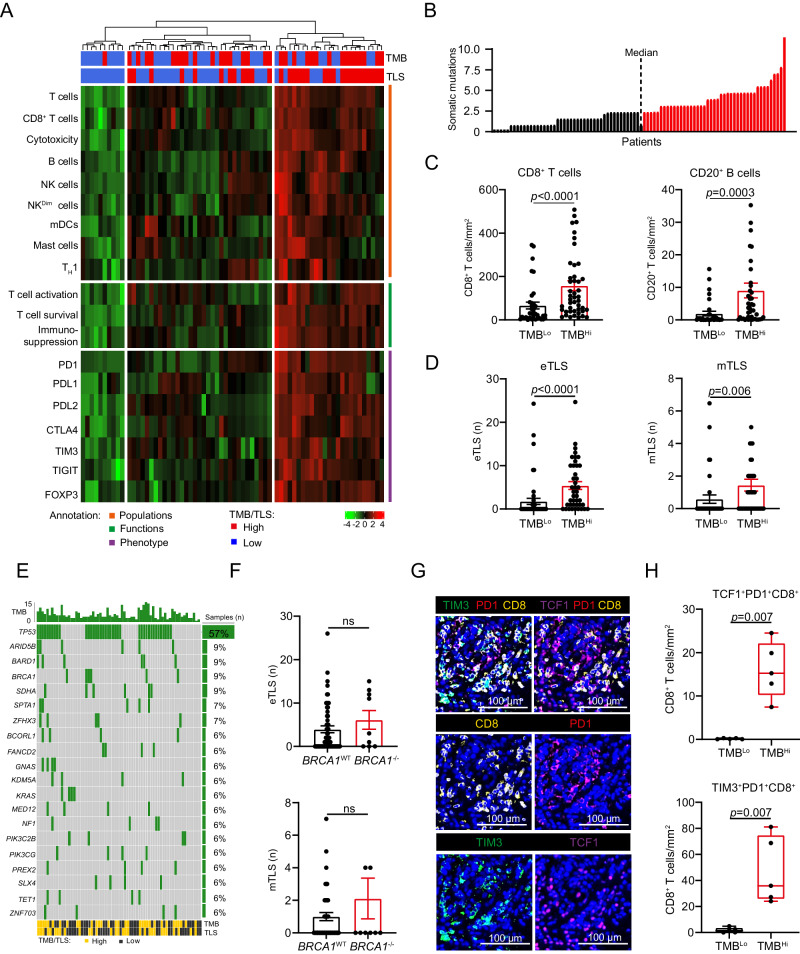
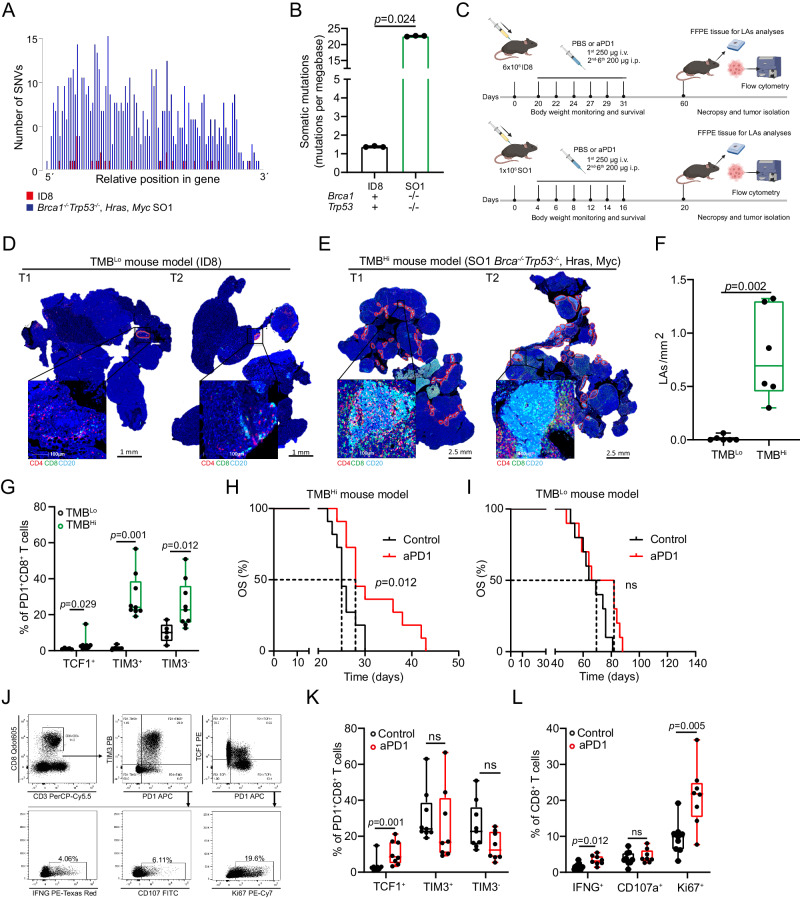
Intratumoral tertiary lymphoid structures (TLSs) have been associated with improved outcome in various cohorts of patients with cancer, reflecting their contribution to the development of tumor-targeting immunity. Here, we demonstrate that high-grade serous ovarian carcinoma (HGSOC) contains distinct immune aggregates with varying degrees of organization and maturation. Specifically, mature TLSs (mTLS) as forming only in 16% of HGSOCs with relatively elevated tumor mutational burden (TMB) are associated with an increased intratumoral density of CD8+ effector T (TEFF) cells and TIM3+PD1+, hence poorly immune checkpoint inhibitor (ICI)-sensitive, CD8+ T cells. Conversely, CD8+ T cells from immunologically hot tumors like non-small cell lung carcinoma (NSCLC) are enriched in ICI-responsive TCF1+ PD1+ T cells. Spatial B-cell profiling identifies patterns of in situ maturation and differentiation associated with mTLSs. Moreover, B-cell depletion promotes signs of a dysfunctional CD8+ T cell compartment among tumor-infiltrating lymphocytes from freshly isolated HGSOC and NSCLC biopsies. Taken together, our data demonstrate that - at odds with NSCLC - HGSOC is associated with a low density of follicular helper T cells and thus develops a limited number of mTLS that might be insufficient to preserve a ICI-sensitive TCF1+PD1+ CD8+ T cell phenotype. These findings point to key quantitative and qualitative differences between mTLSs in ICI-responsive vs ICI-irresponsive neoplasms that may guide the development of alternative immunotherapies for patients with HGSOC.


Conflict of interest statement

L.G. is/has been holding research contracts with Lytix Biopharma, Onxeo and Promontory, has received consulting/advisory honoraria from Boehringer Ingelheim, AstraZeneca, OmniSEQ, Onxeo, The Longevity Labs, Inzen, Sotio, Promontory, Noxopharm and the Luke Heller TECPR2 Foundation, and holds Promontory stock options. R.Sp. is minority shareholder of Sotio Biotech a.s. A.R. declare advisory services and invited lectures for Amgen, AstraZeneca, BMS, Eli-Lilly, Janssen-Cilag, MSD, Roche. All other authors have no conflicts to declare.

Figures

Fig. 1
Fig. 1. The clinical relevance of spatial immune composition in distinct maturation types of tertiary lymphoid structures (TLS) in HGSOC.
A Representative image of immunofluorescence of CD4, CD8, CD20, CD21, CD23, DC-LAMP and GZMB staining (immunofluorescence panel 1). Scale bars 10, 100 and 500 µm. B Distribution of early TLS (eTLS) and mature TLS (mTLS) across 209 HGSOC patients (Study cohort 1 and 2; Supplementary Table 1) and C across pathologic disease stage of 123 HGSOC patients. (Study cohort 1; Stage I + II: n = 34; Stage III + IV: n = 89; Supplementary Table 1). Mean and SEM are shown. Statistical significance was calculated by two-sided Mann-Whitney test. p values are indicated. ns, not significant. Spatial co-localization of TLS with gene signatures of (D) T cells, TH1 cells, cytotoxic T cells, activated and naive B cells, T follicular cells (TFH) cells, (E) tumor associated macrophages (TAMs), memory B cells, dendritic cells (DCs), natural killer (NK) cells, TH2 cell and monocytes in tumor sample from Study Cohort 1, determined by Visium transcriptomic (repeated in 3 independent HGSOC samples). Immunofluorescence staining for CD4, CD8, CD20, CD57, CD68, FoxP3, GZMB, PanCK, PD1, PD-L1, TCF1 and TIM3 (immunofluorescence panel 2) on FFPE TLS+ tumor used for the spatial transcriptomic assay delineate pathologically identified TLS areas. F Density of DC-LAMP+ DCs, CD20+ B cells, CD8+ T cells and GZMB+CD8+ T cells in non-TLS areas (nTLS), eTLS and mTLS within 68 tumor samples (Study cohort 1, group 1), as determined by immunostaining (immunofluorescence panel 1). Box plots: lower quartile, median, upper quartile; whiskers, minimum, maximum. Statistical significance was calculated by two-sided the Mann–Whitney test. p values are indicated. G Forest plot displaying univariate Cox analyses of density of CD8+ T cells, GZMB+CD8+ T cells, DC-LAMP+ DCs and CD20+ B cells in non-TLS areas (nTLS), eTLS and mTLS areas of 68 tumor samples (Study cohort 1, group 1). All hazard ratios are obtained from Cox proportional hazard models with adjustment for randomised group only. Lower quartile, mean, upper quartile are shown. H Overall survival (OS) of 68 patients (Study cohort 1, group 1) based on median stratification of CD8+ T cells, GZMB+CD8+ T cells and CD20+ B cells density in nTLS areas of tumor samples. Survival curves were estimated by the Kaplan-Meier method, and differences between groups were evaluated using log-rank test. Number of patients at risk and p values are reported. Source data are provided as a Source Data file.
Fig. 2
Fig. 2. The clinical impact of TLS maturation on development of antitumor immunity in HGSOC.
A Supervised hierarchical clustering of 53 tumor samples of HGSOC patients (Study Cohort 1) with TLS development (no TLSs, Cluster 1, n = 23), only early TLS (eTLS, Cluster 2, n = 18), early and mature TLS (eTLS+mTLS, Cluster 3, n = 12) based on the expression of 100 genes classified into clusters related to B cells, cytotoxicity, dendritic cells (DCs), immune cells, immunosuppression, natural killers (NK) cells, T cell activation, TEM, TH1 and TH2 signatures as determined on RNA sequencing data from Study cohort 1. B Gene expression signature associated with B cells, T cells, CD8+ T cells as determined by MCP counter on RNAseq data and relative gene expression levels of PDCD1, HAVCR2, CTLA4 as determined on RNAseq data across patients (n = 53; Study cohort 1) separated into 3 clusters (clusters determined by immunofluorescence in (A), CL1: n = 23; CL2: n = 18; CL3: n = 12). Box plots: lower quartile, median, upper quartile; whiskers, minimum, maximum. Statistical significance was calculated by two-sided Mann–Whitney test. ns not significant. C Unsupervised hierarchical clustering of gene signatures related to immune populations (orange), immune functions (green) and immune phenotype (purple) in tumor samples of 304 HGSOC patients from TCGA public database (Study cohort 4). D Representative images of double immunohistochemistry for CD3 and FoxP3, DC-LAMP and CD20 cells, single IHC for CD8, NKp46, CTLA-4, PD1, LAG-3 and double immunofluorescence (IF) staining of CD8 GZMB cells. Scale bar, 100 µm. E Unsupervised hierarchical clustering of HGSOC patients (n = 115; Study Cohort 1) based on frequency of TLS and densities of CD8+ T cells, DC-LAMP+ DCs, NKp46+ NK cells, FoxP3+ cell, PD1+, CTLA-4+ and LAG-3+ cells as determined by immunostaining. F Density of CD8+ (CL1: n = 44; CL2: n = 45; CL3: n = 17), tumor core CD8+ (CL1: n = 21; CL2: n = 24; CL3: n = 10) and GZMB+CD8+ cells (CL1: n = 24; CL2: n = 32; CL3: n = 9) in tumor samples of HGSOC patients (Study Cohort 1) separated into 3 clusters (CL1, no TLS development; CL2, only eTLS development; CL3, both eTLS and mTLS development), as determined by immunostaining. Box plots: lower quartile, median, upper quartile; whiskers, minimum, maximum. Statistical significance was calculated by two-sided Mann–Whitney test. p values are indicated. G, H Relapse-free survival (RFS) and overall survival (OS) of 209 HGSOC patients (Study Cohort 1 and 2; Supplementary Table 1) based on median stratification of total TLS (G) and based on stratification into 3 clusters (CL1, no TLS development, n = 87; CL2, only eTLS development, n = 86; CL3, both eTLS and mTLS development, n = 36). Survival curves were estimated by the Kaplan-Meier method, and differences between groups were evaluated using log-rank test. Number of patients at risk and p values are reported. *p < 0.01; **p < 0.001; ***p < 0.0001. Source data and exact p values are provided as a Source Data file.
Fig. 3
Fig. 3. TLS frequency and maturation impact the T cell phenotype in HGSOC.
A Spatial co-localization of TLSs with MS4A1, PDCD1, TCF7 and HAVCR2 genes in TLSHi tumor sample from Study Cohort 1. B Representative image of immunofluorescence of CD68, CD8, PD-L1, FoxP3, TCF1, CD57, PanCK, PD1, CD4, CD20, GZMB and TIM3 staining (immunofluorescence panel 2). Scale bar, 2 mm, 10 µm and 200 µm. C Density of TCF1+PD1+CD8+ T cells, TIM3+PD1+CD8+ and TIM3+PD1CD8+ T cells within complete tumor microenvironment (TME, including TLSs), early TLS (eTLS) and mature TLS (mTLS) of 19 HGSOC tumor samples (Study cohort 1, n = 19). Mean and SEM are shown. Statistical significance was calculated by two-sided Wilcoxon matched-pairs signed rank test. p values are indicated. D Density of PD1+CD8+, TIM3+PD1+CD8+ and TCF1+PD1+CD8+ T cells within tumor stroma and tumor core of 19 HGSOC patients (Study Cohort 1) separated into 3 clusters (CL1, no TLS development, n = 8; CL2, only eTLS development, n = 6; CL3, both eTLS and mTLS development, n = 5, as previously determined in Fig. 2) Box plots: lower quartile, median, upper quartile; whiskers, minimum, maximum. Statistical significance was calculated by two-sided Wilcoxon matched-pairs signed rank test. p values are indicated. Representative images (E) and violin plot (F) showing the frequency of eTLS and mTLS in 209 HGSOC and 31 non-small cell lung carcinoma (NSCLC) (Supplementary Table. 6). Statistical significance was calculated by two-sided Mann–Whitney test. p values are indicated. G, H Density of TIM3+PD1+CD8+, TCF1+PD1+CD8+ T cells and GZMB+CD8+ T cells within complete tumor microenvironment (TME, including TLS), eTLS and mTLS of HGSOC (Study cohort 1) and NSCLC samples (Study cohort 5) as determined by immunofluorescence. Number of patients involved in respective analyses are indicated. Box plots: lower quartile, median, upper quartile; whiskers, minimum, maximum. Statistical significance was calculated by two-sided Mann–Whitney test. p values are indicated. I Density of TCF1+PD1+CD8+ T cells, TIM3+PD1+CD8+ and TIM3+PD1-CD8+ T cells within complete tumor microenvironment (TME, including TLSs), early TLS (eTLS) and mature TLS (mTLS) in 17 NSCLC tumor samples (Study cohort 5). Mean and SEM are shown. Statistical significance was calculated by two-sided Wilcoxon matched-pairs signed rank test. p values are indicated. J Correlation between frequency of mTLS and TIM3+PD1+CD8+ and TCF1+PD1+CD8+ T cells in TME of 17 HGSOC and 17 NSCLC patients as determined by multispectral immunofluorescence. p values are indicated. R, Pearson correlation coefficient. Source data are provided as a Source Data file.
Fig. 4
Fig. 4. In situ activated intratumoral B cells impact CD8+ T cells phenotype in HGSOC and NSCLC.
Representative image (A) and box plot showing the density of CXCR5+PD1+FoxP3-CD68-CD4+ TFH cells (B) in the complete tumor microenvironment (TME), eTLS and mTLS of HGSOC (n = 17) and NSCLC (n = 10) patients and C box plot showing density of CD23+CD20+ follicular dendritic cells (fDCs) in TLSLo and TLSHi HGSOC (n = 16) and NSCLC (n = 14) patients. Box plots: lower quartile, median, upper quartile; whiskers, minimum, maximum. Statistical significance was calculated by two-sided Mann–Whitney test. p values are indicated. D, E Spatial co-localization and dot plot showing expression profile of genes signatures of B cells subtypes, e.g. naive, pre-plasma cells (pre-PC), plasma cells (PC), pre-germinal center (pre-GC), germinal center (GC) and memory B cells within 3 individual tumor samples (Study cohort 1) with decreasing frequency of TLS, as determined by Visium spatial transcriptomic. F Dot plot showing expression profile of genes signatures of B cell subtypes, e.g. naive, pre-germinal center (pre-GC), germinal center (GC), pre-plasma cells (pre-PC), plasma cells (PC) and memory B cells within non-TLS areas (nTLS), early TLS (eTLS), margin (mTLSM) and central (mTLSC) area of mTLS in one selected TLSHi tumor sample as determined by Visium spatial transcriptomic. G-I Representative dot plot and flow cytometry analyses for frequency of TIM3-PD1+CD8+ and TIM3+PD1+CD8+ T cells before and after CD19+CD20+ B cells depletion from native HGSOC (n = 7; Study cohort 6) (H) and NSCLC (n = 7; Study cohort 7) (I) tumor tissue. Statistical significance was calculated by two-sided Wilcoxon matched-pairs signed rank test. p values are indicated. Source data are provided as a Source Data file.
Fig. 5
Fig. 5. TMB positively correlates with the formation of TLS structures in HGSOC.
A Unsupervised hierarchical clustering of gene signatures related to immune populations (orange), immune functions (green) and immune phenotype (purple), as determined by the PanCancer Immune Profiling Panel from Nanostring and further annotated by tumor mutational burden (TMB) determined by TrueSightOnco500 and TLS numbers as determined by immunofluorescence staining in tumor samples (n = 68; Study cohort 2). B Distribution of TMB in 79 tumor samples (Study cohort 2), with median display. Dot plot representing density of CD8+ T cells and CD20+ B cells (C) and number of early TLS (eTLS) and mature TLS (mTLS) (D) in TMBLo (n = 32) and TMBHi (n = 44) tumor samples, as determined by median stratification (Study cohort 2). Mean and SEM are shown. Statistical significance was calculated by two-sided Mann–Whitney test. p values are indicated. E Oncoplot showing the profile of somatic mutations in 79 tumors annotated by TMB and number of TLSs as determined by median stratification. F Number of eTLS and mTLS in BRCA1WT (n = 70) and BRCA1−/− (n = 9) HGSOC patients (n = 79; Study cohort 2). Mean and SEM are shown. Statistical significance was calculated by the Mann–Whitney test. p values are indicated. Representative images (G) and box plots (H) showing density of TCF1+PD1+CD8+ and TIM3+PD1+CD8+ T cells in 5 TMBLo and 5 TMBHi tumor samples (Study Cohot 2), as determined by median stratification. Box plots: lower quartile, median, upper quartile; whiskers, minimum, maximum. Statistical significance was calculated by two-sided Mann–Whitney test. p values are indicated. Source data are provided as a Source Data file.
Fig. 6
Fig. 6. TLSs and ICI sensitivity in mouse models of TMBLo and TMBHi ovarian cancer.
A, B Barplots showing single-nucleotide variants (SNVs) and the somatic mutations prevalence (mutations per megabase) in ID8 (n = 3) and Trp53-/- BRCA1-/-, Myc, Hras SO1 (n = 3) C57BL/6 syngeneic mouse ovarian cancer cell lines. Mean and SEM are shown. Statistical significance was calculated by multiple T-test. p values are indicated. C Experimental design for the analysis of lymphoid aggregates (LAs) development and efficacy of anti-PD1 therapy in TMBLo ID8 and TMBHi SO1 experimental syngeneic mouse models. Created with BioRender.com. Representative immunostaining for CD4, CD8, CD20 and CD21 and a box plot showing density of lymphoid aggregates within TMBLo ID8 (n = 6) (D) and TMBHi SO1 (n = 6) (E) ovarian tumors (F). Scale bars 1 and 2.5 mm. Box plots: lower quartile, median, upper quartile; whiskers, minimum, maximum. Statistical significance was calculated by two-sided Mann–Whitney test. p values are indicated. G Box plot showing percentage of TCF1+PD1+CD8+, TIM3+PD1+CD8+ and TIM3PD1+CD8+ T cells in tumor samples of TMBLo ID8 (n = 5) and TMBHi SO1 (n = 9) experimental models. Box plots: lower quartile, median, upper quartile; whiskers, minimum, maximum. Statistical significance was calculated by two-sided Mann–Whitney test. p values are indicated. Overall survival (OS) of TMBHi SO1 (n = 22; control: 11, aPD1: 11) (H) and TMBLo ID8 (n = 20; control: 10, aPD1: 10) (I) experimental models after anti-PD1 therapy. Survival curves were estimated by the Kaplan–Meier method and differences between groups were evaluated using log-rank test. Representative dot plot (J) and flow cytometry analyses for percentages of TCF1+PD1+CD8+, TIM3+PD1+CD8+ and TIM3-PD1+CD8+ T cells (K) and IFNG+, CD107+ and Ki67+CD8+ T cells (L) in tumor samples of the TMBHi SO1 experimental model in the presence (n = 8) or absence (n = 9) of anti-PD1 therapy. Box plots: lower quartile, median, upper quartile; whiskers, minimum, maximum. Statistical significance was calculated by two-sided Mann–Whitney test. p values are indicated. Source data are provided as a Source Data file.

References

    1. Vitale I, Shema E, Loi S, Galluzzi L. Intratumoral heterogeneity in cancer progression and response to immunotherapy. Nat. Med. 2021;27:212–224. doi: 10.1038/s41591-021-01233-9. - DOI - PubMed
    1. Dersh D, Holly J, Yewdell JW. A few good peptides: MHC class I-based cancer immunosurveillance and immunoevasion. Nat. Rev. Immunol. 2021;21:116–128. doi: 10.1038/s41577-020-0390-6. - DOI - PubMed
    1. Wculek SK, et al. Dendritic cells in cancer immunology and immunotherapy. Nat. Rev. Immunol. 2020;20:7–24. doi: 10.1038/s41577-019-0210-z. - DOI - PubMed
    1. Galluzzi L, Humeau J, Buque A, Zitvogel L, Kroemer G. Immunostimulation with chemotherapy in the era of immune checkpoint inhibitors. Nat. Rev. Clin. Oncol. 2020;17:725–741. doi: 10.1038/s41571-020-0413-z. - DOI - PubMed
    1. Cytlak UM, et al. Immunomodulation by radiotherapy in tumour control and normal tissue toxicity. Nat. Rev. Immunol. 2022;22:124–138. doi: 10.1038/s41577-021-00568-1. - DOI - PubMed