. 2024 Mar 21;15(1):2526.
doi: 10.1038/s41467-024-46829-0.

Trimethylamine N-oxide impairs β-cell function and glucose tolerance

Affiliations

Trimethylamine N-oxide impairs β-cell function and glucose tolerance

Lijuan Kong et al. Nat Commun. .

Abstract

β-Cell dysfunction and β-cell loss are hallmarks of type 2 diabetes (T2D). Here, we found that trimethylamine N-oxide (TMAO) at a similar concentration to that found in diabetes could directly decrease glucose-stimulated insulin secretion (GSIS) in MIN6 cells and primary islets from mice or humans. Elevation of TMAO levels impairs GSIS, β-cell proportion, and glucose tolerance in male C57BL/6 J mice. TMAO inhibits calcium transients through NLRP3 inflammasome-related cytokines and induced Serca2 loss, and a Serca2 agonist reversed the effect of TMAO on β-cell function in vitro and in vivo. Additionally, long-term TMAO exposure promotes β-cell ER stress, dedifferentiation, and apoptosis and inhibits β-cell transcriptional identity. Inhibition of TMAO production improves β-cell GSIS, β-cell proportion, and glucose tolerance in both male db/db and choline diet-fed mice. These observations identify a role for TMAO in β-cell dysfunction and maintenance, and inhibition of TMAO could be an approach for the treatment of T2D.


Conflict of interest statement

The authors declare no competing interests.

Figures

Fig. 1
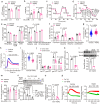
Fig. 1. TMAO was elevated in diabetic mice and subjects with diabetes and inhibited glucose-stimulated insulin secretion in islets.
a Plasma TMAO concentration in 9-week-old male control and db/db mice. n = 3 mice. b Hepatic Fmo3 mRNA levels in 15-week-old male control (n = 4 mice) and db/db mice (n = 8 mice). c Hepatic Fmo3 protein levels in 15-week-old male control (n = 4 mice) and db/db mice (n = 5 mice). d GSIS in MIN6 cells treated with or without TMAO (100 nM and 10 μM, 18 h). n = 3 (10 μM TMAO at 2.8 mM Glu) or 4 (others) biologically independent cell samples. e Intracellular insulin levels in MIN6 cells treated with or without TMAO (100 nM) for 18 h during GSIS. n = 5 biologically independent cell samples. f Intracellular insulin mRNA levels in MIN6 cells treated with or without TMAO (1 μM) for 24 h. n = 5 biologically independent cell samples. g GSIS in mouse primary islets treated with or without TMAO (100 nM, 18 h). n = 5 biologically independent islet samples. h Insulin levels measured during the perifusion of isolated mouse islets. n = 3 independent experiments. The levels of insulin secretion were measured after adding 2.8 mM glucose and 16.8 mM glucose during perifusion. The addition of 30 mM KCl led to membrane depolarization, which increased insulin secretion. i Serum TMAO concentration in control and T2D subjects. n = 60 subjects. j Hepatic FMO3 mRNA levels in control (n = 3 subjects) and NAFLD subjects (n = 10 subjects). k GSIS in human primary islets treated with or without TMAO (100 nM, 18 h). n = 4 biologically independent samples. Statistical significance was calculated (ad, g, ik) by two-sided Student’s t-test. The data are presented as mean ± SEM. Mice: C57BL/6 J, 12 weeks old (g, h). Glu, glucose. Source data are provided as a Source Data file.
Fig. 2
Fig. 2. A choline diet elevated plasma TMAO levels and impaired β-cell function and β-cell maintenance in C57BL/6 J mice.
a Schematic diagram of tests in male mice during chow diet and choline diet feeding. b Plasma TMAO concentration of male chow- and choline diet-fed (4 weeks) mice. n = 6 mice. c IPGTT of chow- and choline diet-fed (5 weeks) mice. n = 15 mice. The glucose dose was 2 g/kg of body weight. This step was followed by determining the AUC of the GTT. dg Plasma insulin (d), increase in plasma insulin (%, e), C-peptide (f) and increase in C-peptide (%, g) in male chow- and choline diet-fed (9 weeks) mice after 0, 2, and 5 min of intraperitoneal injection of glucose. n = 15 mice (d, e); n = 7 mice (f, g). hj Plasma insulin and AUC of first-phase (0–5 min) and second-phase (5–120 min) insulin levels during hyperglycemic clamp of male chow- (n = 7 mice) and choline diet-fed (13 weeks) mice (n = 9 mice). k GSIS of primary islets from male chow- and choline diet-fed (10 weeks) mice. n = 4 biologically independent islet samples. l Pancreatic HE staining in male chow- and choline diet-fed (13 weeks) mice. The arrowhead indicates inflammatory cells. Scale bar, 100 μm. mo Immunofluorescence of insulin (green), glucagon (red), and DAPI (blue) in paraffin-embedded pancreas sections from male chow- and choline diet-fed mice (m). This analysis was followed by measurements of % β-cell area (n) and % α cell area (o). n = 6 mice. Scale bar, 20 μm. p Plasma glucagon levels of male chow- (n = 10 mice) and choline diet-fed (6 weeks) mice (n = 9 mice). Statistical significance was calculated (be, gk, np) by two-sided Student’s t-test. P values in (h) denoted by asterisks (from left to right): P = 0.049, P = 0.046, P = 0.026, P = 0.006. Mice: C57BL/6 J, choline diet feeding from 8 weeks old (ap). Ins, insulin; Gcg, glucagon; AUC, area under the curve. Source data are provided as a Source Data file.
Fig. 3
Fig. 3. Genetic knockdown of Fmo3 improved β-cell function, β-cell loss and glucose homeostasis in choline diet-fed mice.
a Schematic diagram of tests in male Fmo3+/+ and Fmo3−/− mice fed a choline diet. b Hepatic Fmo3 mRNA levels in male Fmo3+/+ and Fmo3−/− mice. n = 3 mice. c Plasma TMAO levels in male Fmo3+/+ and Fmo3−/− mice after 6 weeks of a choline diet. n = 6 mice. d IPGTTs of male choline diet-fed (9 weeks) Fmo3+/+ (n = 7 mice) and Fmo3−/− mice (n = 10 mice). Then, the AUC of the GTT was determined. e Plasma insulin levels and increases in plasma insulin (%) after intraperitoneal injection of glucose for 0, 2, and 5 min in male choline diet-fed (14 weeks) Fmo3+/+ and Fmo3−/− mice. n = 7 mice. f Plasma C-peptide levels and increases in plasma C-peptide (%) after intraperitoneal injection of glucose for 0, 2, and 5 min in male choline diet-fed (15 weeks) Fmo3+/+ (n = 6 mice) and Fmo3−/− mice (n = 10 mice). g, h Plasma insulin levels and AUC of first-phase (0–5 min) and second-phase (5–120 min) insulin levels during hyperglycemic clamp in male choline diet-fed (18 weeks) Fmo3+/+ and Fmo3−/− mice. n = 5 mice. ik Immunofluorescence of insulin (green), glucagon (red) and DAPI (blue) in male Fmo3+/+ and Fmo3−/− choline diet-fed (18 weeks) mice (i). This step was followed by measurements of % β-cell area (j) and % α cell area (k). n = 8 mice. Scale bar, 10 μm. Statistical significance was calculated (bh, j) by two-sided Student’s t-test. The data are presented as mean ± SEM. Mice: C57BL/6 J, choline diet feeding from 8 weeks old (ak). Source data are provided as a Source Data file.
Fig. 4
Fig. 4. TMAO inhibited glucose-stimulated mitochondrial respiration and cytosolic calcium transients.
a ATP content in MIN6 cells treated with or without TMAO (1 μM, 18 h). n = 3 (vehicle at 16.8 mM Glu), or 4 (others) biologically independent cell samples. b ATP/ADP in MIN6 cells treated with or without TMAO (100 nM, 6 h). n = 5 (vehicle at 2.8 mM Glu), or 6 (others) biologically independent cell samples. cOCR (c, e) and ECAR (d, f) of MIN6 cells treated with or without TMAO (100 nM, 18 h) by a Seahorse XFe96 analyzer. n = 3 (c, e), or 8 (d, f) biologically independent cell samples. g Resting state cytoplasmic calcium in MIN6 cells treated with (n = 222) or without (n = 223) TMAO (100 nM, 18 h). h, i Cytosolic calcium dynamics (h) and peak value of cytosolic calcium transient (i) stimulated by high glucose (25 mM) in β cells of Ins1-GCaMP6f mouse primary islets treated with (n = 22 in (h); n = 105 in (i)) or without (n = 46 in (h); n = 131 in (i)) TMAO (100 nM, 18 h). j Serca mRNA levels in islets isolated from male chow- and choline diet-fed (13 weeks) mice. n = 5 (chow), or 6 (choline) mice. k, l Serca2b mRNA and protein levels in islets isolated from male control and db/db mice (12 weeks old). n = 3 (control), or 6 (db/db) mice (k); n = 3 mice (l). m Serca2b concentration in MIN6 cells treated with or without TMAO (1 μM, 18 h) by digital PCR. n = 5 (2.8 mM Glu), or 4 (16.8 mM Glu) biologically independent cell samples. n, o Serca2 protein levels and relative Serca activity/total cell protein in MIN6 cells treated with or without TMAO (100 nM, 1 μM or 10 μM, 18 h in (n); 100 nM, 18 h in (o)) under 16.8 mM glucose conditions. n = 3 (n), or 5 (o) biologically independent cell samples. p Glucose-stimulated cytoplasmic calcium and the release of ER calcium in MIN6 cells treated with or without TMAO (100 nM, 18 h). n = 3 biologically independent cell samples. Statistical significance was calculated (a, b, d–g, io) by two-sided Student’s t-test. The data are presented as mean ± SEM. Oligo, oligomycin; FCCP, carbonyl cyanide 4-(trifluoromethoxy) phenylhydrazone; ROT, rotenone; AA, antimycin A. DG, 2-deoxy-D-glucose. Source data are provided as a Source Data file.
Fig. 5
Fig. 5. TMAO signals through NLRP3 inflammasome activation to reduce Serca2 and GSIS.
a GSIS of MIN6 cells treated with TMAO (100 nM, 18 h) and the Serca agonist [6]-gingerol (0.08 μM, 10 min). n = 6 biologically independent cell samples. b GSIS of MIN6 cells treated with TMAO (100 nM, 18 h) and the Serca2b agonist CDN1163 (1 μM, 10 min). n = 6 (2.8 mM Glu), or 5 (16.8 mM Glu) biologically independent cell samples. c IPGTTs of vehicle- (n = 8 mice) and CDN1163-treated (6 d) male choline diet-fed (2 weeks) mice (n = 7 mice). Then, the AUC of the GTT was determined. d Plasma insulin levels at 0 and 15 min after intraperitoneal injection of glucose in vehicle- (n = 7 mice) and CDN1163-treated (19 d) male choline diet-fed (4 weeks) mice (n = 5 mice). e GSIS of primary islets from vehicle- and CDN1163-treated (40 d) male choline diet-fed (7 weeks) mice. n = 5 biologically independent islet samples. f Basal mitochondrial ROS measurement in MIN6 cells treated with (n = 44) or without (n = 29) TMAO (100 nM, 18 h). g Mitochondrial ROS measurement in MIN6 cells treated with (n = 23) or without (n = 26) TMAO (100 nM, 18 h) under 2.8 mM and 16.8 mM glucose conditions. hj p-NF-κB, NF-κB, NLRP3, ASC, cleaved caspase-1 (C-cas1), cleaved IL-1β (C- IL-1β), p-PPARγ (Ser273 phosphorylation of PPAR-γ) and Serca2 protein levels in MIN6 cells treated with or without TMAO (10 μM, 18 h) under 2.8 mM and 16.8 mM glucose conditions. n = 3 biologically independent cell samples. k, l Cleaved IL-1β (C- IL-1β) and Serca2 protein levels in MIN6 cells treated with or without TMAO (10 μM, 18 h) or MCC (1 μM, 18 h) in response to 16.8 mM glucose. n = 3 biologically independent cell samples. m Diagrammatic sketch of the mechanism by which TMAO induces Serca2 loss. Statistical significance was calculated (ah, j, l) by two-sided Student’s t-test. The data are presented as mean ± SEM. MCC, MCC950 sodium; mtROS, mitochondrial reactive oxygen species. Source data are provided as a Source Data file.
Fig. 6
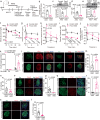
Fig. 6. TMAO promoted β-cell dedifferentiation and apoptosis and blocked β-cell transcriptional identity.
a, b Immunofluorescence of insulin (green), Sox9 (red) and DAPI (blue) in male chow- and choline diet-fed mice (a). Then, the % Sox9+/Ins+ area was measured (b). n = 10. Scale bar, 20 μm. c Sox9 mRNA levels in MIN6 cells treated with and without TMAO (100 nM, 9 d). n = 6 biologically independent cell samples. d Sox9 protein levels in MIN6 cells treated with and without TMAO (100 nM, 9 d) as well as HG (35 mM glucose, 9 d). n = 3 biologically independent cell samples. e Sox9 protein levels in male mouse primary islets treated with and without TMAO (100 nM, 9 d). n = 4 biologically independent cell samples. f, g Immunofluorescence of insulin (green), Pdx1 (red) and DAPI (blue) in male chow- and choline diet-fed mice (f). Then, the % Pdx1+/Ins+ area was measured (g). n = 8. Scale bar, 10 μm. h, i β-cell markers mRNA levels in MIN6 cells and Pdx1 protein levels in male mouse primary islets treated with and without TMAO (100 nM, 9 d). n = 6 (h), or 5 (i) biologically independent cell sample. j, k Immunofluorescence of insulin (green), CC3 (red) and DAPI (blue) in male chow- and choline diet-fed mice (j). This step was followed by measurements of % CC3+/Ins+ area (k). n = 12. Scale bar, 10 μm. l Protein levels of the apoptosis markers CC3 and cleaved PARP (C-PARP) in MIN6 cells treated with and without TMAO (100 nM, 9 d). n = 6 biologically independent cell samples. m Protein levels of the apoptosis marker CC3 in male mouse primary islets treated with and without TMAO (100 nM, 9 d). n = 4 biologically independent cell samples. n ER stress-related protein levels in male mouse primary islets treated with or without TMAO (100 nM, 9 d). n = 5 biologically independent cell samples. o Diagrammatic sketch of the inhibitory effect of TMAO on β-cell maintenance. Statistical significance was calculated (be, g–i, kn) by two-sided Student’s t-test. The data are presented as mean ± SEM. Mice: C57BL/6 J, choline diet fed for 13 weeks from 8 weeks old (a, b, f, g, j, k); C57BL/6 J, 15 weeks old (e, i, m, n). Source data are provided as a Source Data file.
Fig. 7
Fig. 7. Deficiency of Fmo3 improved β-cell function, β-cell loss and glucose homeostasis in db/db mice.
a Schematic diagram of tests during ASO injection. b, c Hepatic Fmo3 mRNA and protein levels after 10 weeks of ASO treatment in male db/db mice. n = 5 (b), or 4 (c) mice. d Plasma TMAO concentration after 4 weeks of ASO treatment in male db/db mice. n = 10 mice. e Serca2 protein levels in primary islets from ASO-treated (6 weeks) male db/db mice. n = 3 mice. f IVGTTs after 6 weeks of ASO treatment in male db/db mice. n = 9 mice. g, h Plasma insulin (g) and increase in plasma insulin (%, h) during IVGTT. n = 7 (control ASO), or n = 6 (Fmo3 ASO) mice. i, j C-peptide (i) and increase in C-peptide (%, j) during IVGTT. n = 7 mice. k GSIS in primary islets after 10 weeks of ASO treatment in male db/db mice. n = 4 (control ASO at 2.8 mM Glu), 5 (Fmo3 ASO at 2.8 mM Glu), 6 (control ASO at 16.8 mM Glu), or 8 (Fmo3 ASO at 16.8 mM Glu) biologically independent islet samples. ln Immunofluorescence of insulin (green), glucagon (red) and DAPI (blue) in male control and Fmo3 ASO-treated db/db mice (l). This step was followed by measurements of % β-cell area (m) and % α cell area (n). n = 10 mice. Scale bar, 50 μm. ot Immunofluorescence for insulin (green; o, q, s), Sox9 (red; o), Pdx1 (red; q), CC3 (red; s) and DAPI (blue; o, q, s) in male control and Fmo3 ASO-treated db/db mice. This step was followed by measurements of the % Sox9+/Ins+ area (p), % Pdx1+/Ins+ area (r), % CC3+/Ins+ area (t). n = 13 (control ASO), or 8 (Fmo3 ASO) (p); n = 9 (control ASO), or 12 (Fmo3 ASO) (r); n = 10 (t). Scale bar, 10 μm (o), or 20 μm (q, s). Statistical significance was calculated (b–i, k, m, n, p, r, t) by two-sided Student’s t-test. The data are presented as mean ± SEM. Mice: db/db, ASO treatment (50 mg/kg body weight) from 6 weeks old (at). ASO, antisense oligonucleotides. Source data are provided as a Source Data file.

References

    1. Ferrannini E. The stunned beta cell: a brief history. Cell Metab. 2010;11:349–352. doi: 10.1016/j.cmet.2010.04.009. - DOI - PubMed
    1. Kasuga M. Insulin resistance and pancreatic beta cell failure. J. Clin. Invest. 2006;116:1756–1760. doi: 10.1172/JCI29189. - DOI - PMC - PubMed
    1. Muoio DM, Newgard CB. Mechanisms of disease: molecular and metabolic mechanisms of insulin resistance and beta-cell failure in type 2 diabetes. Nat. Rev. Mol. Cell Biol. 2008;9:193–205. doi: 10.1038/nrm2327. - DOI - PubMed
    1. DeFronzo RA, Abdul-Ghani MA. Preservation of β-cell function: the key to diabetes prevention. J. Clin. Endocrinol. Metab. 2011;96:2354–2366. doi: 10.1210/jc.2011-0246. - DOI - PubMed
    1. Porte D., Jr. β-cells in type II diabetes mellitus. Diabetes. 1991;40:166–180. doi: 10.2337/diab.40.2.166. - DOI - PubMed