. 2024 Mar 21;15(1):2547.
doi: 10.1038/s41467-024-46868-7.

Focal adhesions contain three specialized actin nanoscale layers

Affiliations

Focal adhesions contain three specialized actin nanoscale layers

Reena Kumari et al. Nat Commun. .

Abstract

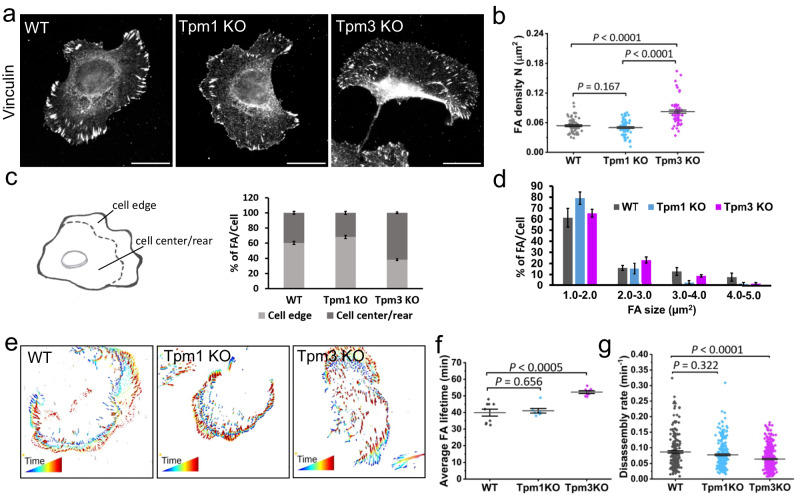
Focal adhesions (FAs) connect inner workings of cell to the extracellular matrix to control cell adhesion, migration and mechanosensing. Previous studies demonstrated that FAs contain three vertical layers, which connect extracellular matrix to the cytoskeleton. By using super-resolution iPALM microscopy, we identify two additional nanoscale layers within FAs, specified by actin filaments bound to tropomyosin isoforms Tpm1.6 and Tpm3.2. The Tpm1.6-actin filaments, beneath the previously identified α-actinin cross-linked actin filaments, appear critical for adhesion maturation and controlled cell motility, whereas the adjacent Tpm3.2-actin filament layer beneath seems to facilitate adhesion disassembly. Mechanistically, Tpm3.2 stabilizes ACF-7/MACF1 and KANK-family proteins at adhesions, and hence targets microtubule plus-ends to FAs to catalyse their disassembly. Tpm3.2 depletion leads to disorganized microtubule network, abnormally stable FAs, and defects in tail retraction during migration. Thus, FAs are composed of distinct actin filament layers, and each may have specific roles in coupling adhesions to the cytoskeleton, or in controlling adhesion dynamics.


Conflict of interest statement

The authors declare no competing interests.

Figures

Fig. 1
Fig. 1. Tropomyosin-1.6 and tropomyosin-3.2 are early components of focal adhesions.
a Representative TIRF images of wild-type U2OS cells expressing pmRuby2C1-Tpm1.6 and pEGFPC1-Tpm3.2, and stained for endogenous paxillin. The panels at the bottom are magnified images of the regions indicated with dashed boxes highlighting the localization of Tpm1.6 and Tpm3.2 in focal adhesions. Scale bars, 20 µm and 5 µm in upper and bottom rows, respectively. Experiments were repeated three times. b Line scan intensity profiles across the focal adhesion (from panel ‘a’). c Schematic representation of lateral localizations of Tpm1.6 and Tpm3.2 from the proximal to distal end of focal adhesions (see also Supplementary Fig. 1b). Created with BioRender.com. d TIRF image from a time-lapse movie of a wild-type U2OS expressing miRFP670-Paxillin, pEGFPC1-Tpm1.6 and pmRuby2C1-Tpm3.2. Scale bar, 50 µm. Experiment was repeated three times. e Individual channels of selected time-lapse frames from the magnified region (indicated by a white box in ‘d’). Black dotted lines indicate the cell edge. Green, purple and yellow arrows highlight the timing of paxillin, Tpm1.6 and Tpm3.2 accumulation to the focal adhesion, respectively. f Intensity profile analysis (n = 5 adhesions), demonstrating that paxillin intensity gradually increases in adhesions, whereas Tpm1.6 and Tpm3.2 intensities typically increase at focal adhesions more rapidly. However, the intensity dynamics of Tpm1.6 and Tpm3.2 are rather complex, and displayed substantial variation between different adhesions analyzed. The graph represents mean ± SE. g 3D-top view (image orientation from dorsal plane) and 3D-bottom view (image orientation from ventral plane) of rendered iPALM images of Tpm1.6 and Tpm3.2 from Supplementary Movie 2. The images were obtained by using ‘3D viewer’ plugin from FIJI/ImageJ. Note the enrichment of Tpm1.6 at the dorsal side (in top-view) and enrichment of Tpm3.2 at the ventral side (in bottom-view). The color-coding in the graph from red to purple shade represents the Z-depth from the coverslip (0 nm) towards the top of the focal adhesion (250 nm).
Fig. 2
Fig. 2. Tropomyosin-1.6 and tropomyosin-3.2 actin filament arrays form specific nanoscale layers in focal adhesions.
ae XY views and side views (indicated by white boxes in XY-view panels) from iPALM images of focal adhesions of U2OS cells. a Endogenous paxillin, b mEos3.2-Tpm3.2 (c) mEos3.2-Tpm1.6, (d) mEos3.2-α-actinin, and (e) endogenous actin detected with phalloidin. Scale bars, 5 µm. f Vertical stratification of focal adhesions located at the leading edge of the cell showing the Z-positions (Zcenter +/− 1.5*IQR) of paxillin, Tpm3.2, Tpm1.6 and α-actinin, and F-actin. Each point in the graph corresponds to an individual focal adhesion measurement. Boxes display the mean, median, Whiskers, IQR: 25th–75th percentiles, Whiskers range within 1.5*IQR. Please, see Supplementary Table 1 for iPALM statistics. g Schematic model of the molecular 3D architecture of a focal adhesion displaying the localizations of three ‘actin filament layers’ in the nanoscale strata. The positioning of each protein is based on the data presented in (af). The model does not depict the protein stoichiometry. Created with BioRender.com.
Fig. 3
Fig. 3. Effects of tropomyosin-1 and tropomyosin-3 depletions on cell morphology, force production, migration, and the actin cytoskeleton.
a Representative wide-field images of wild-type, Tpm1 knockout, and Tpm3 knockout U2OS cells stained for F-actin (phalloidin) illustrating the morphological differences between the Tpm1 knockout and Tpm3 knockout cells. The arrows highlight the abnormal tails of the Tpm3 knockout cells. Scale bars, 20 µm. b Representative wide-field images of wild-type, Tpm1 knockout, and Tpm3 knockout cells stained for F-actin (phalloidin), demonstrating defects in the stress fiber networks of the Tpm1 knockout and Tpm3 knockout cells. Scale bars, 20 µm. c Cell circularity analysis of wild-type (n = 42), Tpm1 knockout; clone 1 (C1) (n = 44) clone 2 (C2) (n = 45), and Tpm3 knockout; clone 2 (C2) (n = 37) clone 11 (C11) (n = 38) cells after 90 min of plating. The data represents mean ± SE. The exact p-values (one-way ANOVA followed by Turkey multiple comparison test): p = 0.058; 0.00000003; 0.0000010. d Representative traction force maps of wild-type, Tpm1 knockout and Tpm3 knockout cells plated on 9.6 kPa hydrogels coated with fibronectin. Scale bar 20 µm. e Mean traction (per cell) of wild-type (n = 43), Tpm1KO (n = 41) and Tpm3KO (n = 42) cells on 9.6 kPa hydrogels coated with fibronectin. The data represents mean ± SE. The exact p-values (two-tailed Student’s t test): p = 0.000015; 0.0000035; 0.14. f Random migration trajectory maps of wild-type, Tpm1 knockout, Tpm3 knockout cells plated on fibronectin-coated substrate. Please, note the differences in the scales of x- and y-axes between wild-type, Tpm1 and Tpm3 panels. g, h Analysis of random migration rates and cell directionality of wild type (n = 30), Tpm1 knockout; clone 1 (C1) (n = 42) clone 2 (C2) (n = 27), and Tpm3 knockout; clone 2 (c2) (n = 55) clone 11 (C11) (n = 34) cells. The data represents mean ± SE. The exact p-values (one-way ANOVA followed by Turkey multiple comparison test) are provided in the Source data.
Fig. 4
Fig. 4. Depletions of tropomyosin-1 and tropomyosin-3 result in opposite effects on focal adhesion distribution and dynamics.
a Representative wide-field images of wild-type, Tpm1 knockout, and Tpm3 knockout U2OS cells plated on fibronectin-coated coverslips and stained for focal adhesions (vinculin antibody). Scale bars, 20 µm. b Focal adhesion density analysis from wild-type (n = 70), Tpm1 knockout (n = 62), and Tpm3 knockout (n = 63) cells. The data represents mean ± SE. The exact p-values (two-tailed Student’s t test) are provided in the Source data. c Distributions of focal adhesions at the cell edge (within 5 μm from the leading edge) vs. cell centre/rear. Quantification of the percentage of focal adhesions located in these regions in wild-type (n = 30), Tpm1 knockout (n = 30) and Tpm3 knockout (n = 25) cells are shown in the graph. The data represents mean ± SE. d Quantification of the size distributions of focal adhesions in wild-type (n = 30), Tpm1 knockout (n = 30) and Tpm3 knockout (n = 25) cells. The data represents mean ± SE. e Representative examples of temporal color-coded TIRF microscopy time-lapse movies of miRF670-Paxillin expressing cells depicting the dynamic mode of focal adhesions (generated from FAAS). f Quantitative analysis of average focal adhesion lifetimes from TIRF microscopy time-lapse movies of miRFP670-Paxillin expressing wild-type (n = 9 cells), Tpm1 knockout (n = 7 cells), and Tpm3 knockout (n = 8 cells) cells. The data represents mean ± SE. The exact p-values (two-tailed Student’s t test): p = 0.656; 0.00023. g Analysis of focal adhesion disassembly rates calculated from TIRF microscopy time-lapse movies of miRFP670-Paxillin expressing cells by using FAAS. Wild-type (n = 9 cells), Tpm1 knockout (n = 7 cells), and Tpm3 knockout (n = 8 cells). The data represents mean ± SE. The exact p values (Mann-Whitney test): p = 0.322; 0.0000061.
Fig. 5
Fig. 5. Tpm3 is critical for proper microtubule organization and focal adhesion targeting.
a Wide-field images of wild-type and Tpm3 knockout U2OS cells stained for F-actin (phalloidin) and microtubules (α-tubulin antibody). The panels on the right are magnified images of the regions at the cell periphery indicated with black boxes in the whole cell images. Scale bars, 10 µm and 5 µm, respectively. Experiments were repeated three times. b Blinded analysis of the percentage of cells displaying aligned, intermediate and tangled microtubule networks in wild-type (n = 219) and Tpm3 knockout (n = 344) cells. The data are from three independent experiments and represent mean ± SE. c TIRF microscopy images of wild-type U2OS and Tpm3KO cells expressing miRFP670-Paxillin and GFP-α-tubulin demonstrating diminished targeting of microtubules to focal adhesions. Scale bars, 5 µm. d Wide-field images of wild-type and Tpm3 knockout U2OS cells stained for microtubules plus-end tracking protein EB1. The panels on the right (1-4) are magnified images of the regions indicated with black boxes in the whole cell images. Scale bars, 10 µm 5 µm, respectively. Experiments were repeated three times. e TIRF time-lapse images of wild-type and Tpm3 knockout cells expressing EGFP-EB1 and miRFP670-Paxillin. Selected time-lapse frames from the magnified areas (indicated by white boxes) are shown on the right as merged frames. Yellow arrows highlight the point of initial contact of EB1 with focal adhesions. Scale bars, 5 µm and 1 µm, respectively. f Analysis of the EB1 resident times in focal adhesions analysed from TIRF time-lapse movies of cells expressing EGFP-EB1 and miRFP670-Paxillin. Wild-type (n = 40 EB1 foci from 5 movies) and Tpm3 knockout (n = 26 EB1 foci from 5 movies) cells. The data represents mean ± SE. The exact p-value (two-tailed Student’s t-test): p = 0.000015. g Schematic representation of the organization of microtubule plus-ends in wild-type and in Tpm3 knockout cells based on the data presented here.
Fig. 6
Fig. 6. Tropomyosin-3 regulates microtubule – focal adhesion interactions by stabilizing KANK at focal adhesions.
a TIRF images of wild-type and Tpm3 knockout cells stained for endogenous KANK2 and talin. The panels to the right are magnified images of the regions indicated with white boxes in the whole cell images. Scale bars, 10 µm and 5 µm, respectively. The intensity line scans on the right are from the selected adhesion regions demonstrating compromised localization of KANK2 at the rim of the focal adhesions in Tpm3 knockout cells. b Quantification of the mean intensity of endogenous KANK2 in talin positive FAs in cells plated on fibronectin-coated surface (n = 1036 adhesions for wild-type, and n = 855 adhesions for Tpm3 knockout cells). The data represent mean ± SE. The exact p value (two-tailed Student’s t-test) is provided in the Source data. Please note that the KANK2 intensity in FAs was compared to a randomly-selected adhesion-free area of the cytoplasm from the same cell, and thus the KANK2 intensity values of a subset of adhesions, especially in the Tpm3 knockout cells, were negative. c Representative examples of GFP-KANK1 time-lapse images (from the FRAP experiment) from wild-type and in Tpm3 knockout cells. Scale bars, 10 µm. The panels below are magnified images of the regions indicated with white boxes, and represent selected time-frames of the FRAP experiments. The time-point ‘Pre’ is a frame before bleaching and ‘0 s’ is the first frame after bleaching. The white boxes indicate the bleached regions. Scale bars, 5 µm. d Quantification of the fluorescence recovery of GFP-KANK1 and GFP-KN-L1 in FAs of wild-type and Tpm3 knockout cells. Graph shows mean curves ± S.E.M. over time. The measurements are from (n = 29 adhesions for KANK1 from 7 movies, n = 21 adhesions for KN-L1 from 6 movies) wild-type and (n = 38 adhesions for KANK1 from 6 movies, n = 21 adhesions for KN-L1 from 9 movies) Tpm3 knockout cells.
Fig. 7
Fig. 7. Tropomyosin-3 regulates microtubule – focal adhesion interactions by stabilizing ACF7 at focal adhesions.
a TIRF images of wild-type, Tpm1 knockout, and Tpm3 knockout cells stained for endogenous vinculin and ACF7. Scale bars, 20 μm. b Quantification of ACF7 mean intensity in vinculin-positive adhesions from cells plated on fibronectin coated surface (n = 285 adhesions from 12 wild-type cells, n = 225 adhesions from 18 Tpm1 knockout cells, and n = 298 adhesions from 22 Tpm3 knockout cells). The data represent mean ± SE. The exact p-values (two-tailed Student’s t test) are provided in the Source data. c Co-sedimentation assay to measure binding of ACF7(73-306) fragment to bare β/γ-actin filaments, and to β/γ-actin filaments saturated with Tpm1.6, Tpm3.2, or α-actinin-4. The concentration of ACF7(73-306) was 1 µM. The amounts (µM) ACF7(73-306) in the pellet fractions (y-axis) in respect to concentration (µM) of actin (x-axis) are shown. Values = mean; error bars ± S.E.M (n = 3). d Schematic representation of polarized wild-type, Tpm1 knockout and Tpm3 knockout cells, displaying the spatial organization of focal adhesions (black), actin (orange) and microtubule networks (green). Tpm1 depletion leads to defects in focal adhesion maturation, whereas Tpm3 depletion results in defective targeting of microtubules to focal adhesions, and accompanied problems in adhesion disassembly and tail retraction during cell migration. e Schematic representation of microtubule-dependent FA disassembly in wild-type cells, where we propose that Tpm3.2-actin filaments (green) close to the bottom of adhesion stabilize KANK (orange) and ACF7, along with cortical microtubule stabilizing complex (CMSC), at adhesions. Thus, Tpm3.2-actin filaments may facilitate targeting of microtubule (MT, yellow) plus-ends to the adhesion. In the absence of Tpm3.2, ACF7 does not accumulate to FAs and stable association of KANK and cortical microtubule stabilizing complex (CMSC) components is lost at adhesions. This results in defective targeting of microtubule plus-end to the adhesion.

References

    1. Revach OY, Grosheva I, Geiger B. Biomechanical regulation of focal adhesion and invadopodia formation. J. Cell Sci. 2020;133:jcs244848. doi: 10.1242/jcs.244848. - DOI - PubMed
    1. Kanchanawong P, Calderwood DA. Organization, dynamics and mechanoregulation of integrin-mediated cell–ECM adhesions. Nat. Rev. Mol. Cell Biol. 2022;24:142–161. doi: 10.1038/s41580-022-00531-5. - DOI - PMC - PubMed
    1. Kanchanawong P, et al. Nanoscale architecture of integrin-based cell adhesions. Nature. 2010;468:580–584. doi: 10.1038/nature09621. - DOI - PMC - PubMed
    1. Liu J, et al. Talin determines the nanoscale architecture of focal adhesions. Proc. Natl Acad. Sci. USA. 2015;112:E4864–E4873. doi: 10.1073/pnas.1512025112. - DOI - PMC - PubMed
    1. Case LB, Waterman CM. Integration of actin dynamics and cell adhesion by a three-dimensional, mechanosensitive molecular clutch. Nat. Cell Biol. 2015;17:955–963. doi: 10.1038/ncb3191. - DOI - PMC - PubMed

MeSH terms