. 2024 Jun;38(6):1353-1364.
doi: 10.1038/s41375-024-02228-4. Epub 2024 Mar 21.

Impaired binding affinity of YTHDC1 with METTL3/METTL14 results in R-loop accumulation in myelodysplastic neoplasms with DDX41 mutation

Affiliations

Impaired binding affinity of YTHDC1 with METTL3/METTL14 results in R-loop accumulation in myelodysplastic neoplasms with DDX41 mutation

Won Chan Hwang et al. Leukemia. 2024 Jun.

Abstract

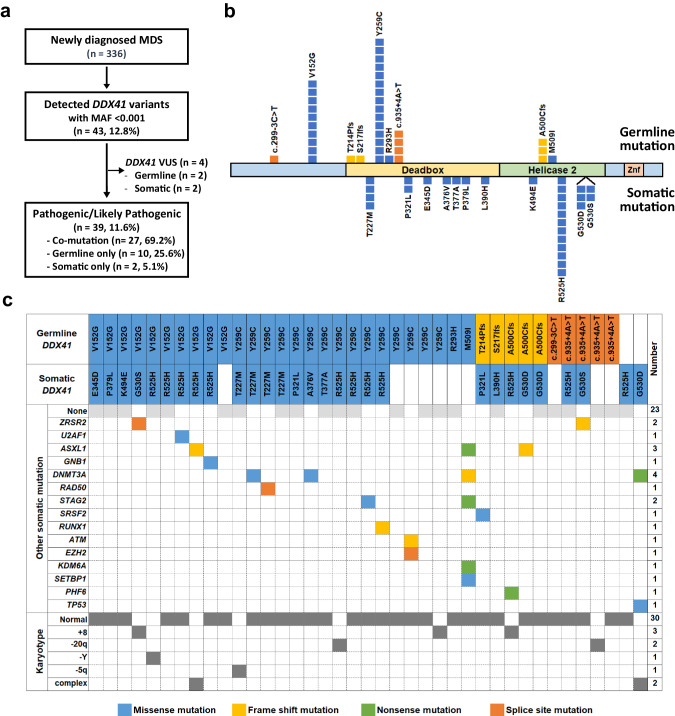
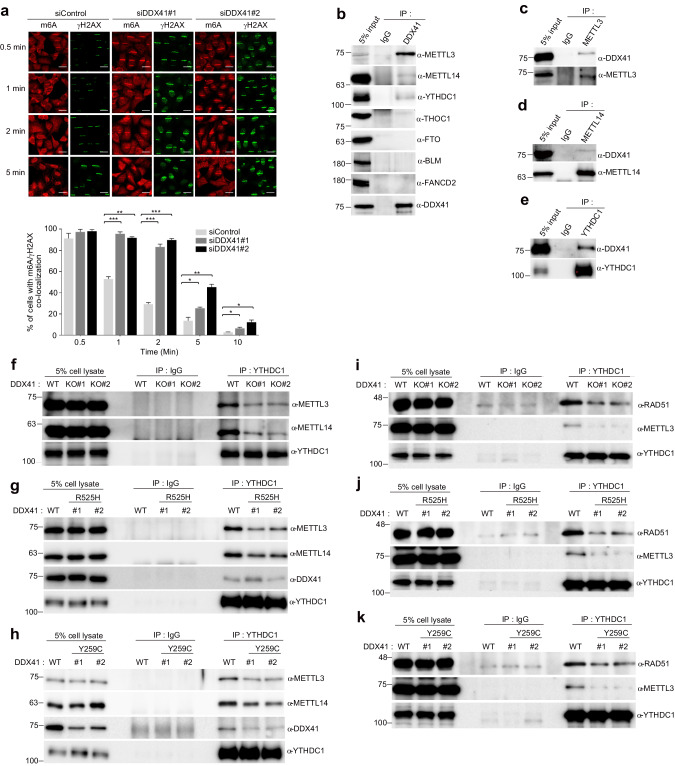
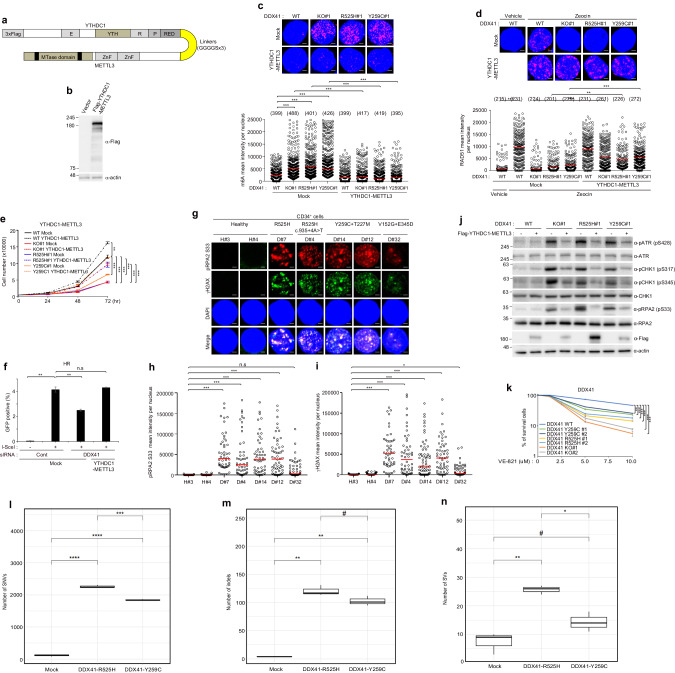
DEAD box helicase 41 (DDX41) mutations are the most prevalent predisposition to familial myelodysplastic syndrome (MDS). However, the precise roles of these variants in the pathogenesis of MDS have yet to be elucidated. Here, we discovered a novel mechanism by which DDX41 contributes to R-loop-induced DNA damage responses (DDR) in cooperation with the m6A-METTL complex (MAC) and YTHDC1 using DDX41 knockout (KO) and DDX41 knock-in (KI, R525H, Y259C) cell lines as well as primary samples from MDS patients. Compared to wild type (WT), DDX41 KO and KI led to increased levels of m6A RNA methylated R-loop. Interestingly, we found that DDX41 regulates m6A/R-loop levels by interacting with MAC components. Further, DDX41 promoted the recruitment of YTHDC1 to R-loops by promoting the binding between METTL3 and YTHDC1, which was dysregulated in DDX41-deficient cells, contributing to genomic instability. Collectively, we demonstrated that DDX41 plays a key role in the physiological control of R-loops in cooperation with MAC and YTHDC1. These findings provide novel insights into how defects in DDX41 influence MDS pathogenesis and suggest potential therapeutic targets for the treatment of MDS.


Conflict of interest statement

The authors declare no competing interests.

Figures

Fig. 1
Fig. 1. Concurrent mutations and distribution of mutations in Korean MDS patients with DDX41 mutations.
a Flow diagram of DDX41 variants identified in the present study. b Graphical representation of the location of germline and somatic DDX41 mutations identified in the present study against the corresponding DDX41 protein sequence and major functional domains. c Germline and somatic DDX41 mutations, concomitant other recurrent mutations, and karyotypes.
Fig. 2
Fig. 2. Increased methylated R-loops DDX41 mutant MDS patients’ bone marrow samples.
ac S9.6 and m6A fluorescence intensities in CD34+ cells isolated from the BM of healthy controls or MDS patients. CD34+ cells were treated with PBS or recombinant RNase H1. After 1 h, m6A and S9.6 intensities were determined by immunofluorescence (a). We counted 45 cells from patient D#35, 34 cells from patient D#7, 46 cells from D#4, 23 cells from patient D#2, 43 cells from patient D#15, 46 cells from patient D#14, 31 cells from patient D#12, and 46 cells from patient D#32. Scale bar, 1 μm. b, c Panels represent healthy cells (n = 5; 280 cells), cells with DDX41 mutations (n = 8; 314 cells), cells with other mutations (n = 3; 150 cells), cells with no mutations (n = 4; 200 cells), and cells with U2AF1 mutations (n = 4; 200 cells). Mean fluorescence intensities per nucleus CD34+ cells for S9.6 (b) and m6A (c). Results are presented as the average of three independent experiments. Error bars indicate standard deviation. P-value was calculated based on one-way ANOVA in (b) and (c) (*P < 0.05, **P < 0.01 and ***P < 0.001. n.s. non-significant).
Fig. 3
Fig. 3. Increased methylated R-loops in DDX41 mutant cell lines.
a Quantification of m6A fluorescence intensity was determined by immunofluorescence staining with m6A antibodies in DDX41 WT and KO K562 cells. b m6A dot-blot analysis of DDX41 WT and KO K562 cells. c m6A intensity was reduced in DDX41 KO K562 cells over-expressing RNase H1. DDX41 WT and KI K562 cells were transfected with GFP or GFP-RNase H1 expression plasmids. After 48 h, m6A intensity was determined by immunofluorescence. Transfected cells were fixed and stained with m6A antibody. d Quantification of m6A fluorescence intensity was determined by immunofluorescence staining with m6A antibodies in DDX41 WT and KI K562 cells. e m6A intensity was reduced in DDX41 KI K562 cells over-expressing RNase H1. DDX41 WT and KI K562 cells were transfected with GFP or GFP-RNase H1 expression plasmids. After 48 h, m6A intensity was determined by immunofluorescence. Transfected cells were fixed and stained with m6A antibody. f, g DDX41 WT, KO, and KI K562 cells were transfected with Mock or Myc-DDX41 expression plasmids. After 72 h, m6A (f) intensity was determined by immunofluorescence. Transfected cells were fixed and stained with m6A antibodies. The numbers above each sample indicate the n value, which is the number of nuclei analyzed. g Viability of transfected cells. 5000 cells were plated, and the number of viable cells was counted at indicated time points. Results are presented as the average of three independent experiments. Error bars indicate standard deviation. P-value was calculated based on ordinary one-way ANOVA in (a, cf), two-way ANOVA in (g) (**P < 0.01, ***P < 0.001). Scale bar, 5 μm.
Fig. 4
Fig. 4. DDX41 translocates to DNA damage sites by binding to R-loops independently of m6A methylation.
a The translocation of DDX41 to DNA damage sites. HeLa cells expressing GFP-DDX41 were subjected to laser microirradiation. Laser stripes were examined at the indicated time points. Scale bar, 5 μm. b HeLa cells expressing GFP-DDX41 were subjected to laser microirradiation. After 10 min, cells were fixed and stained with anti-GFP and anti-γH2AX antibodies. 4,6-diamidino-2-phenylindole (DAPI) was used to stain nuclei. Scale bar, 5 μm. c HeLa cells expressing GFP-DDX41 were subjected to laser microirradiation. After 10 min, cells were fixed and stained with anti-GFP and anti-m6A antibodies. 4,6-diamidino-2-phenylindole (DAPI) was used to stain nuclei. Scale bar, 5 μm. d Quantification of DDX41-ΔHel-WT EMSA with various DNA substrates. DDX41-ΔHel-WT (0, 80, 160, 325, 650, and 1300 nM) was titrated to 10 nM of DNA or DNA-RNA hybrid substrates. The bound fraction was calculated as the intensity of the bound band divided by the total intensity of all bands. e EMSA gel image for DDX41-ΔHel-WT binding to R-loop substrates. DDX41-ΔHel-WT (0, 80, 160, 325, 650, and 1300 nM) was titrated to 10 nM of R-loop substrates. f Quantification of DDX41-ΔHel-WT EMSA results with m6A R-loops and unmodified R-loop substrates. DDX41-ΔHel-WT (0, 80, 160, 325, 650, and 1300 nM) was titrated to 10 nM of DNA or DNA-RNA hybrid substrates. g Quantification of DDX41-ΔHel-Y259C EMSA results with duplex and R-loop substrates. DDX41-ΔHel-Y259C (0, 80, 160, 325, 650, and 1300 nM) was titrated to 10 nM of DNA or R-loop hybrid substrates. h Quantification of DDX41-R525H EMSA results with duplex and R-loop substrates. DDX41-R525H (0, 80, 160, 325, 650, and 1300 nM) was titrated to 10 nM of DNA or R-loop hybrid substrates. The bound fraction was calculated as the intensity of the bound band divided by the total intensity of all bands. Error bars represent the standard deviation of three independent experiments.
Fig. 5
Fig. 5. DDX41 binds to YTHDC1, METTL3, and METTL14.
a m6A fluorescence intensity at DNA damage sites was reduced in DDX41 knockdown HeLa cells. HeLa cells transfected with control or DDX41 siRNA were subjected to laser microirradiation. After the indicated durations, cells were fixed and stained with anti-m6A and anti-γH2AX antibodies. The remaining efficacy of m6A in DNA damage site represented the percentage of co-localizing with γH2AX-positive damage sites in cells. Data are presented as the mean ± SEM of three independent experiments. P-value was calculated based on one-way ANOVA in (a) (*P < 0.05, **P < 0.01, ***P < 0.001). Scale bar, 20 μm. be Interactions between DDX41 and R-loop factors (THOC1, BLM, FANCD2), and MACOM (METTL3, METTL14, YTHDC1, FTO). Immunoprecipitation was performed using control IgG or indicated antibodies and subjected to Western blotting using indicated antibodies. fk The interactions between YTHDC1/METTL3 or /METTL14 (fh), and YTHDC1/RAD51 or /METTL3 (ik) in DDX41 KO or KI K562 cells. Immunoprecipitation was performed using rabbit IgG or indicated antibodies and subjected to Western blotting using indicated antibodies.
Fig. 6
Fig. 6. DDX41 directly recruits YTHDC1 to DNA damage sites by mediating the interaction between METTL3 or RAD51 and YTHDC1.
a, b Mean fluorescence intensities of S9.6/RAD51/YTHDC1 were determined by immunofluorescence. DDX41 WT and KO K562 cells were treated with Vehicle (DMSO) or Zeocin. After 6 h, the cells were with fixed and stained with indicated antibodies. c, d Mean fluorescence intensities of S9.6/RAD51/YTHDC1 were determined by immunofluorescence. DDX41 WT and KI K562 cells were treated with Vehicle (DMSO) or Zeocin. After 6 h, the cells were with fixed and stained with indicated antibodies. The numbers above each sample indicate the n value, which is the number of nuclei analyzed. e, f Mean fluorescence intensities of S9.6/RAD51/YTHDC1 were determined by immunofluorescence. CD34+ cells isolated from the BM of healthy controls or MDS patients were treated with Vehicle (DMSO) or Zeocin. After 6 h, CD34+ cells were fixed and S9.6/RAD51 (e) and S9.6/YTHDC1 (f) fluorescence intensities were determined by immunofluorescence. We counted indicated cells from healthy controls #3 and patients D#7, and D#14. P-value was calculated based on one-way ANOVA in (af) (***P < 0.001). Scale bar, 5 μm (ad), 1 μm (e, f).
Fig. 7
Fig. 7. METTL3-YTHDC1 fusion protein rescues the DNA damage in DDX41 KO and KI K562 cells.
a Design of YTHDC1-METTL3 fusion proteins and schematic of fusion protein. 3 X Flag tags were conjugated to the N-terminal of protein of YTHDC1. The YTHDC1-METTL3 fusion with a 3 X 8aa linker sequence (GGGGS). b The expression validation of Mock or Flag-YTHDC1-METTL3fusion protein by western blotting. c, d DDX41 WT, KO, and KI K562 cells were transfected with Mock or YTHDC1-METTL3 expression plasmids. After 72 h, m6A (c) and RAD51 (d). The numbers above each sample indicate the n value, which is the number of nuclei analyzed. e Viability of transfected cells. The transfected 5000 cells were plated, and the number of viable cells was counted at indicated time points. Results are presented as the average of three independent experiments. Error bars indicate standard deviation. f Measurement of homologous recombination capacity in DR-GFP reporter U2OS cells. U2OS cells harboring the DR-GFP reporter were treated with the indicated siRNAs, followed by transfection with the indicated expression plasmids. Two days later, GFP expression was accessed by flow cytometry. The results represent the average of three independent experiments. The error bars indicate the standard deviation. gi CD34+ cells were fixed and pRPA2 S33 and γH2AX fluorescence intensities were determined by immunofluorescence. We counted 50 cells from healthy controls #1 and #2 and patients D#7, D#4, D#14, D#12, and D#32. j Mock or YTHDC1-METTL3 expression plasmids transfected DDX41 WT, KO and KI K562 cell lysates were immunoblotted with indicated antibodies. k Viability of WT, DDX41 KO, and DDX41 KI K562 cells following treatment with an ATR inhibitor (VE-821). 5000 cells were plated and treated with increasing concentrations of VE-821 (0, 1.25, 2.5, 5, and 10 μM). The number of cells was counted culture with VE-821 for four days. Data are presented as the mean ± SEM of three independent experiments. Scale bar, 5 μm (c, d) 1 μm (g). l The statistical significance of the differences in single nucleotide variant numbers among the K562 cells is shown in a box plot. m The statistical significance of the differences in short insertion and deletion numbers among the K562 cells is shown in a box plot. n The statistical significance of the differences in structural variation numbers among the K562 cells is shown in a box plot. P-value was calculated based on one-way ANOVA in (cf, h, i), two-way ANOVA in (k), and a Student’s t-test in (ln) (one-way ANOVA and two-way ANOVA; *P < 0.05, **P < 0.01 and ***P < 0.001. n.s. non-significant, Student’s t-test; #P < 0.1, *P < 0.05, **P < 0.01, ***P < 0.001, ****P < 0.001).

References

    1. Bejar R, Abdel-Wahab O. The importance of subclonal genetic events in MDS. Blood. 2013;122:3550–1. doi: 10.1182/blood-2013-09-527655. - DOI - PubMed
    1. Bejar R, Stevenson K, Abdel-Wahab O, Galili N, Nilsson B, Garcia-Manero G, et al. Clinical effect of point mutations in myelodysplastic syndromes. N Engl J Med. 2011;364:2496–506. doi: 10.1056/NEJMoa1013343. - DOI - PMC - PubMed
    1. Cazzola M. Myelodysplastic syndromes. N Engl J Med. 2020;383:1358–74. doi: 10.1056/NEJMra1904794. - DOI - PubMed
    1. Haferlach T, Nagata Y, Grossmann V, Okuno Y, Bacher U, Nagae G, et al. Landscape of genetic lesions in 944 patients with myelodysplastic syndromes. Leukemia. 2014;28:241–7. doi: 10.1038/leu.2013.336. - DOI - PMC - PubMed
    1. Cardoso SR, Ryan G, Walne AJ, Ellison A, Lowe R, Tummala H, et al. Germline heterozygous DDX41 variants in a subset of familial myelodysplasia and acute myeloid leukemia. Leukemia. 2016;30:2083–6. doi: 10.1038/leu.2016.124. - DOI - PMC - PubMed

MeSH terms