. 2024 Mar 21;14(1):6782.
doi: 10.1038/s41598-024-57327-0.

Pregnenolone sulfate induces transcriptional and immunoregulatory effects on T cells

Affiliations

Pregnenolone sulfate induces transcriptional and immunoregulatory effects on T cells

Yasmine El Hajj et al. Sci Rep. .

Abstract

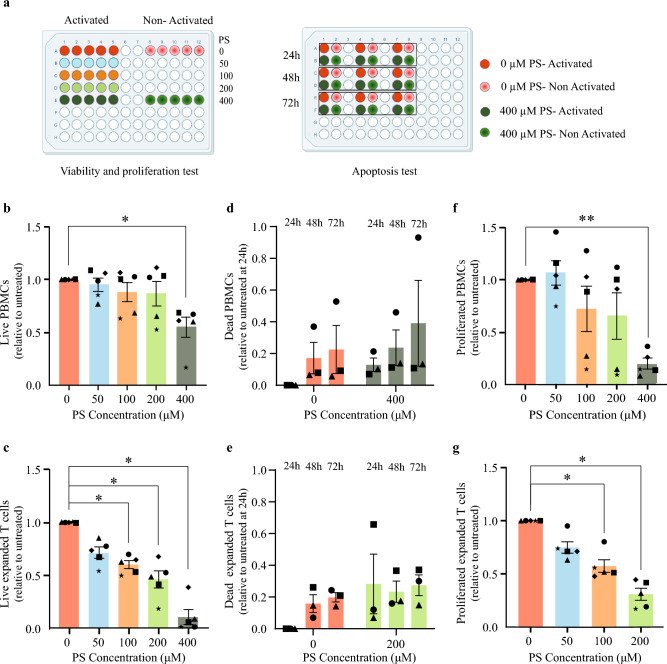
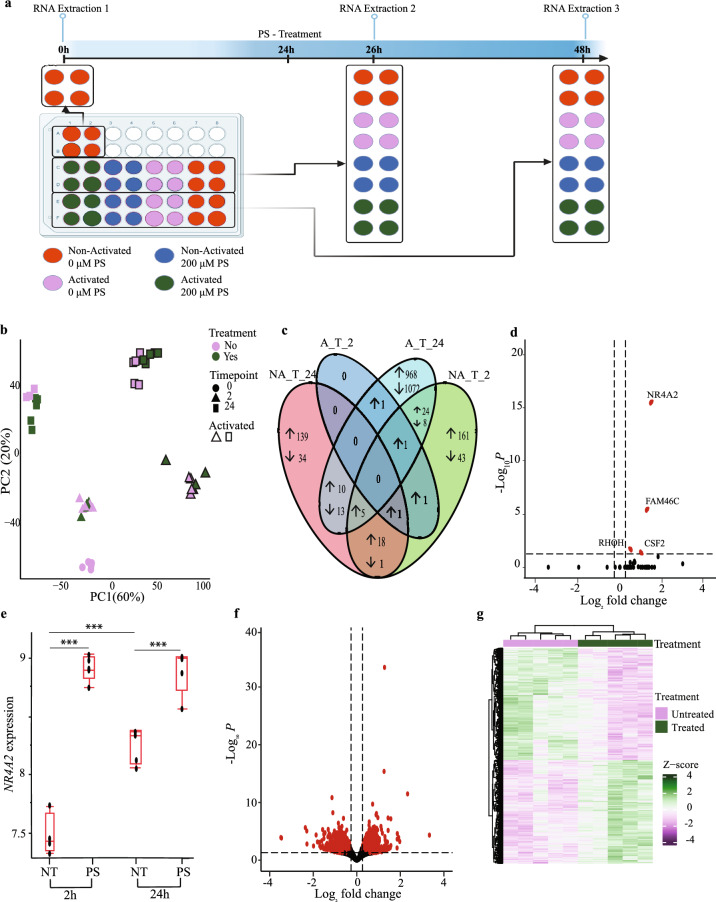
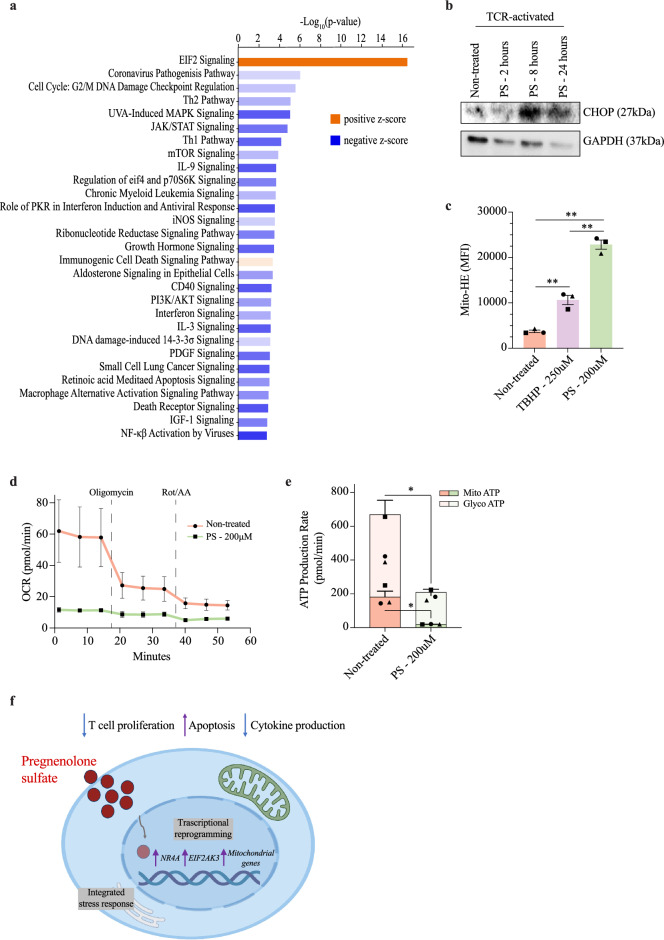
Pregnenolone sulfate is a steroid metabolite of the steroidogenesis precursor, pregnenolone, with similar functional properties, including immunosuppression. We recently reported an elevation in serum levels of pregnenolone sulfate in children with malaria, contributing to an immunosuppressed state. Yet, the molecular mechanisms in which this steroid exerts its immunoregulatory functions are lacking. In this study, we examined the effects of pregnenolone sulfate on T cell viability, proliferation and transcriptome. We observed a pregnenolone sulfate dose-dependent induction of T cell death and reduction in proliferation. RNA sequencing analysis of pregnenolone sulfate-treated T cells for 2 and 24 h revealed the downregulation of pro-inflammatory genes and the upregulation of the steroid nuclear receptor superfamily, NR4A, as early-response genes. We also report a strong activation of the integrated stress response mediated by the upregulation of EIF2AK3. These results contribute to the knowledge on transcriptional regulation driving the immunoregulatory effects of pregnenolone sulfate on T cells.


Conflict of interest statement

The authors declare no competing interests.

Figures

Figure 1
Figure 1
Effect of pregnenolone sulfate on cell viability and T cell proliferation in PBMCs and activated expanded T cells. (a) Experimental design of PBMC and expanded T-cell viability, proliferation and apoptosis assays. PBMCs and expanded T cells from 5 healthy donors were activated or non-activated with anti-CD3/anti-CD28 beads, and non-treated or treated with 50, 100, 200, or 400 μM of pregnenolone sulfate (PS) 24 h post-activation. Viability and proliferation were measured on day 6 for PBMCs and day 4 for expanded T cells post-activation. The apoptosis test was performed 24, 48, and 72 h after treatment using the same experimental design. All assays were measured using flow cytometry. Normalized bar plots showing for each of the PBMCs and expanded T cells respectively the (b,c) viability (7AAD-), (d,e) apoptosis (AnnexinV+PI-, AnnexinV+PI+, AnnexinV-PI+) and (f,g) proliferation (CFSE dye dilution) of TCR-activated cells upon treatment with the assigned concentration of pregnenolone sulfate. All recorded values plotted per donor are relative to that of the corresponding non-treated condition (and to the 24-h non-treated condition for the apoptosis test). Statistical analyses were performed using one-way ANOVA for the proliferation and viability assays, and two-way ANOVA for the apoptosis assay (*p < 0.05, **p < 0.01; otherwise, nonsignificant). Figure 1a was created using biorender.com.
Figure 2
Figure 2
The transcriptomic signature of T cells treated with pregnenolone sulfate. (a) Experimental design. RNA was extracted from TCR-activated (24 h) and non-activated, pregnenolone sulfate (PS)-treated and non-treated samples at 2 h and 24 h post-treatment. (b) PCA of the transcriptome of 44 samples. (c) Venn diagram showing the number of differentially expressed genes (DEGs) across the 4 conditions (|fold change (FC)| ≥ 1.2, Benjamini–Hochberg (B-H) false discovery rate (FDR) < 0.05). (d) Volcano plot showing DEGs as a result of pregnenolone sulfate-treatment at 2 h post-treatment in TCR-activated samples. Significant DEGs after treatment (|FC| ≥ 1.2, B-H FDR < 0.05) are shown in red. (e) Box Plots showing the VST (variance stabilizing transformation)-normalized expression levels of NR4A2 across conditions. Box plots show the median, the 25th and 75th percentiles as box edges, and the 5th and 95th percentiles as bounds of the whiskers. Two-way ANOVA test was performed and significance between treated or non-treated samples across and within time points is shown (***P adj < 0.0001). (f) Volcano plots and (g) heatmap showing DEGs upon 24 h of pregnenolone sulfate-treatment in TCR-activated samples (same statistical thresholds as in (d ). Heatmap generated in RStudio using the ComplexHeatmap package (v. 2.16.0).
Figure 3
Figure 3
Ingenuity pathway analysis of pregnenolone sulfate-induced differentially regulated genes. (a) IPA canonical signaling pathway enrichment analysis of differential expression of the pregnenolone sulfate treatment effect at the 24 h time point. The strength of inhibition or activation of each signaling pathway is shown in colors corresponding to IPA activation/inhibition z-scores. Dark orange and dark blue indicate strong activation and inhibition predictions, respectively. (b) Western blot analysis of whole-cell lysates from expanded T cells of one donor that were TCR-activated and either non-treated, or treated with 200 μM of pregnenolone sulfate (PS) for 2, 8, or 24 h, run on a gel and blotted with CHOP and GAPDH antibodies. The original blots are presented in Supplementary Figure S10 (c) Bar graph showing the mean fluorescence intensity (MFI) of the Mito-HE dye staining expanded T cells from three donors (represented by the different shapes) that were activated with CD3/CD28 beads for 24 h and either non-treated, treated with 250 μM of TBHP for 1 h or with 200 μM of PS for 2 h. (d) Extracellular flux analysis with the graph showing oxidative consumption rate of expanded T cells from three donors that were activated with CD3/CD28 beads for 24 h, followed by no treatment or treatment with 200 μM of PS for 24 h and subjected to the ATP rate test. (e) Same ATP rate test as in (d) showing the mitochondrial (dark colors) and glycolytic (light color) ATP production rate from non-treated and treated T cells (individual donors represented by different shape). Paired t-test was performed on (c) and (e); *p < 0.05, **p < 0.01, ***p < 0.001. (f) Summary illustration of the effect of pregnenolone sulfate on the T cell transcriptome and effector functions.

References

    1. Chakraborty S, Pramanik J, Mahata B. Revisiting steroidogenesis and its role in immune regulation with the advanced tools and technologies. Genes Immun. 2021;22:125–140. doi: 10.1038/s41435-021-00139-3. - DOI - PMC - PubMed
    1. Gorter SL, et al. Current evidence for the management of rheumatoid arthritis with glucocorticoids: A systematic literature review informing the EULAR recommendations for the management of rheumatoid arthritis. Ann. Rheum. Dis. 2010;69:1010–1014. doi: 10.1136/ard.2009.127332. - DOI - PubMed
    1. Barnes PJ, Adcock IM. How do corticosteroids work in asthma? Ann. Intern. Med. 2003;139:359–370. doi: 10.7326/0003-4819-139-5_Part_1-200309020-00012. - DOI - PubMed
    1. Taylor AL, Watson CJE, Bradley JA. Immunosuppressive agents in solid organ transplantation: Mechanisms of action and therapeutic efficacy. Crit. Rev. Oncol. Hematol. 2005;56:23–46. doi: 10.1016/j.critrevonc.2005.03.012. - DOI - PubMed
    1. Miller WL, Auchus RJ. The molecular biology, biochemistry, and physiology of human steroidogenesis and its disorders. Endocr. Rev. 2011;32:81–151. doi: 10.1210/er.2010-0013. - DOI - PMC - PubMed