. 2024 Mar 21;7(1):351.
doi: 10.1038/s42003-024-06017-8.

Endothelial gene regulatory elements associated with cardiopharyngeal lineage differentiation

Affiliations

Endothelial gene regulatory elements associated with cardiopharyngeal lineage differentiation

Ilaria Aurigemma et al. Commun Biol. .

Abstract

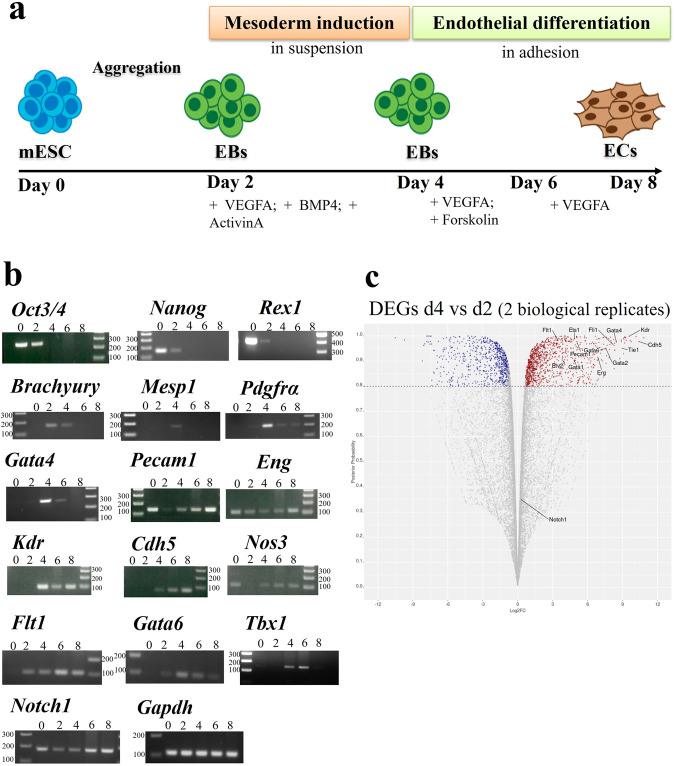
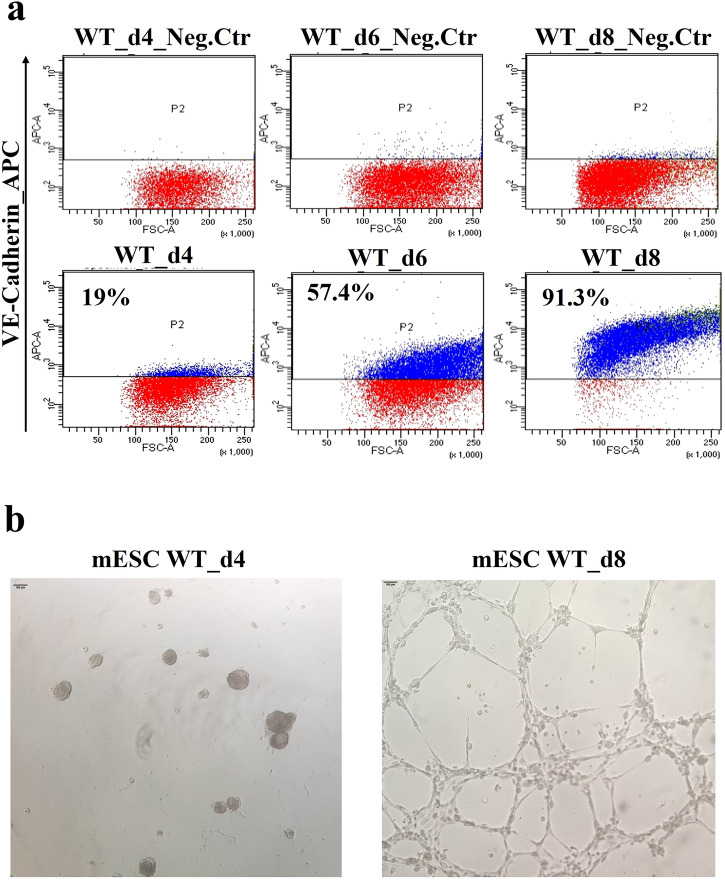
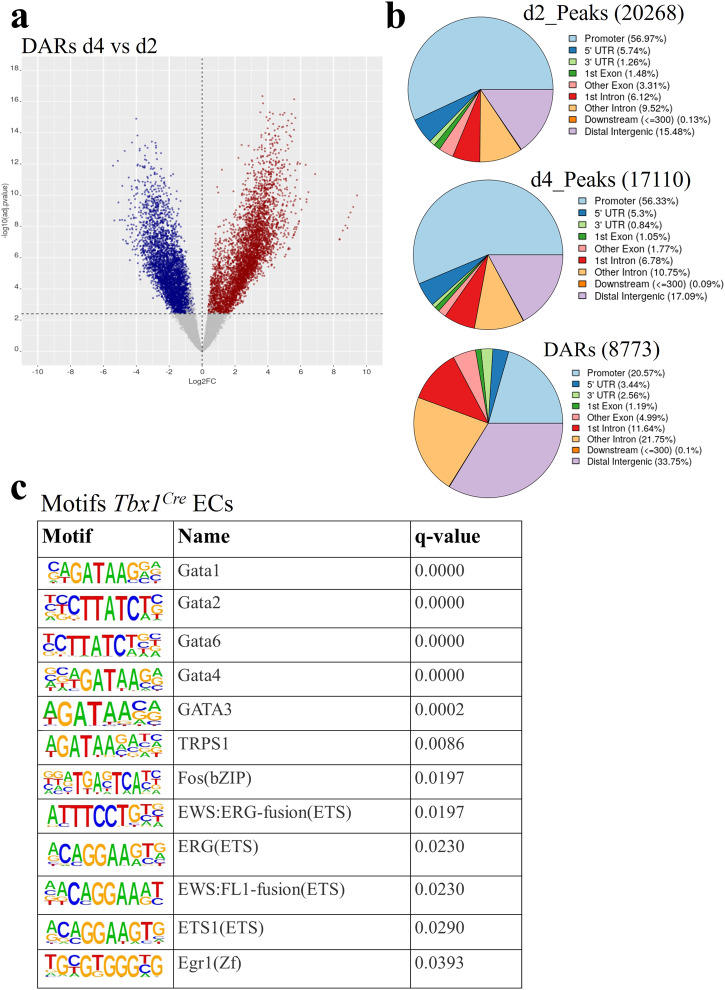
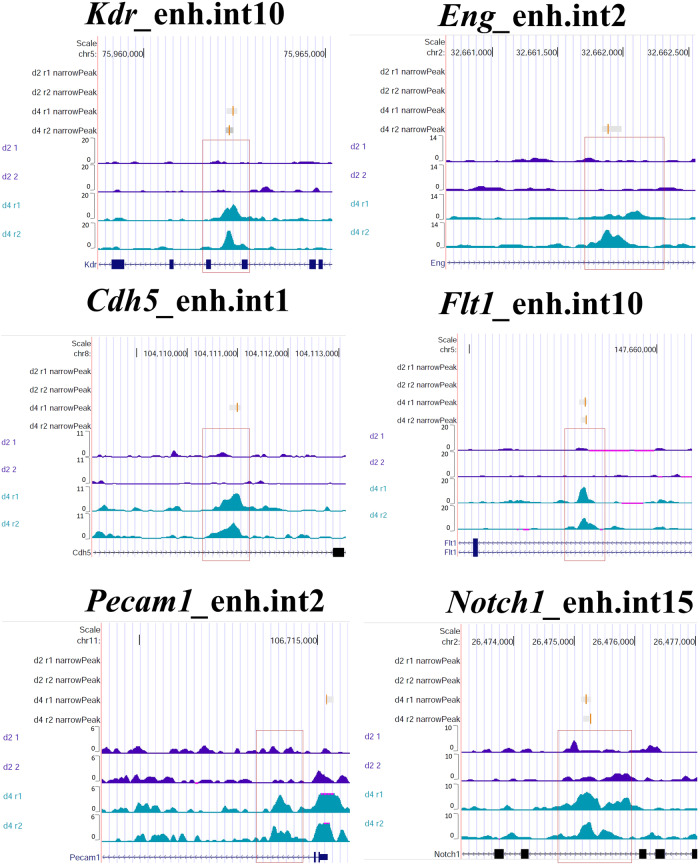
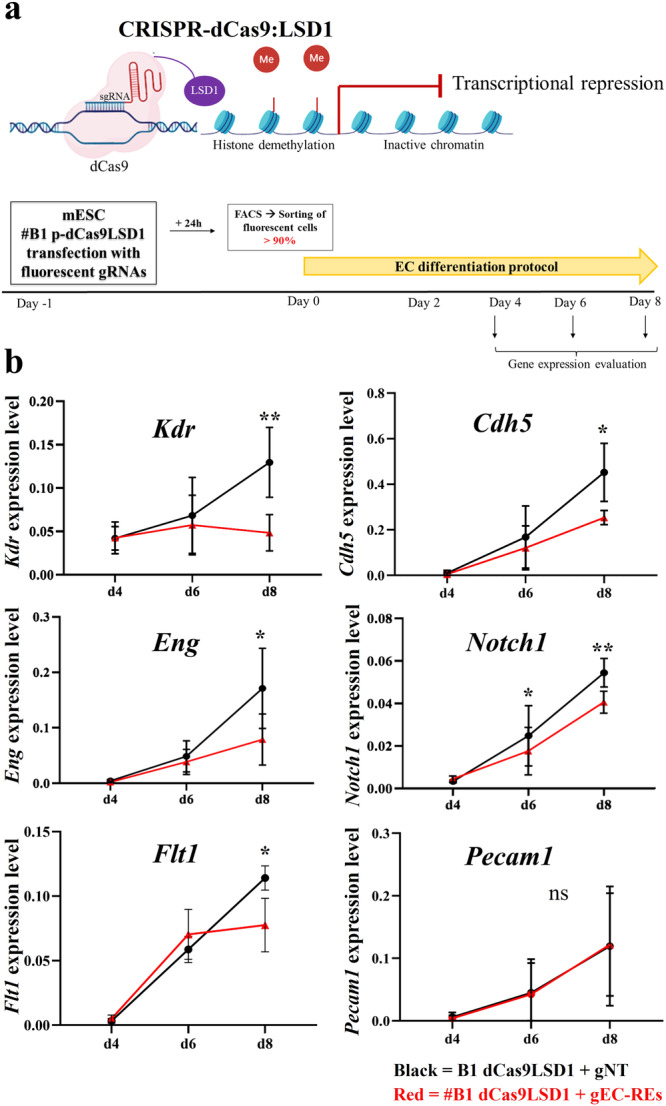
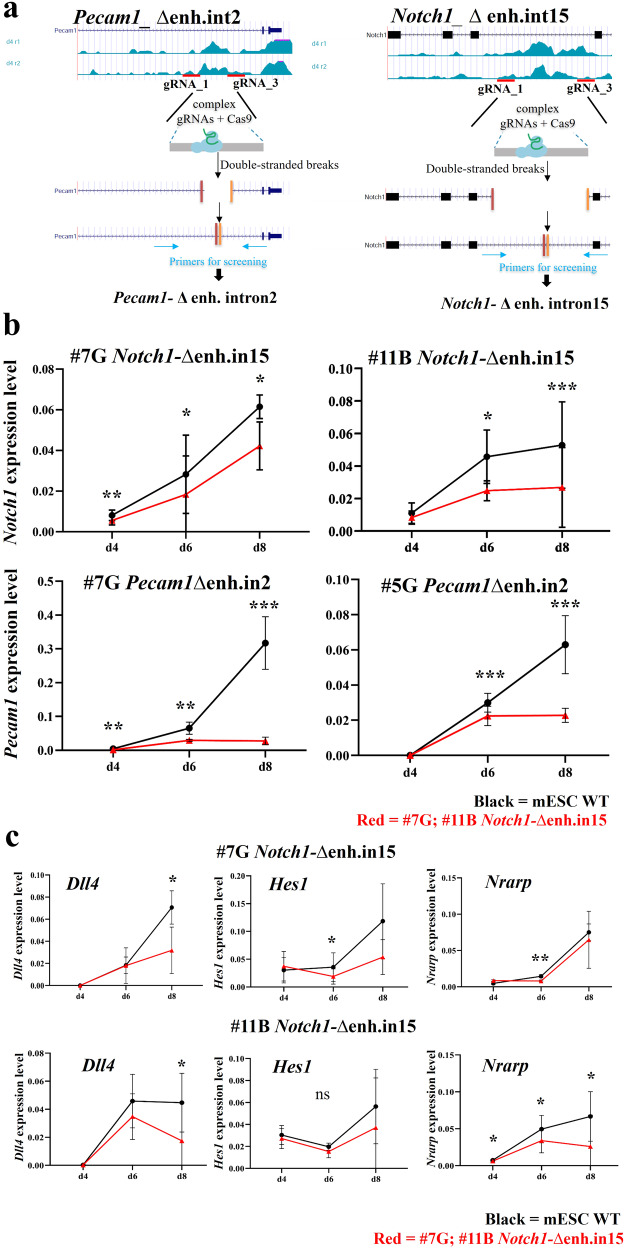
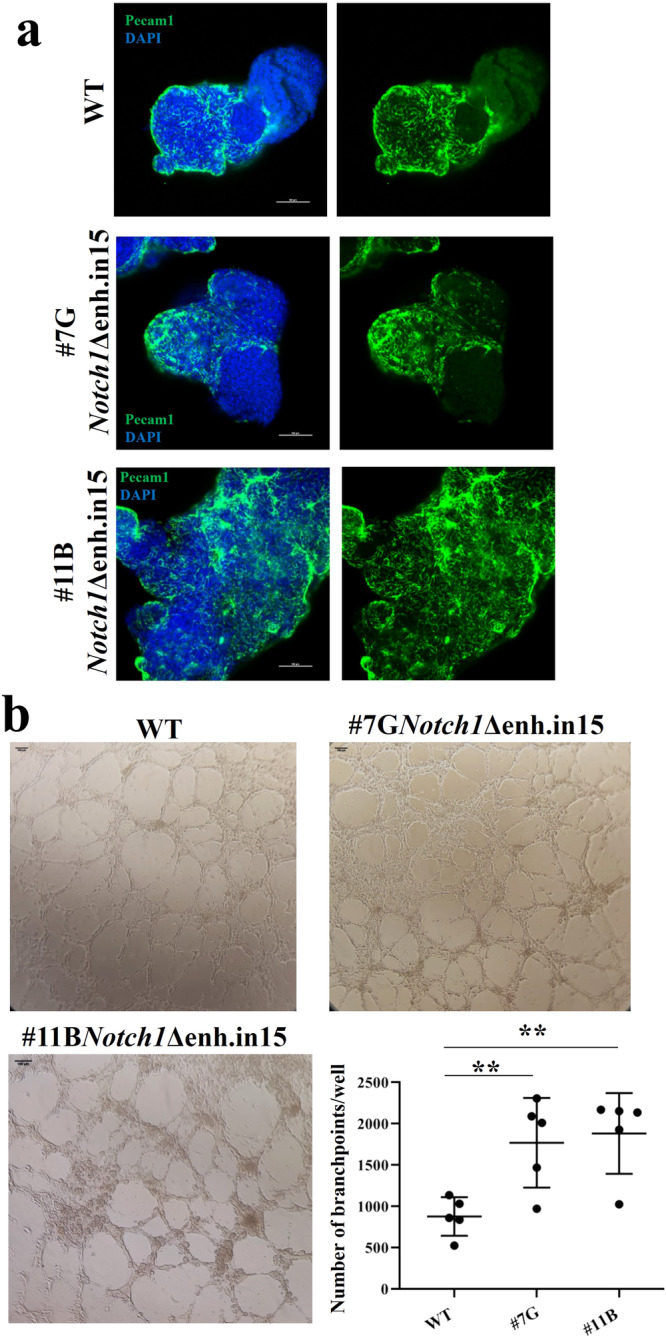
Endothelial cells (EC) differentiate from multiple sources, including the cardiopharyngeal mesoderm, which gives rise also to cardiac and branchiomeric muscles. The enhancers activated during endothelial differentiation within the cardiopharyngeal mesoderm are not completely known. Here, we use a cardiogenic mesoderm differentiation model that activates an endothelial transcription program to identify endothelial regulatory elements activated in early cardiogenic mesoderm. Integrating chromatin remodeling and gene expression data with available single-cell RNA-seq data from mouse embryos, we identify 101 putative regulatory elements of EC genes. We then apply a machine-learning strategy, trained on validated enhancers, to predict enhancers. Using this computational assay, we determine that 50% of these sequences are likely enhancers, some of which are already reported. We also identify a smaller set of regulatory elements of well-known EC genes and validate them using genetic and epigenetic perturbation. Finally, we integrate multiple data sources and computational tools to search for transcriptional factor binding motifs. In conclusion, we show EC regulatory sequences with a high likelihood to be enhancers, and we validate a subset of them using computational and cell culture models. Motif analyses show that the core EC transcription factors GATA/ETS/FOS is a likely driver of EC regulation in cardiopharyngeal mesoderm.


Conflict of interest statement

The authors declare no competing interests.

Figures

Fig. 1
Fig. 1. Activation of an EC transcription program during cardiogenic mesoderm differentiation of mESC.
a Schematic illustration of the EC differentiation protocol from mESCs. b Expression of pluripotency (Oct3/4; Nanog; Rex1), mesodermal (Brachyury; Mesp1; Pdgfrα; Gata4), endothelial marker genes (Pecam1; Eng; Kdr; Cdh5; Nos3; Flt1; Gata6; Notch1), and the CPM marker Tbx1 during differentiation by RT-PCR. Gapdh was used as a normalizer. The molecular weight marker is the 100 bp ladder. Uncropped photographs of gels are reported in Supplementary Fig. 1. c RNA-seq volcano plot of differentially expressed genes (DEGs) in d4 vs d2 samples in two biological replicates. Genes downregulated at d4 (n. 731) are indicated in blue and genes upregulated are in red (n. 1088). We indicate examples of endothelial marker genes (Flt1; Kdr; Ets1; Fli1; Gata4; Pecam1; Cdh5; Etv2; Gata6; Gata1; Erg; Tie1; Gata2, Notch1).
Fig. 2
Fig. 2. Progressive EC differentiation from cardiogenic mesoderm.
a Flow cytometry using anti-VE-Cadherin antibody during mESC differentiation. The VE-Cadherin+ subpopulation is identified at days 4-6-8 of differentiation. The negative control is isotype IgG1 control antibody-labeled differentiating cells. b In vitro tube formation assay (Matrigel) of d4 cells (left, negative control) and d8 cells (right) plated for 24 h. The scale bar is 100 µm.
Fig. 3
Fig. 3. Chromatin remodeling during mESC differentiation.
a Volcano plot of differentially accessible regions (DARs) in d4 vs d2 samples. In blue are DARs decreased at day 4; in red are DARs increased at day 4. b Distribution of total ATAC peaks at d2, d4, and DARs relative to gene features. The promoter region has been set at ±1000 bp to the transcription start site (TSS). Data sources are shown in Supplementary Data 6. c Enriched known motifs evaluated by HOMER using DARs mapped to marker genes of the EC cluster reported by Nomaru et al., 2021 selected from the Tbx1Cre-sorted population of mouse embryos at E8.5 and E9.5. The full motif search results are reported in Supplementary Data 4.
Fig. 4
Fig. 4. Selection of putative regulatory elements in major EC genes (EC-REs).
ATAC-seq coverage associated with six putative EC-REs, associated with six selected EC genes: Kdr; Eng; Cdh5; Flt1; Pecam1; Notch1. On the vertical axis, there are the genome coverage of d2 (replicate1 and replicate2) and d4 (replicate1 and replicate2). Red boxes indicate the open chromatin region at d4.
Fig. 5
Fig. 5. Epigenetic reprogramming validates putative regulatory elements.
a Top: Schematic overview of CRISPR-dCas9:LSD1 system: the fusion protein dCas9:LSD1 is able to bind DNA target and LSD1 can demethylate histone H3 lysine 4 (H3K4me1 and me2) near the putative enhancer region to decommission the enhancer. Bottom: cartoon of the experimental plan. mESC #B1 dCas9-LSD1 were transfected with fluorescent gRNAs. Fluorescent-sorted cells were differentiated into ECs from day 0 to day 8. Samples were collected on day 4, day 6, and day 8 to analyze the gene expression. b Quantitative real-time PCR (qPCR) analysis of Kdr; Cdh5; Eng; Notch1; Flt1, and Pecam1 mRNA expression level in cells of clone #B1 dCas9-LSD1 transfected with gRNAs targeted (in red) or control (in black) during EC differentiation. X-axis denotes the three time points (d4-d6–d8); y-axis indicates the expression level, evaluated using the 2ΔCt method. Gapdh expression was used as a normalizer. Values are the average of four (n = 4) biological replicates ± standard deviation (SD). p value (*) <0.05 and p value (**) <0.01 are considered significant; ns no statistical significance (parametric paired t-test, one-tailed).
Fig. 6
Fig. 6. Homozygous deletion of putative regulatory elements of Notch1 and Pecam1 genes reduced their expression during EC differentiation.
a Scheme of the steps of targeted Pecam1- enh.int2 and Notch1- enh.int15 deletion with CRISPR/Cas9. Red lines indicate the position of the two gRNAs used. b Quantitative real-time PCR (qPCR) analysis of Notch1 mRNA expression level in mESC Notch1-∆enh.in15 (clones #7 G; #11B) and Pecam1 in mESC Pecam1∆enh.in2 (clones #7G; 5G) during EC differentiation. Notch1 and Pecam1 expression was reduced in mutant cell lines (in red), compared to WT cells (in black), used as control. The X-axis denotes the three time points (d4-d6-d8); the y-axis indicates the expression level, evaluated using the 2ΔCt method. Gapdh expression is used as a normalizer. Values are the average of five biological replicates ± standard deviation (SD). p value (*) <0.05; p value (**) <0.01 and p value (***) <0.001 are considered significant; ns no statistical significance (parametric paired t-test, one-tailed). c Quantitative real-time PCR (qPCR) analysis of gene expression of Notch1-related genes in mESC Notch1-∆enh.in15 (clones #7G; #11B) during EC differentiation. p value (*) <0.05 and p value (**) <0.01 are considered significant; ns no statistical significance (parametric paired t-test, one-tailed).
Fig. 7
Fig. 7. The deletion of the Notch1 EC-RE affected the development of a vascular-like network in differentiating mESC.
a Immunofluorescence images showing PECAM1 expression (in green) on cardiac gastruloids at 168 h, using WT and mESC Notch1-∆enh.in15 (clones #7G; #11B). Images were obtained with Nikon A1 Confocal Microscopy. Scale bars: 100 µm. b In vitro tube formation assay (Matrigel) of d8 WT and mESC Notch1-∆enh.in15 (clones #7G; #11B) plated for 24 h. Scale bars, 100 µm. Quantification of branch points from five independent experiments. p value (**) <0.01 obtained using the parametric paired t-test, one-tailed. Error bars: SD.

References

    1. Aquino JB, Sierra R, Montaldo LA. Diverse cellular origins of adult blood vascular endothelial cells. Dev. Biol. 2021;477:117–132. doi: 10.1016/j.ydbio.2021.05.010. - DOI - PubMed
    1. De Val S, Black BL. Transcriptional control of endothelial cell development. Dev. Cell. 2009;16:180–195. doi: 10.1016/j.devcel.2009.01.014. - DOI - PMC - PubMed
    1. Sabbagh MF, et al. Transcriptional and epigenomic landscapes of CNS and non-CNS vascular endothelial cells. eLife. 2018;7:e36187. doi: 10.7554/eLife.36187. - DOI - PMC - PubMed
    1. Trimm E, Red-Horse K. Vascular endothelial cell development and diversity. Nat. Rev. Cardiol. 2023;20:197–210. doi: 10.1038/s41569-022-00770-1. - DOI - PMC - PubMed
    1. Li P, Ferrara N. Vascular heterogeneity: VEGF receptors make blood vessels special. J. Exp. Med. 2022;219:e20212539. doi: 10.1084/jem.20212539. - DOI - PMC - PubMed

Publication types

MeSH terms

Substances