. 2024 Apr;43(8):1388-1419.
doi: 10.1038/s44318-024-00068-7. Epub 2024 Mar 21.

The growth factor EPIREGULIN promotes basal progenitor cell proliferation in the developing neocortex

Affiliations

The growth factor EPIREGULIN promotes basal progenitor cell proliferation in the developing neocortex

Paula Cubillos et al. EMBO J. 2024 Apr.

Abstract

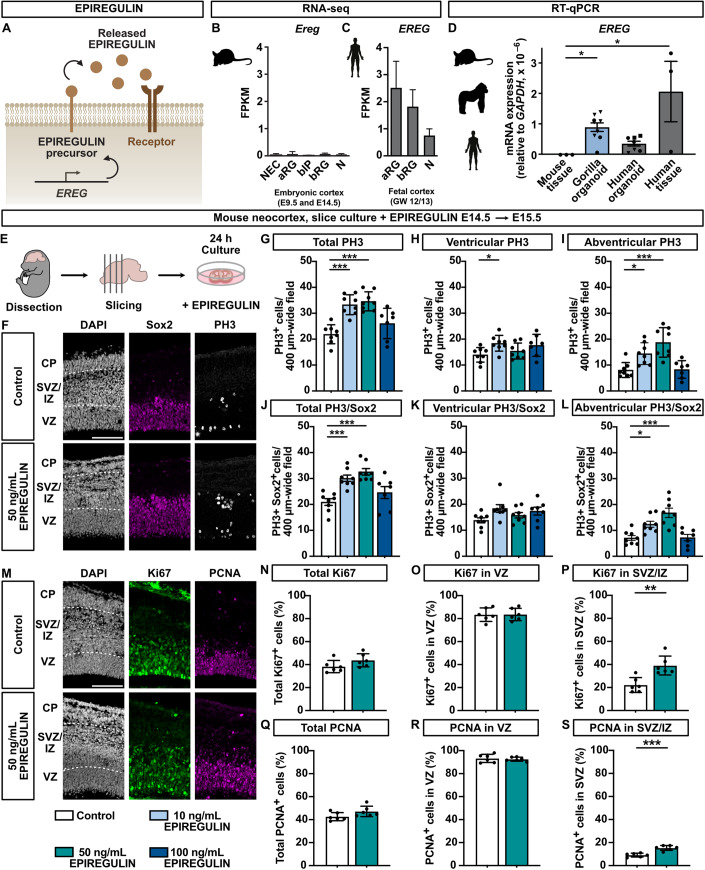
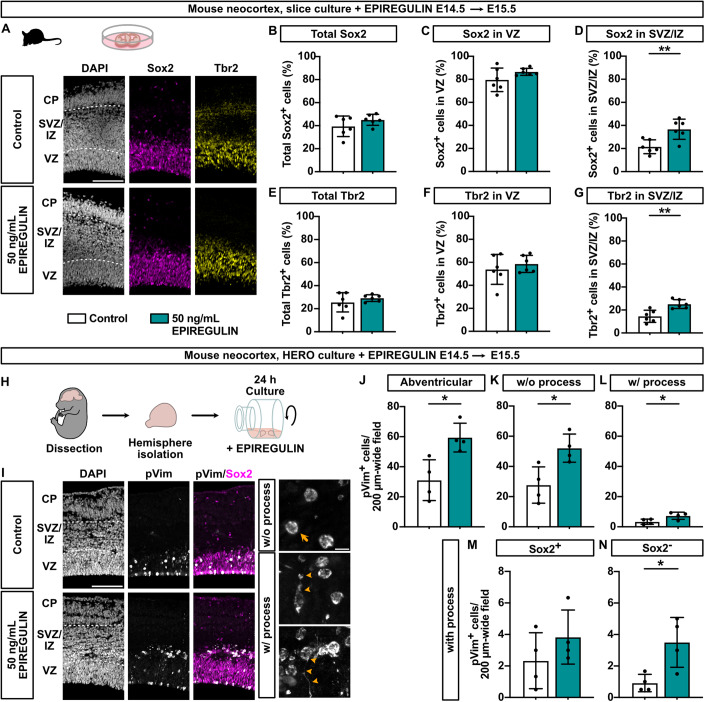
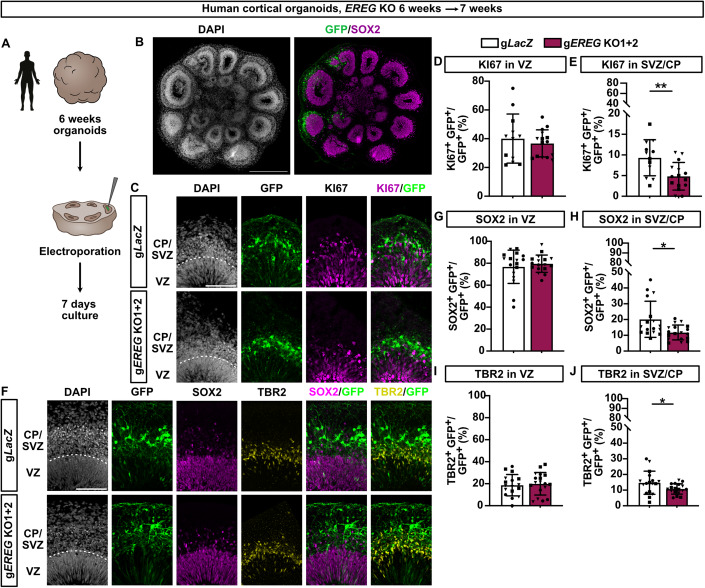
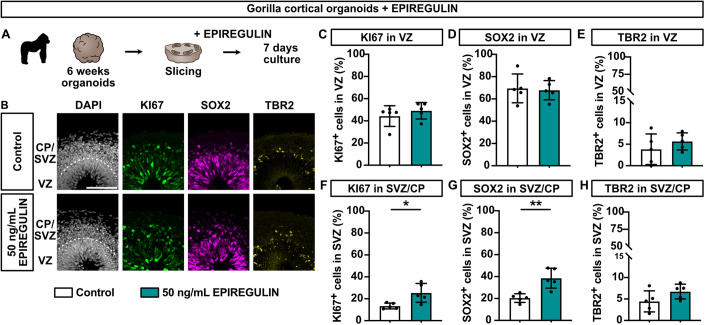
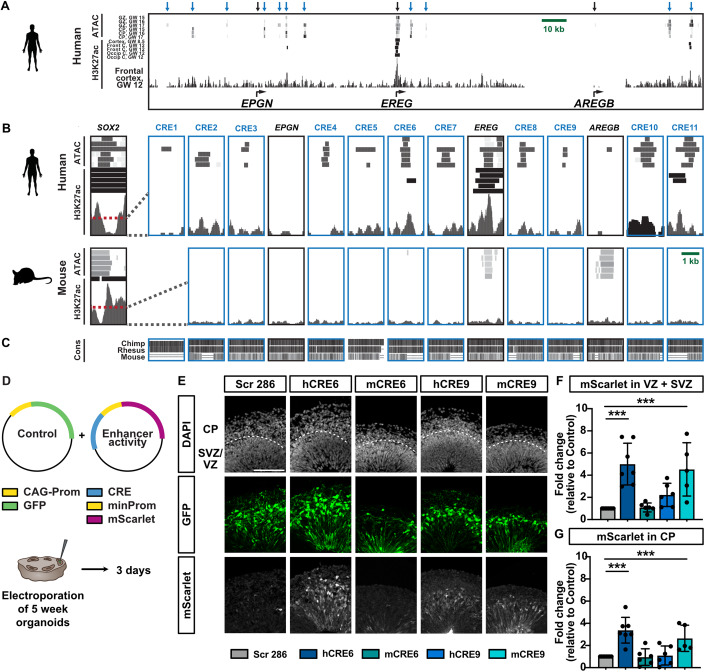
Neocortex expansion during evolution is linked to higher numbers of neurons, which are thought to result from increased proliferative capacity and neurogenic potential of basal progenitor cells during development. Here, we show that EREG, encoding the growth factor EPIREGULIN, is expressed in the human developing neocortex and in gorilla cerebral organoids, but not in the mouse neocortex. Addition of EPIREGULIN to the mouse neocortex increases proliferation of basal progenitor cells, whereas EREG ablation in human cortical organoids reduces proliferation in the subventricular zone. Treatment of cortical organoids with EPIREGULIN promotes a further increase in proliferation of gorilla but not of human basal progenitor cells. EPIREGULIN competes with the epidermal growth factor (EGF) to promote proliferation, and inhibition of the EGF receptor abrogates the EPIREGULIN-mediated increase in basal progenitor cells. Finally, we identify putative cis-regulatory elements that may contribute to the observed inter-species differences in EREG expression. Our findings suggest that species-specific regulation of EPIREGULIN expression may contribute to the increased neocortex size of primates by providing a tunable pro-proliferative signal to basal progenitor cells in the subventricular zone.

Keywords: Cortical Organoid; Gene Regulation; Human Neurogenesis; Neocortex Evolution; Neural Progenitor Cell.


Conflict of interest statement

The authors declare no competing interests.

Figures

Figure 1
Figure 1. EREG is expressed in the developing hNcx and induces NPC proliferation in the mNcx.
(A) Schematic illustration of the expression of EPIREGULIN from the EREG gene. (B, C) EREG mRNA levels in mouse and human NPCs and neurons analyzed by RNA-seq (data from Albert et al, (2017); Florio et al, (2015)). (D) RT-qPCR expression analysis of EREG in mNcx (E14.5), gorilla cerebral organoids (week 6–8), human cortical organoids (week 6), and fetal hNcx (GW 12/13), relative to GAPDH. (E) Schematic of experimental workflow. Mouse brains (E14.5) were cut into slices and treated with different concentrations of EPIREGULIN for 24 h. (F) DAPI staining and immunofluorescence for Sox2 and PH3 of slices treated with 50 ng/mL EPIREGULIN. (GL) Quantifications of total, ventricular and abventricular mitotic PH3+ cells and PH3+ Sox2+ double-positive cells of slices treated with different concentrations of EPIREGULIN. (M) DAPI staining and immunofluorescence for Ki67 and PCNA of slices treated with 50 ng/mL EPIREGULIN. (NP) Quantifications of total Ki67-positive cells, and Ki67-positive cells in the VZ and SVZ/IZ (percentage of DAPI). (QS) Quantifications of total PCNA-positive cells, and PCNA-positive cells in the VZ and SVZ/IZ (percentage of DAPI). Data information: Scale bars, 100 µm. Bar graphs represent mean values. Error bars represent SD; (B), of 4–5 tissue samples from different litters; (C), of 2–4 tissue samples from different individuals; (D), of three tissue samples from different individuals and 7–8 organoids (different symbols indicate independent batches); (GL, NS), of eight embryos from different litters, with each dot representing the average of three to six images of different sections of the same brain. ***p < 0.001, **p < 0.01, *p < 0.05; one-way ANOVA with Dunnett post hoc test (D, GL), and Student’s t-test (NS). Source data are available online for this figure.
Figure 2
Figure 2. Addition of EPIREGULIN to the mNcx increases BPs.
(A) DAPI staining and immunofluorescence for Sox2 and Tbr2 of mNcx slices (E14.5) cultured with 50 ng/mL EPIREGULIN for 24 h. (BD) Quantifications of the percentage of total Sox2, and Sox2 in the VZ and SVZ/IZ (of DAPI-positive cells). (EG) Quantifications of the percentage of total Tbr2, and Tbr2 in the VZ, and SVZ/IZ (of DAPI-positive cells). (H) Schematic of experimental workflow. mNcx hemispheres (E14.5) were cultured under rotation (HERO) in the presence of 50 ng/mL EPIREGULIN for 24 h. (I) DAPI staining and immunofluorescence for phospho-Vimentin (pVim) and Sox2 to distinguish mitotic BPs without (top; arrow) or with (bottom; arrowheads) a process. (JL) Quantifications of abventricular pVim-positive cells, and pVim-positive cells without and with a process. (M, N) Quantifications of Sox2+ and Sox2–cells among pVim-positive cells with a process. Data information: Scale bars, 100 µm (A, I left) and 10 µm (I inset). Bar graphs represent mean values. Error bars represent SD of 4–6 embryos from different litters with each dot representing the average of 3–4 images of different sections of the same brain. **p < 0.01, *p < 0.05; Student’s t-test. Source data are available online for this figure.
Figure 3
Figure 3. EPIREGULIN ablation in human cortical organoids reduces BP proliferation.
(A) Schematic of experimental workflow. Human cortical organoids (6 weeks) derived from the CRTDi004-A iPSC line were electroporated with a plasmid encoding GFP and CRISPR/Cas9 RNP complexes targeting either LacZ or EREG, and analyzed after 7 days. (B) DAPI staining and immunofluorescence for GFP and SOX2 of an electroporated human cortical organoid. (C) DAPI staining and immunofluorescence for GFP and KI67. (D, E) Quantifications of KI67 in the VZ and SVZ/CP. (F) DAPI staining and immunofluorescence for GFP, SOX2, and TBR2. (GJ) Quantifications of SOX2 and TBR2 in the VZ and SVZ/CP. Data information: Scale bars, 500 µm (B) and 100 µm (C, F). Bar graphs represent mean values. Error bars represent SD of 12–18 organoids from three independent batches (indicated by different symbols). **p < 0.01, *p < 0.05; one-way ANOVA with Dunnett post hoc test. Source data are available online for this figure.
Figure 4
Figure 4. Addition of EPIREGULIN to the hNcx does not further induce proliferation.
(A) Schematic of experimental workflow. Human fetal tissue pieces (GW 12/13) were isolated and cultured in a free-floating tissue culture (FFTC) in the presence of 50 ng/mL EPIREGULIN for 24 h. (B) DAPI staining and immunofluorescence for KI67, SOX2, and TBR2. (CE) Quantifications of KI67, SOX2, and TBR2 in the SVZ. (F) Schematic of experimental workflow. Human sliced cortical organoids (10 weeks) were treated with 50 ng/mL EPIREGULIN for 10 days. (G) DAPI staining and immunofluorescence for KI67, SOX2, and TBR2 of human cortical organoids derived from the CRTDi004-A iPSC line treated with EPIREGULIN. (HM) Quantifications of KI67, SOX2, and TBR2 in the VZ and SVZ/CP of human cortical organoids. Data information: Scale bars, 100 µm. Bar graphs represent mean values. Error bars represent the SD of four independent fetal tissue samples (CE) or four cortical organoids (HM); Student’s t-test; no statistically significant changes were detected. Source data are available online for this figure.
Figure 5
Figure 5. Addition of EPIREGULIN to gorilla organoids further induces BP proliferation.
(A) Schematic of experimental workflow. Gorilla-sliced cortical organoids (6 weeks) were treated with 50 ng/mL of EPIREGULIN for 7 days. (B) DAPI staining and immunofluorescence for KI67, SOX2, and TBR2 in gorilla cortical organoids treated with EPIREGULIN. (CH) Quantifications of KI67, SOX2, and TBR2 in the VZ and SVZ/CP. Data information: Scale bar, 100 µm. Bar graphs represent mean values. Error bars represent SD of five cortical organoids (CE); **p < 0.01, *p < 0.05; Student’s t-test. Source data are available online for this figure.
Figure 6
Figure 6. EPIREGULIN mediates BP proliferation via EGFR-signaling.
(A) Schematic of the EPIREGULIN receptors and inhibitors. (B, C) Expression of EPIREGULIN receptor genes in mNcx and hNcx analyzed by RNA-seq (data from Florio et al, (2015)). (D) Schematic illustration of the experimental workflow. Mouse NSC cultures were treated with different concentrations of EPIREGULIN for 3 days. The SiR-DNA dye was added to the culture to allow imaging of live cells on days 1, 2, and 3. (E) Images of SiR-DNA stained mNSC following treatment with EPIREGULIN in culture medium containing FGF but lacking EGF. The control mNSCs were cultured in a medium with EGF and FGF. (F, G) Quantification of SiR-DNA-positive cells on days 1, 2, and 3 following EPIREGULIN treatment, either with or without EGF, shown as fold change relative to 1 h. (H) Immunofluorescence for PH3 of mNcx slices treated with 50 ng/mL EPIREGULIN and receptor inhibitors for 24 h. (I) Quantifications of abventricular mitotic PH3-positive cells. Data information: Scale bars, 100 µm. Bar and line graphs represent mean values. Error bars represent SD; (B) of 4–5 tissue samples from different litters; (C) of 2–4 tissue samples from different individuals; (F, G) of three different mNSC lines, with each replicate representing the average of five images; (I) of 3–4 embryos from different litters, with each dot representing the average of three images of different sections of the same brain. *p < 0.05, ***p < 0.001; (F, G) two-way ANOVA; (I) one-way ANOVA with Dunnett post hoc test. Source data are available online for this figure.
Figure 7
Figure 7. Putative enhancer regions for EREG differential gene expression.
(A) ATAC-seq (de la Torre-Ubieta et al, 2018) and H3K27ac ChIP-seq (Reilly et al, 2015) peaks around the EREG gene (±100 kb) in the hNcx at given ages. Black arrows, TSS; blue arrows, putative CREs. (B) Zoom in on the TSS and CRE regions indicated by arrows in (A), relative to open chromatin marks at the SOX2 gene, for humans (top) and mouse (bottom, (Gorkin et al, 2020)). Window size, 2 kb. (C) Evolutionary conservation from 100 vertebrate species (Blanchette et al, 2004) for the indicated species. (D) Schematic of experimental workflow. Human sliced cortical organoids (6 weeks) were electroporated with a plasmid encoding GFP and a plasmid with a putative CRE upstream of a minimal promotor driving mScarlet expression, and analyzed after 3 days. (E) DAPI staining and immunofluorescence for GFP and mScarlet of an electroporated human cortical organoid to test for enhancer activity of mouse and human CRE6 and CRE9. (F, G) Quantification of mScarlet signal intensity in the VZ + SVZ and CP, relative to Scr control. Data information: Scale bar, 100 µm. Bar graphs represent mean values. Error bars represent the SD of six organoids from two batches. ***p < 0.001; one-way ANOVA with Dunnett post hoc test. Source data are available online for this figure.
Figure EV1
Figure EV1. Expression of EREG in neural progenitor cells of different species.
(A, B) EREG mRNA levels in human fetal Ncx tissue and cerebral organoids analyzed by RNA-seq (data from Camp et al, (2015); Johnson et al, (2015)). (C) In situ hybridization data for Sox2 and Ereg of E13.5 and E15.5 mouse neocortex, obtained from the Allen Brain Atlas (Allen Institute for Brain Science, 2004). (D) Immunofluorescence for SOX2, TBR2, and TUJ1 of mNcx and hNcx tissue. (E) H3K4me3, H3K27me3, and H3K27ac ChIP-seq signal around the EREG transcription start site (±1 kb) in mouse proliferative aRG, forebrain, and cortex (top) and of H3K27ac in the human cortex (bottom) (data from Albert and Huttner (2018); Gorkin et al, (2020); Reilly et al, (2015)). (F) Immunofluorescence for SOX2, TBR2, and TUJ1 of gorilla cerebral and human cortical organoids. (G) EREG mRNA levels in macaque and human NPCs analyzed by RNA-seq (data from Kliesmete et al, (2023)). (H) EREG mRNA levels in the ferret Ncx analyzed by microarray (data from de Juan Romero et al, (2015)). Data information: Scale bars, 100 µm. Bar graphs represent mean values. Error bars represent SD; G, of three samples; H, of six micro-dissected tissue samples.
Figure EV2
Figure EV2. Validation of EREG gRNA function.
(A) Schematic illustration of the human EREG gene locus. The location of the guide RNAs for CRISPR/Cas9-mediated ablation of EPIREGULIN expression (gEREG KO1 + 2) is shown, as well as the location of primer binding sites (Fwd, forward; Rev, reverse) for the generation of DNA templates for in vitro gRNA efficiency testing. (B) Guide RNA efficiencies were tested in vitro. The effects of the gEREG KO1 + 2 RNAs to direct Cas9-mediated cutting of PCR templates was analyzed by agarose gel electrophoresis. Schemes of the sizes of PCR templates, guide RNA binding sites, and expected sizes of cut fragments are indicated below. (C) CRISPR/Cas9-mediated targeting of EREG was confirmed in the CRTDi004-A iPSC line by electroporation of Cas9/gRNA ribonucleoprotein complexes together with a GFP plasmid, followed by FACS of GFP-positive cells, PCR amplification of the target region and Sanger sequencing. The sequencing results are shown for gEREG KO1 + 2. (D) DAPI staining and immunofluorescence for GFP, KI67, and SOX2 of an electroporated human cortical organoid derived from the HPSI0114i-kolf_2 iPSC line. (EH) Quantifications of KI67 and SOX2 in the VZ and SVZ/CP. (I) DAPI staining and immunofluorescence for GFP and CTIP2 of an electroporated human cortical organoid from the CRTDi004-A iPSC line. (J, K) Quantifications of CTIP2 in the VZ and SVZ/CP. Data information: Scale bar, 100 µm. Bar graphs represent mean values. Error bars represent SD of 12–15 organoids from three batches. **p < 0.01; Student’s t-test.
Figure EV3
Figure EV3. Gene expression analysis upon addition of EPIREGULIN to the mouse neocortex.
(A) Schematic illustration of the experimental workflow. Mouse brain hemispheres (E14.5) from the Tubb3::GPF line (Attardo et al, 2008) were isolated and cultured under rotation in the presence of 50 ng/mL of EPIREGULIN for 24 h, dissociated, stained for Sox2 and Tbr2, and cell populations isolated by immuno-FACS based on the indicated marker combinations. (B) Gating strategy of RG (top, left) based on high levels of Sox2 and low levels of Tbr2; IP (top, right) based on high levels of Tbr2, irrespective of other markers; and neurons (bottom) based on enrichment of GFP expressed from the Tubb3 promoter and low level of Tbr2, followed by exclusion of Sox2-positive cells. (C) Confirmation of cell type identity by RT-qPCR expression analysis of marker genes characteristic of RG (Sox2, Prom1), IP (Eomes), and neurons (Dcx, Tubb3) for control and hemispheres treated with EPIREGULIN for 24 h relative to Gapdh. (D) Expression of Sox2, Eomes, Tubb3, and Ereg in RG, IP, and neurons analyzed by RNA-seq. (E) Volcano plots of log10 (p value) against log2 fold change representing the differences in gene expression in the indicated cell types analyzed by RNA-seq. Gray, non-significant; blue, downregulated. (F) Principal component analysis (PCA) based on the 500 most divergent genes. The percentage of variance covered by the first two components is indicated. Data information: Bar graphs represent mean values. Error bars represent SD of 3 mNcx samples from different litters. E, Wald test of DESeq2 was used and P Values were corrected for multiple testing with the Independent Hypothesis Weighting package (IHW 1.18.0).
Figure EV4
Figure EV4. NSC proliferation upon exposure to different growth factors.
(A) Schematic illustration of the experimental workflow. Early (p0) and late (p9) passage mouse NSC cultures were treated with different growth factors for 3 days and their proliferation was assessed. (B) Images of mNSC cultures following treatment with EPIREGULIN in culture medium containing FGF and with or without EGF. The control mNSCs were cultured in a medium with EGF and FGF. (C) Quantification of cells on days 1, 2, and 3 following EPIREGULIN treatment, either with or without EGF, shown as fold change relative to 1 h. (D) Staining for DAPI and immunofluorescence for PH3 of mNcx slices treated with 10 µM of the receptor inhibitor Dacomitinib for 24 h. Note the reduced tissue integrity and the apoptotic nuclei in the inset (right). Data information: Scale bars, 100 µm. C, Data points are from two different mNSC lines.
Figure EV5
Figure EV5. Editing of histone methylation at the Ereg locus in mNSCs.
(A) Epigenome editing (EE) employing the catalytic domain of KDM6B (JMJC_6B) fused to nuclease deficient Cas9 (dCas9) in mNSCs. Histone methylation and gene expression were analyzed 2 days post-nucleofection following FACS isolation of GFP-positive cells. (B) The location of the gRNAs and primer binding sites (PP, primer pair) for ChIP-qPCR is shown for the Ereg locus. Guide RNAs gEreg EE1 + 2 and gEreg EE3 + 4 were co-expressed from one plasmid, respectively. (C) Level of H3K27me3 at Hoxb, Eomes, Actb, and Ereg (PP1 to PP3) as determined by ChIP-qPCR in mNSCs. (D) Bright-field and GFP fluorescence images of mNSCs 2 days post nucleofection with a dCas9-JMJC_6B-T2A-EGFP-gLacZ plasmid. (E) ChIP-qPCR analysis of H3K27me3 around the TSS of Ereg and two unrelated genes (Hoxb5, Eomes) after epigenome editing at the Ereg locus. (F, G) Expression of Sox2 and Ereg as determined by RT-qPCR upon epigenome editing using gEreg EE1 + 2 and gEreg EE3 + 4. Expression normalized to Gapdh and relative to gLacZ EE. Data information: Scale bar, 100 µm. Bar graphs represent mean values. Error bars represent the SD of three replicates (from two to three independent experiments). One-way ANOVA with Dunnett post hoc test; no statistically significant changes were detected.

References

    1. Abud HE, Chan WH, Jarde T. Source and impact of the EGF family of ligands on intestinal stem cells. Front Cell Dev Biol. 2021;9:685665. doi: 10.3389/fcell.2021.685665. - DOI - PMC - PubMed
    1. Adli M, Bernstein BE. Whole-genome chromatin profiling from limited numbers of cells using nano-ChIP-seq. Nat Protoc. 2011;6:1656–1668. doi: 10.1038/nprot.2011.402. - DOI - PMC - PubMed
    1. Agger K, Cloos PA, Christensen J, Pasini D, Rose S, Rappsilber J, Issaeva I, Canaani E, Salcini AE, Helin K. UTX and JMJD3 are histone H3K27 demethylases involved in HOX gene regulation and development. Nature. 2007;449:731–734. doi: 10.1038/nature06145. - DOI - PubMed
    1. Albert M, Huttner WB. Epigenetic and transcriptional pre-patterning-An emerging theme in cortical neurogenesis. Front Neurosci. 2018;12:359. doi: 10.3389/fnins.2018.00359. - DOI - PMC - PubMed
    1. Albert M, Kalebic N, Florio M, Lakshmanaperumal N, Haffner C, Brandl H, Henry I, Huttner WB. Epigenome profiling and editing of neocortical progenitor cells during development. EMBO J. 2017;36:2642–2658. doi: 10.15252/embj.201796764. - DOI - PMC - PubMed

Substances