. 2024 May;4(5):694-708.
doi: 10.1038/s43587-024-00599-y. Epub 2024 Mar 21.

Disease staging of Alzheimer's disease using a CSF-based biomarker model

Affiliations

Disease staging of Alzheimer's disease using a CSF-based biomarker model

Gemma Salvadó et al. Nat Aging. 2024 May.

Abstract

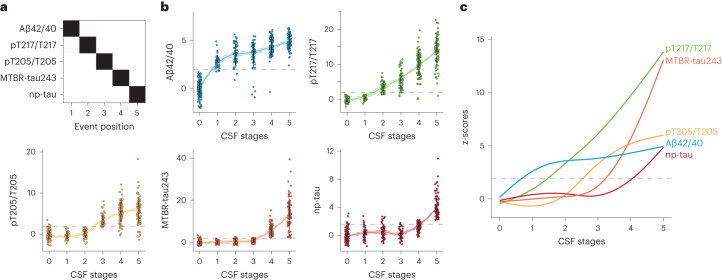
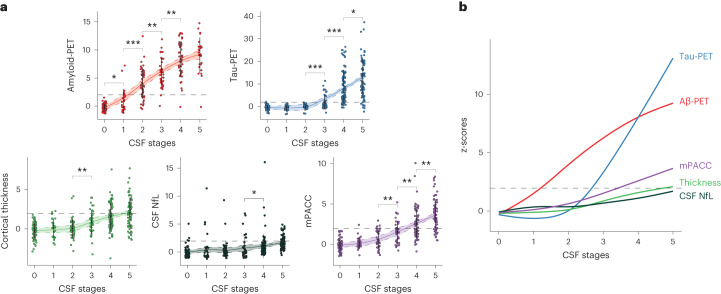
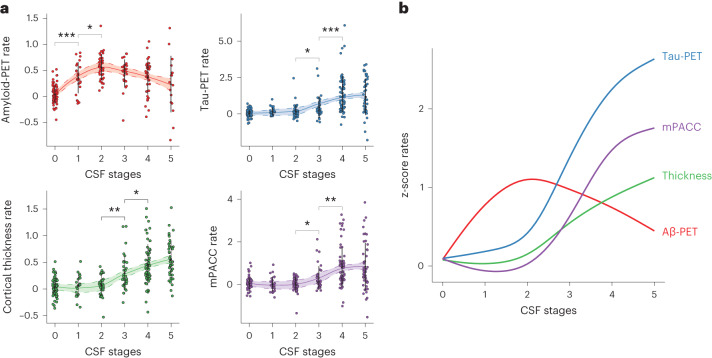
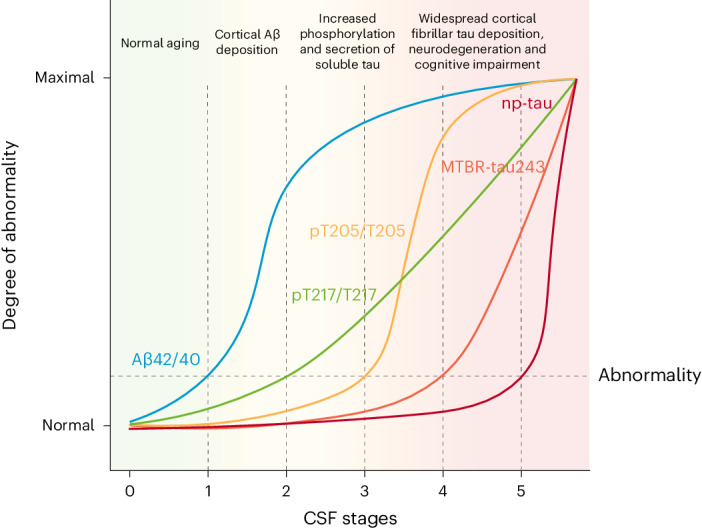
Biological staging of individuals with Alzheimer's disease (AD) may improve diagnostic and prognostic workup of dementia in clinical practice and the design of clinical trials. In this study, we used the Subtype and Stage Inference (SuStaIn) algorithm to establish a robust biological staging model for AD using cerebrospinal fluid (CSF) biomarkers. Our analysis involved 426 participants from BioFINDER-2 and was validated in 222 participants from the Knight Alzheimer Disease Research Center cohort. SuStaIn identified a singular biomarker sequence and revealed that five CSF biomarkers effectively constituted a reliable staging model (ordered: Aβ42/40, pT217/T217, pT205/T205, MTBR-tau243 and non-phosphorylated mid-region tau). The CSF stages (0-5) demonstrated a correlation with increased abnormalities in other AD-related biomarkers, such as Aβ-PET and tau-PET, and aligned with longitudinal biomarker changes reflective of AD progression. Higher CSF stages at baseline were associated with an elevated hazard ratio of clinical decline. This study highlights a common molecular pathway underlying AD pathophysiology across all patients, suggesting that a single CSF collection can accurately indicate the presence of AD pathologies and characterize the stage of disease progression. The proposed staging model has implications for enhancing diagnostic and prognostic assessments in both clinical practice and the design of clinical trials.


Conflict of interest statement

O.H. has acquired research support (for the institution) from ADx, AVID Radiopharmaceuticals, Biogen, Eli Lilly, Eisai, Fujirebio, GE Healthcare, Pfizer and Roche. In the past 2 years, he has received consultancy/speaker fees from AC Immune, Amylyx, Alzpath, BioArctic, Biogen, Cerveau, Eisai, Eli Lilly, Fujirebio, Genentech, Merck, Novartis, Novo Nordisk, Roche, Sanofi and Siemens. J.W.V. is supported by the SciLifeLab & Wallenberg Data-Driven Life Science Program (grant: KAW 2020.0239). K.H. is an Eisai-sponsored voluntary research associate professor at Washington University and has received salary from Eisai. Washington University, R.J.B. and D.M.H. have equity ownership interest in C2N Diagnostics. R.J.B. and D.M.H. receive income from C2N Diagnostics for serving on the scientific advisory board. K.H., N.R.B. and R.J.B. may receive income based on technology (methods to detect MTBR tau isoforms and use thereof) licensed by Washington University to C2N Diagnostics. D.M.H. may receive income based on technology (antibodies to mid-domain of tau) licensed by Washington University to C2N Diagnostics. R.J.B. has received honoraria as a speaker, consultant or advisory board member from Amgen and Roche. D.M.H. is on the scientific advisory board of Genentech, Denali and Cajal Neurosciences and consults for Alector and Asteroid. N.R.B. is a co-inventor on the following US patent applications: ‘Methods to detect novel tau species in CSF and use thereof to track tau neuropathology in Alzheimer’s disease and other tauopathies’ (PCT/US2020/046224); ‘CSF phosphorylated tau and amyloid beta profiles as biomarkers of tauopathies’ (PCT/US2022/022906); and ‘Methods of diagnosing and treating based on site-specific tau phosphorylation’ (PCT/US2019/030725). N.R.B. may receive royalty income based on technology licensed by Washington University to C2N Diagnostics. The remaining authors declare no competing interests.

Figures

Fig. 1
Fig. 1. CSF staging model.
Description of the CSF staging model and the levels of the biomarkers included in the model by CSF stage. Cross-validated confusion matrix of the CSF biomarkers of the model is shown in a. Biomarkers are sorted by the time they become abnormal based on the results of SuStaIn. Darkness represents the probability of that biomarker of becoming abnormal at that position, with black being 100%. Only amyloid-positive participants are included in this analysis. Individual biomarker levels by CSF stage in all BioFINDER-2 participants are shown in b. CSF levels are z-scored based on a group of CU− participants (n = 63), and all increases represent increase in abnormality. Colored lines and bands represent the LOESS regression and its 95% CI. Horizontal line is drawn at z-score = 1.96, which represents 95% CI of the reference group (CU−). Smoothed LOESS lines of all CSF biomarkers are shown in c for comparison. CSF stage 0 represents being classified as normal by the model. Black dots and vertical lines represent mean and 2 s.d. by CSF stage, respectively.
Fig. 2
Fig. 2. AD pathology biomarkers and cognition by CSF stages.
a, Depiction of individual biomarker levels, not used in the creation of the model, by CSF stage in BioFINDER-2 participants. These include biomarkers of amyloid (amyloid-PET) and tau (tau-PET in the meta-temporal ROI) pathologies, neurodegeneration (cortical thickness in the AD signature areas and CSF NfL) and cognition (mPACC). Biomarkers are z-scored based on a group of CU− participants (n = 63), and all increases represent increase in abnormality. Significant differences in contiguous CSF stages are shown with asterisks (two-sided, FDR-corrected). The horizontal line is drawn at z-score = 1.96, which represents 95% CI of the reference group (CU−). Colored lines and bands represent the LOESS regression and its 95% CI. Smoothed LOESS lines of all AD biomarkers are shown in b for comparison. All participants with available data were included in amyloid-PET and tau-PET analyses. For neurodegeneration (cortical thickness and NfL) and cognitive (mPACC) measures, we excluded patients with non-AD dementia to avoid bias. Of note, only few AD dementia cases had amyloid-PET available due to study design. CSF stage 0 represents being classified as normal by the model. Black dots and vertical lines represent mean and 2 s.d. per CSF stage, respectively. *P < 0.05; **P < 0.01; ***P < 0.001. Exact P values shown in the figure are as follows. Amyloid-PET: 0–1, P = 0.032; 1–2: P = 1.6 × 10−6; 2–3: P = 0.003; 3–4: P = 0.0007. Tau-PET: 2–3: P = 0.0003; 3–4: P = 3.3 × 10−11; 4–5: P = 0.010. Cortical thickness: 2–3: P = 0.006. CSF NfL: 3–4: P = 0.016. mPACC: 2–3: P = 0.004; 3–4: P = 0.002; 4–5: P = 0.0008.
Fig. 3
Fig. 3. CSF stages for predicting A/T status and cognitive stages.
CSF stages for predicting pathological status as measured with PET are shown in a and b and for predicting cognitive stages and diagnostic groups in c and d. Bar plots represent the number of participants in each category per CSF stage. Numbers of participants in each category per CSF stage are shown within the bar plots (a and c). In b and d, ROC curves were used to assess the classification into dichotomic categories (Aβ-PET, tau-PET and AD versus non-AD cognitive impairment), whereas ordinal logistic regressions were used for ordinal categories (A/T status and diagnosis). Heat maps represent the predicted percentage of participants in each outcome category (A/T or diagnosis) by CSF stage. The most probable (highest percentage) category by CSF stage is framed in black. For ROC analyses, AUCs and sensitivity and specificity measures from these analyses are shown in the plot. The optimal cutoff in each case is shown as a vertical dashed line in a or c. An A−T+ participant (n = 1) was excluded from the A/T status analysis. Non-AD dementia cases were excluded from the cognitive stages analysis. In addition, only patients with objective impairment (MCI or dementia) were included in the analyses of AD versus non-AD. Amyloid-PET and tau-PET were assessed as positive based on previously validated cutoffs (amyloid-β: SUVR > 1.03, tau: SUVR > 1.36).
Fig. 4
Fig. 4. Longitudinal rate of change of AD biomarkers by CSF stages.
a, Depiction of individual biomarker longitudinal rates of change by CSF stage in BioFINDER-2 participants. These include biomarkers of amyloid (amyloid-PET) and tau (tau-PET in the meta-temporal ROI) pathologies, neurodegeneration (cortical thickness in the AD signature) and cognition (mPACC). Biomarkers are z-scored based on a group of CU− participants (n = 63), and all increases represent increase in abnormality. Rates of change were calculated with individual linear regression models. Significant differences in contiguous CSF stages are shown with asterisks (two-sided, FDR-corrected). Colored lines and bands represent the LOESS regression and its 95% CI. Smoothed LOESS lines of all AD biomarkers are shown in b for comparison. All participants were included in amyloid-PET and tau-PET analyses. For neurodegeneration (cortical thickness) and cognitive (MMSE) measures, we excluded patients with non-AD dementia to avoid bias. CSF stage 0 represents being classified as normal by the model. Black dots and vertical lines represent mean and 2 s.d. per CSF stage, respectively. *P < 0.05; **P < 0.01; ***P < 0.001. Exact P values shown in the figure are as follows. Amyloid-PET: 0–1, P = 8.4 × 10−5; 1–2: P = 0.025. Tau-PET: 2–3: P = 0.032; 3–4: P = 4.6 × 10−5. Cortical thickness: 2–3: P = 0.001; 3–4: P = 0.041. mPACC: 2–3: P = 0.019; 3–4: P = 0.003.
Fig. 5
Fig. 5. CSF stages for predicting clinical progression.
Higher CSF stages groups (4–5) show higher HR of clinical progression compared to lower positive stages (1–3). Progression from CU or MCI at baseline to AD dementia is shown in a and b. Progression from MCI at baseline to AD dementia is shown in c and d. Progression from CU at baseline to MCI is shown in e and f. Kaplan–Meier curves (shaded area: 95% CI) as well as the number of participants per group and timepoint are shown in a, c and e, respectively. Cox proportional hazards models were used to calculate HR (95% CI) (square and error bars, respectively) of higher CSF stages (4–5) compared to the reference (1–3; b, d and f). These analyses were adjusted for age and sex in all cases and, additionally, for clinical status at baseline (CU or MCI) if appropriate. Dashed lines in a, c and e indicate the timepoint at which 50% of a group had progressed. Exact P values shown in the figure are as follows: b: P = 0.00025; d: P = 0.00097; f: P = 0.00082.
Fig. 6
Fig. 6. Replication of main analyses in Knight ADRC participants.
Cross-validated confusion matrix of the CSF biomarkers of the model is shown in a. Darkness represents the probability of that biomarker becoming abnormal at that position, with black being 100%. Description of the CSF levels of the biomarkers included in the model by CSF stages are shown in b. Depiction of individual biomarker levels, not used in the creation of the model by CSF stages, are shown in c. All increases represent increase in abnormality. The horizontal line is drawn at z-score = 1.96, which represents 95% CI of the reference group (CU−). CSF stage 0 represents being classified as normal by the model. Prediction of amyloid-PET (dg), tau-PET (eh) and A/T status (by PET, fi) are shown next. The number of participants in each category is colored in df. Numbers of participants in each category per CSF stage are shown within the bar plots. ROC curves were used to determine the CSF stage to optimally classify participants into positive/negative in each case (g and h). The optimal cutoff in each case is shown as a vertical dashed line in d and e, respectively. The heat map represents the predicted percentage of participants in each A/T group per CSF stage (i). The most probable (highest percentage) group per CSF stage is framed in black. Progression from CDR = 0 or CDR = 0.5 at baseline to CDR ≥ 1 is shown in j and k and from CDR = 0 to CDR ≥ 0.5 in l and m. Kaplan–Meier curves (shaded area: 95% CI) as well as the number of participants per group and timepoint are shown in j and l. Dashed lines indicate the timepoint at which 50% of a group had progressed. Cox proportional hazards models were used to calculate HR (95% CI) (square and error bars, respectively) of higher CSF stages (4–5) compared to the reference (1–3, k and m). Exact P values shown in the figure are as follows: k: P = 6.2 × 10−6; m: P = 0.00010.
Fig. 7
Fig. 7. CSF stages and disease progression.
Simplified version of the CSF biomarkers trajectory across CSF s nship with disease progression. The text above is hypothetical and is based on previous studies,,,,,.
Extended Data Fig. 1
Extended Data Fig. 1. Creation and optimization of the model in the BioFINDER-2 cohort.
Initial model with all CSF biomarkers (Aβ2/40, pT217/T217, pT231/T231, pT181/T181, pT205/T205, MTBR-tau243 and np-tau) is shown in A. First two columns represent the statistics, CVIC and log-likelihood, of this model for one, two and three subtypes. Each dot in log-likelihood plot represents one of the ten cross-validation sets of data. Lower CVIC and higher log-likelihood values represent better performance of the model. Although higher number of subtypes had higher CVIC, the comparable log-likelihood across subtypes suggests that one subtype is complex enough to explain the variability observed in the data. Cross-validated confusion matrix of the one subtype model is shown in the last column. Here, biomarkers are sorted by the time they become abnormal based on the results of SuStaIn. Darkness represents the probability of that biomarker of becoming abnormal at that position, with black being 100%. Given that some biomarkers (pT217/T217, pT231/T231 and pT181/T181) show high overlap on the ordering, we optimized the model by removing these biomarkers systematically (B). All models without one or two of these biomarkers were tested (models 2 to 7). CVIC (left) and cross-validated confusion matrixes (right) for each of these models are shown in B, respectively. CVIC shows that the optimal model was that excluding both pT231/T231 and pT181/T181 (model 7, shown in C). Both CVIC and log-likelihood measures show that one subtype was the optimal model when using this set of biomarkers. In boxplots, dots represent each of the ten-fold permutations, central band of the boxplot represents the median of the group, the lower and upper hinges correspond to the first and third quartiles, and the whiskers represent the maximum/minimum value or the 1.5 IQR from the hinge, whatever is lower. Abbreviations: Aβ, amyloid-β; CVIC, cross-validation information criterion; MTBR, microtubule binding region; np-tau, non-phosphorylated mid-region tau; pT, phosphorylated tau; SuStaIn, subtype and stage inference.
Extended Data Fig. 2
Extended Data Fig. 2. Demographic, genetic and clinical characteristics by CSF stage.
Depiction of basic characteristics of BioFINDER-2 (A-E) and Knight-ADRC (F-J) by CSF stage. Kruskal-Wallis or chi-square tests were used to investigate the association between each of these characteristics and CSF stages. Two-sided p-values of these tests are shown at the top right of each subplot. Number of individuals in each category are shown inside the barplots. Black central dot and vertical lines in A, B, F and G represent the mean and two standard deviations of each stage, respectively. Abbreviations: AD, Alzheimer’s disease; ADD+, Alzheimer’s disease dementia amyloid positive; CU-, cognitively unimpaired amyloid negative; CU+, cognitively unimpaired amyloid positive; CSF, cerebrospinal fluid; MCI+, mild cognitive impairment amyloid positive; nonAD, non-Alzheimer’s related disease; other Dem, non-Alzheimer’s type dementia.
Extended Data Fig. 3
Extended Data Fig. 3. Model stability.
Depiction of the evolution of CSF stages in BioFINDER-2 (n = 220, A-B) and Knight-ADRC participants (n = 51, C-D) with longitudinal CSF available. As longitudinal CSF Aβ42/40 levels were not available for any BioFINDER-2 participant, we imputed this data with their baseline levels. We show the number of progressors, regressors and stable participants in A and C, for each cohort respectively. In B and D, we further show the CSF stages at follow-up. For those Knight-ADRC with more than one longitudinal visit we took the one more distant from the baseline. Abbreviations: Aβ, amyloid-β; CSF, cerebrospinal fluid.
Extended Data Fig. 4
Extended Data Fig. 4. Tau-PET binding in different Braak regions by CSF stages.
Depiction of tau-PET binding in different areas of tau deposition, by CSF stage in all BioFINDER-2 (A) and Knight-ADRC participants (B). These areas include regions of early (Braak I-II), intermediate (Braak II-IV) and late (Braak V-VI) tau deposition. Tau-PET levels are z-scored based on a group of CU- participants (BioFINDER-2: n = 63 and Knight-ADRC: n = 71) and all increases represent increase in abnormality. Significant differences in contiguous CSF stages are shown with asterisks (two-sided, FDR-corrected). Horizontal line is drawn at z-score = 1.96 which represents 95%CI of the reference group (CU-). Black central dot and vertical lines in A, and C represent the mean and two standard deviations of each stage, respectively. Colored lines and bands represent the LOESS regression and its 95%CI. Smoothed LOESS lines of all AD biomarkers are shown in B (BioFIDNER-2) and D (Knight-ADRC) for comparison. CSF stage 0 represent being classified as normal by the model. *: p < 0.05; **: p < 0.01; ***: p < 0.001. Exact p-values shown in the figure are, Braak I-II: 2-3: p = 5.8·10−7; 3-4: p = 9.2·10−13; 4-5: p = 0.041; Braak III-IV: 2-3: p = 0.0007; 3-4: 3-4: p = 5.8·10−11; Braak V-VI: 2-3: p = 0.0005; 3-4: p = 6.3·10−7; for BioFINDER-2; and: Braak I-II: 3-4: p = 1.4·10−6; Braak III-IV: 3-4: p = 5.2·10−10; for Knight-ADRC. Abbreviations: Aβ, amyloid-β; AD, Alzheimer’s disease; CI, confidence interval; CU-, cognitively unimpaired amyloid negative; CSF, cerebrospinal fluid; LOESS, locally estimated scatterplot smoothing; PET, positron emission tomography; ROI, region of interest.
Extended Data Fig. 5
Extended Data Fig. 5. Cognitive composites by CSF stages.
Depiction of different cognitive measures, by CSF stage in BioFINDER-2 (A) and Knight-ADRC participants (B). These measures include: mPACC (ADAS-delayed, animal fluency, MMSE and TMT-A), memory (ADAS-delayed and ADAS-immediate), executive function (TMT-A, TMT-B and symbols digit), language (animal fluency and BNT-15) and visuospatial (VOSP-cube and VOSP-incomplete) for BioFINDER-2. For Knight-ADRC we had a global cognitive composite (FCSRT, animals, TMT-A and TMT-B), an executive function composite (TMT-A and TMT-B), a memory (FCSRT) and language (animal fluency) tests. Cognitive scores are z-scored based on a group of CU- participants (BioFINDER-2: n = 60 and Knight-ADRC: n = 71) and all increases represent increase in abnormality. Significant differences in contiguous CSF stages are shown with asterisks (two-sided, FDR-corrected). Horizontal line is drawn at z-score = 1.96 which represents 95%CI of the reference group (CU-). Black central dot and vertical lines in A and C represent the mean and two standard deviations of each stage, respectively. Colored lines and bands represent the LOESS regression and its 95%CI. Smoothed LOESS lines of all AD biomarkers are shown in B (BioFIDNER-2) and D (Knight-ADRC) for comparison. We excluded non-AD dementia patients to avoid bias in these analyses. CSF stage 0 represents being classified as normal by the model. *: p < 0.05; **: p < 0.01; ***: p < 0.001. Exact p-values shown in the figure are, mPACC: 2-3: p = 0.004; 3-4: p = 0.002; 4-5: p = 0.0008; Memory: 0-1: p = 0.049; 2-3: p = 0.045; 3-4: p = 0.0002; 4-5: p = 0.011; Language: 4-5: p = 0.001; for BioFINDER-2; and Executive: 1-2: p = 0.044; Language: 3-4: p = 0.019 for Knight-ADRC. Abbreviations: AD, Alzheimer’s disease; ADAS, Alzheimer’s disease assessment scale; BNT, Boston naming test; CI, confidence interval; CU-, cognitively unimpaired amyloid negative; CSF, cerebrospinal fluid; FCSRT, free and cued selective reminding test; LOESS, locally estimated scatterplot smoothing; MMSE, Mini-Mental state examination; mPACC, modified version of preclinical Alzheimer’s disease cognitive composite; TMT, trial making test; VOSP, visual object and space perception battery.
Extended Data Fig. 6
Extended Data Fig. 6. Individual CSF stages for predicting clinical progression.
Kaplan-Meier curves (shaded area: 95%CI) for all individual CSF stages in BioFINDER-2 (A-C) and Knight-ADRC (D-E) participants. For BioFINDER-2, progression from CU or MCI at baseline to AD dementia is shown in A; progression from MCI at baseline to AD dementia is shown in B and; progression from CU at baseline to MCI is shown in C. For Knight-ADRC, progression from CDR = 0 or CDR = 0.5 at baseline to CDR≥1 is shown in D and; progression from CDR = 0 at baseline to CDR≥0.5 is shown in E. Abbreviations: AD, Alzheimer’s disease; CDR, clinical dementia rating; CSF, cerebrospinal fluid; CU, cognitively unimpaired; MCI, mild cognitive impairment.
Extended Data Fig. 7
Extended Data Fig. 7. Individual biomarker levels by CSF stage in Knight-ADRC participants.
Individual CSF biomarker levels, included in the model, by CSF stage participants are shown in A including all Knight-ADRC participants. Depiction of individual AD-biomarker levels, not used in the creation of the model, per CSF stage are shown in B. All biomarker levels are z-scored based on a group of CU- participants (n = 71) and all increases represent increase in abnormality. Significant differences in contiguous CSF stages are shown with asterisks (two-sided, FDR-corrected). Horizontal line is drawn at z-score = 1.96 which represents 95%CI of the reference group (CU-). Black central dot and vertical lines represent the mean and two standard deviations of each stage, respectively. Colored lines and bands represent the LOESS regression and its 95%CI. CSF stage 0 represent being classified as normal by the model. Black dots and vertical lines represent mean and SD per CSF stage. *: p < 0.05; **: p < 0.01; ***: p < 0.001. Exact p-values shown in the figure are, Amyloid-PET: 2-3: p = 0.003; 3-4: p = 0.005; Tau-PET: 3-4: p = 4.4·10−10; Cortical thickness: 2-3: p = 0.007; 3-4: p = 3.0·10−5; 4-5: p = 0.032; CSF NfL: 2-3: p = 0.35. Abbreviations: Aβ, amyloid-β; CI, confidence interval; CU-, cognitively unimpaired amyloid negative; CSF, cerebrospinal fluid; MMSE, Mini-Mental state examination; MTBR, microtubule binding region; NfL, neurofilament light; PET, positron emission tomography; np-tau, non-phosphorylated mid-region tau; pT, phosphorylated tau; SuStaIn, subtype and stage inference.
Extended Data Fig. 8
Extended Data Fig. 8. Excluded CSF biomarkers by CSF stage.
Depiction of the CSF biomarkers excluded in the optimal model (pT231/T231 and pT181/T181) by CSF stage in BioFINDER-2 (A-B) and Knight-ADRC (C-D) participants. CSF pT217/T217 is also shown for comparison. CSF levels are z-scored based on a group of CU- participants (BioFINDER-2: n = 63, Knight-ADRC: n = 71) and all increases represent increase in abnormality. Significant differences in contiguous CSF stages are shown with asterisks (two-sided, FDR-corrected). Horizontal line is drawn at z-score = 1.96 which represents 95%CI of the reference group (CU-). Black central dot and vertical lines in A and C represent the mean and two standard deviations of each stage, respectively. Colored lines and bands represent the LOESS regression and its 95%CI. Smoothed LOESS lines of all CSF biomarkers are shown in B (BioFIDNER-2) and D (Knight-ADRC) for comparison. CSF stage 0 represent being classified as normal by the model. Black dots and vertical lines represent mean and SD per CSF stage, respectively. *: p < 0.05; **: p < 0.01; ***: p < 0.001. Exact p-values shown in the figure are, pT217/T217: 1-2: p = 3.7·10−15; 2-3: p = 3.1·10−5; 3-4: p = 3.3·10−12; 4-5: p = 4.7·10−10; pT181/T181: 1-2: p = 1.3·10−7; 3-4: p = 1.8·10−7; 4-5: p = 1.8·10−7pT231/T231: 0-1: p = 0.0004; 1-2: p = 2.9·10−9; 3-4: p = 9.8·10−5; 4-5: p = 0.007 for BioFINDER-2; and pT217/T217: 0-1: p = 0.041; 1-2: p = 0.0004; 2-3: p = 0.0008; 3-4: p = 3.7·10−6; pT181/T181: 1-2: p = 0.006; 4-5: p = 0.012; pT231/T231: 1-2: p = 0.0019 for Knight-ADRC. Abbreviations: Aβ, amyloid-β; CI, confidence interval; CU-, cognitively unimpaired amyloid negative; CSF, cerebrospinal fluid; LOESS, locally estimated scatterplot smoothing; MTBR, microtubule binding region; np-tau, non-phosphorylated mid-region tau; pT, phosphorylated tau; SuStaIn, subtype and stage inference.

References

    1. GBD 2019 Dementia Forecasting Collaborators. Estimation of the global prevalence of dementia in 2019 and forecasted prevalence in 2050: an analysis for the Global Burden of Disease Study 2019. Lancet Public Health7, e105–e125 (2022). - PMC - PubMed
    1. Scheltens P, et al. Alzheimer’s disease. Lancet. 2016;388:505–517. doi: 10.1016/S0140-6736(15)01124-1. - DOI - PubMed
    1. Villemagne VL, et al. Amyloid-β deposition, neurodegeneration, and cognitive decline in sporadic Alzheimer’s disease: a prospective cohort study. Lancet Neurol. 2013;12:357–367. doi: 10.1016/S1474-4422(13)70044-9. - DOI - PubMed
    1. Hansson, O. Biomarkers for neurodegenerative diseases. Nat. Med.27, 954–963 (2021). - PubMed
    1. Leuzy A, et al. Biomarker-based prediction of longitudinal tau positron emission tomography in Alzheimer disease. JAMA Neurol. 2022;79:149–158. doi: 10.1001/jamaneurol.2021.4654. - DOI - PMC - PubMed