. 2024 Apr;25(4):703-715.
doi: 10.1038/s41590-024-01782-4. Epub 2024 Mar 21.

An immunophenotype-coupled transcriptomic atlas of human hematopoietic progenitors

Affiliations

An immunophenotype-coupled transcriptomic atlas of human hematopoietic progenitors

Xuan Zhang et al. Nat Immunol. 2024 Apr.

Abstract

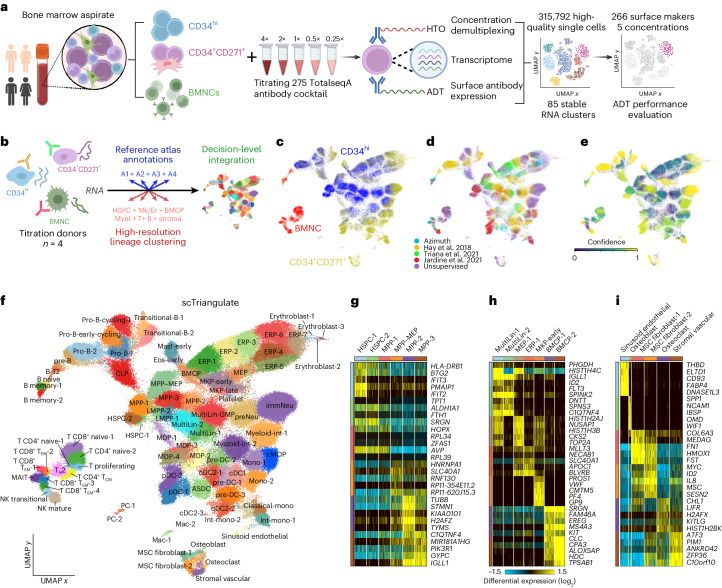
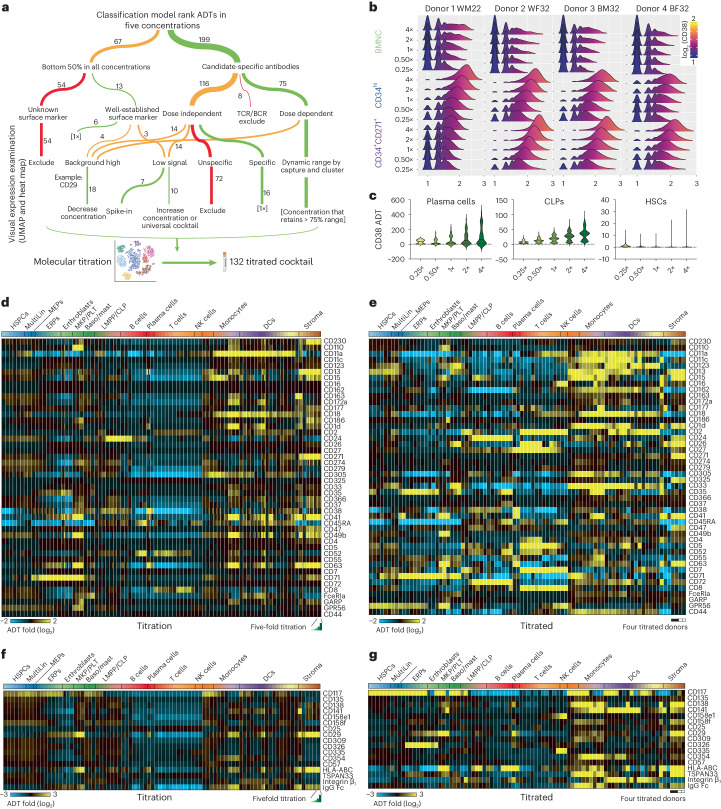
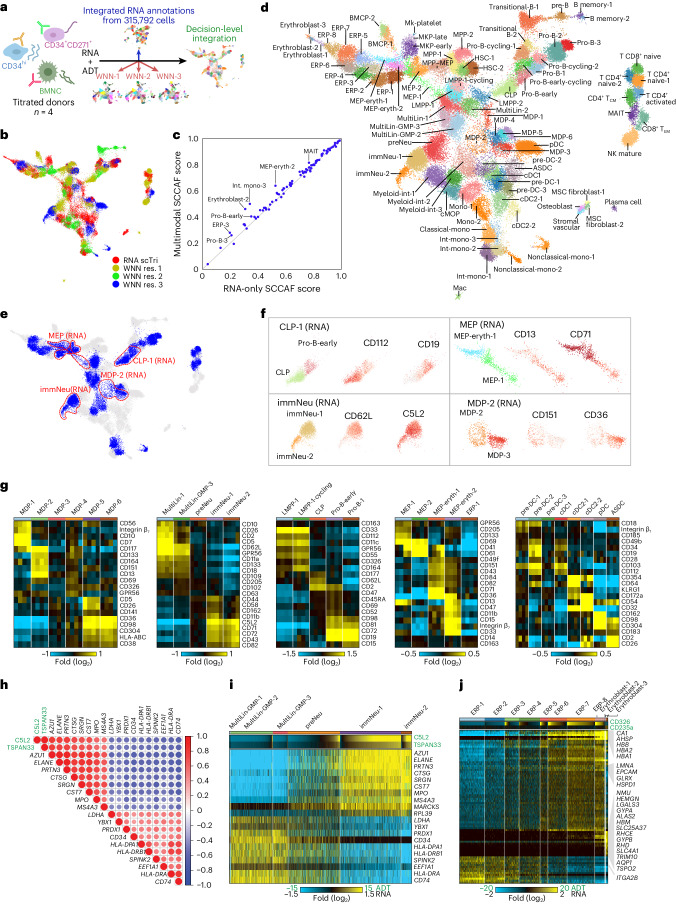
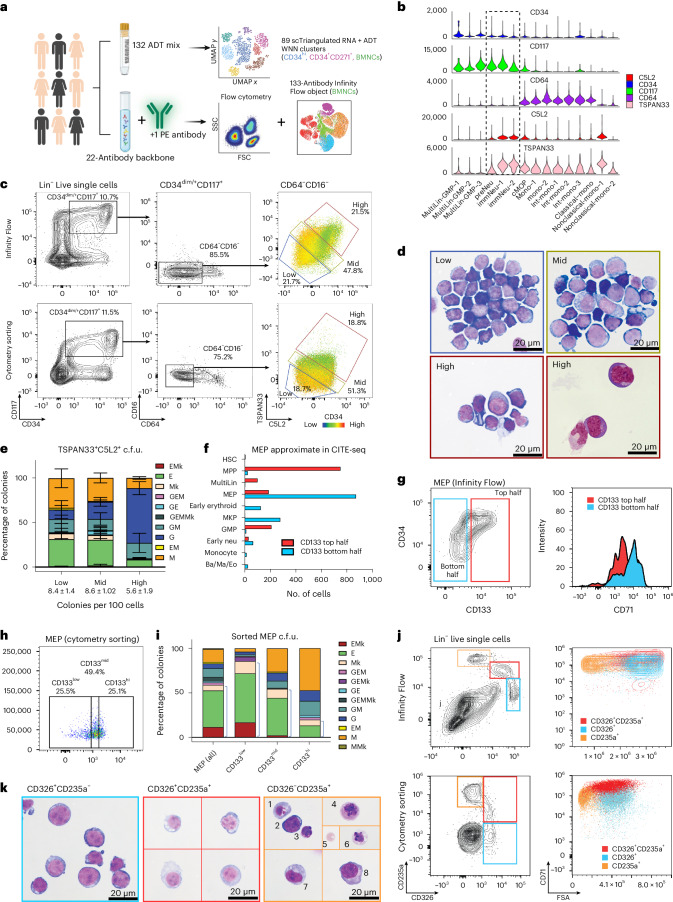
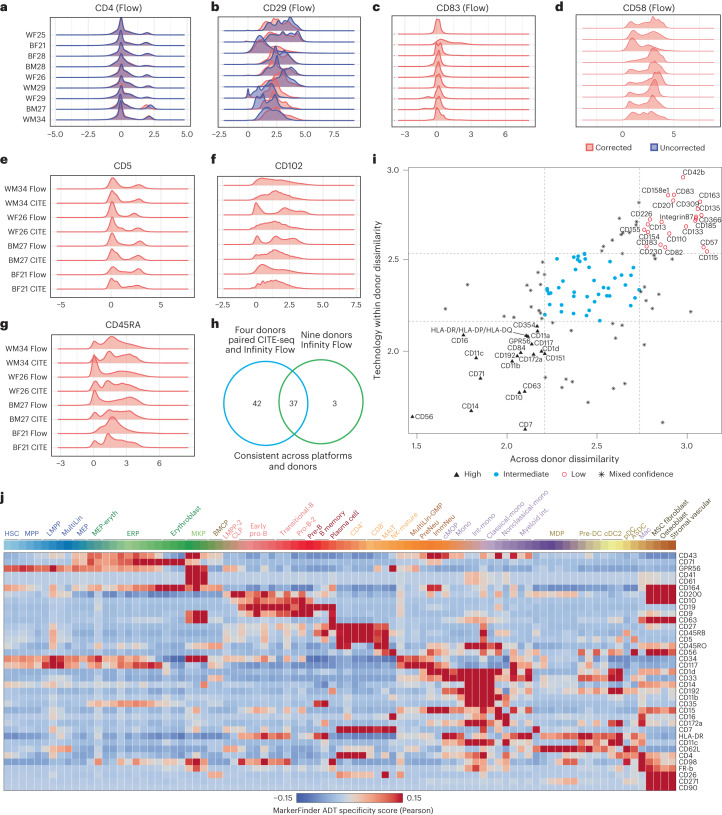
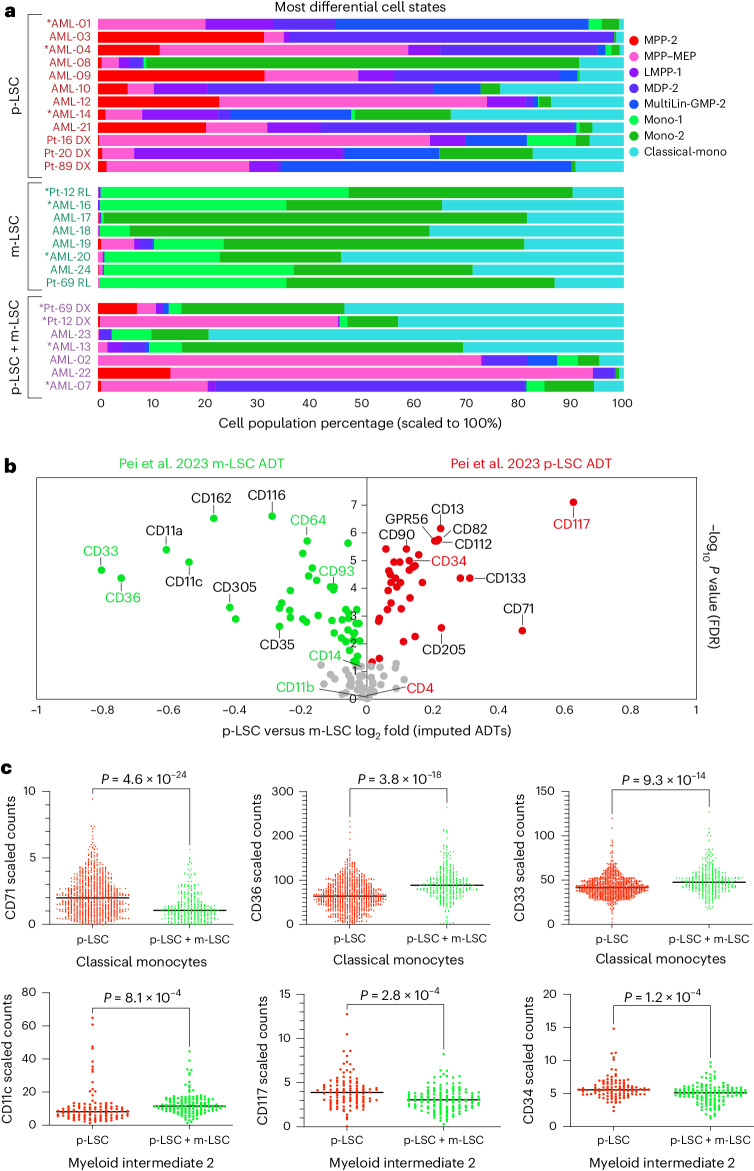
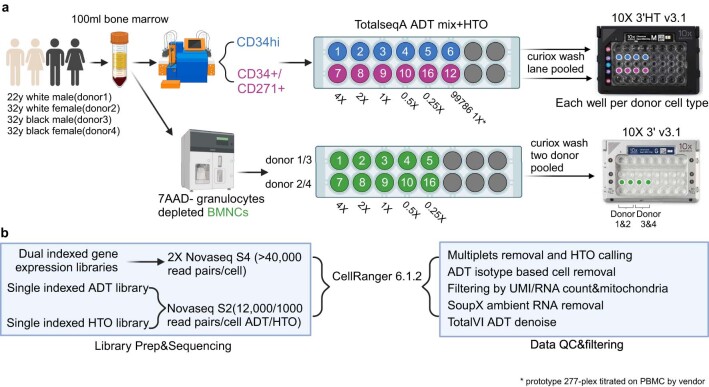
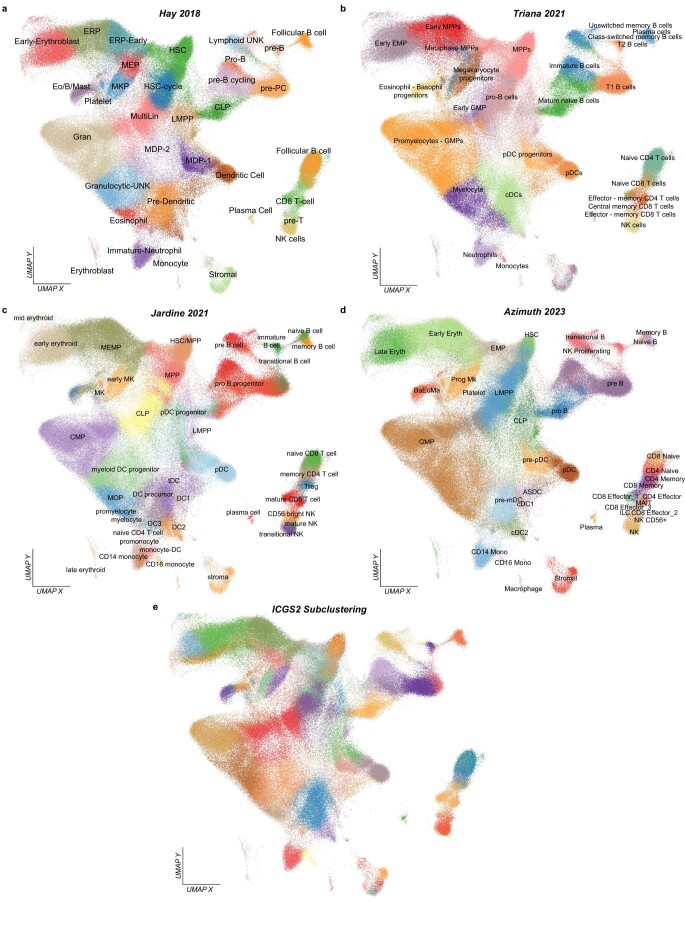
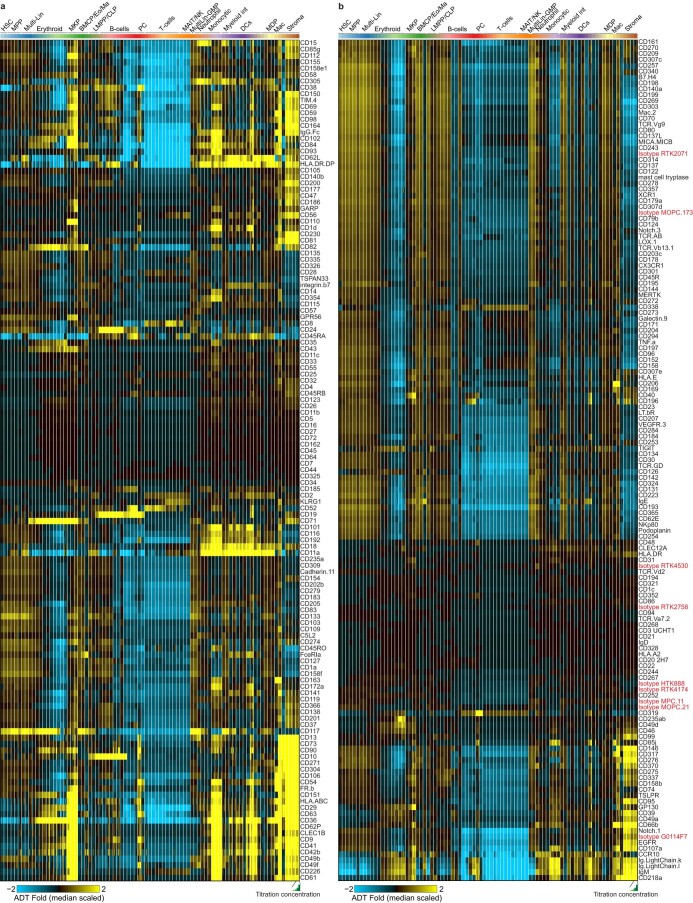
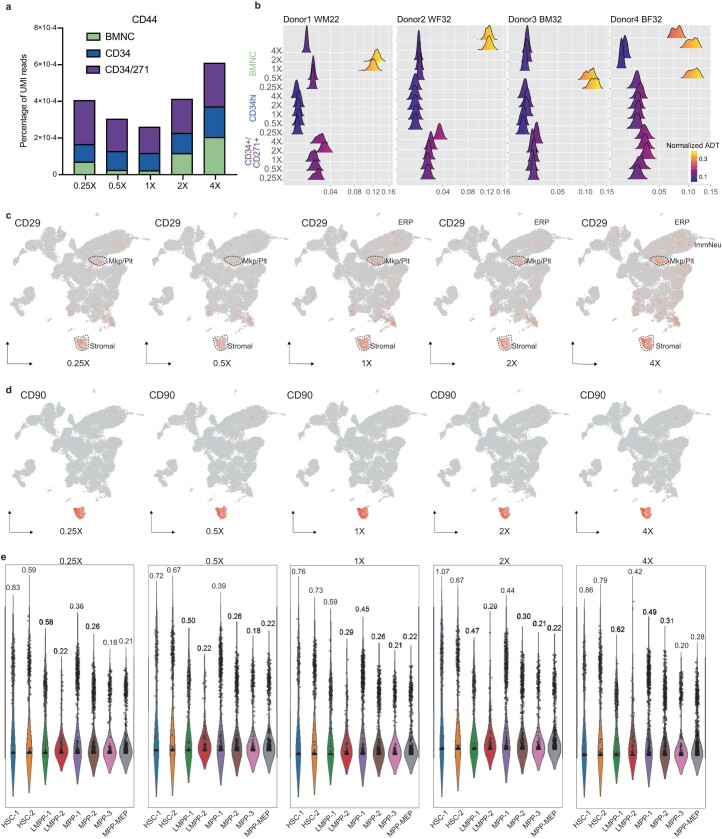
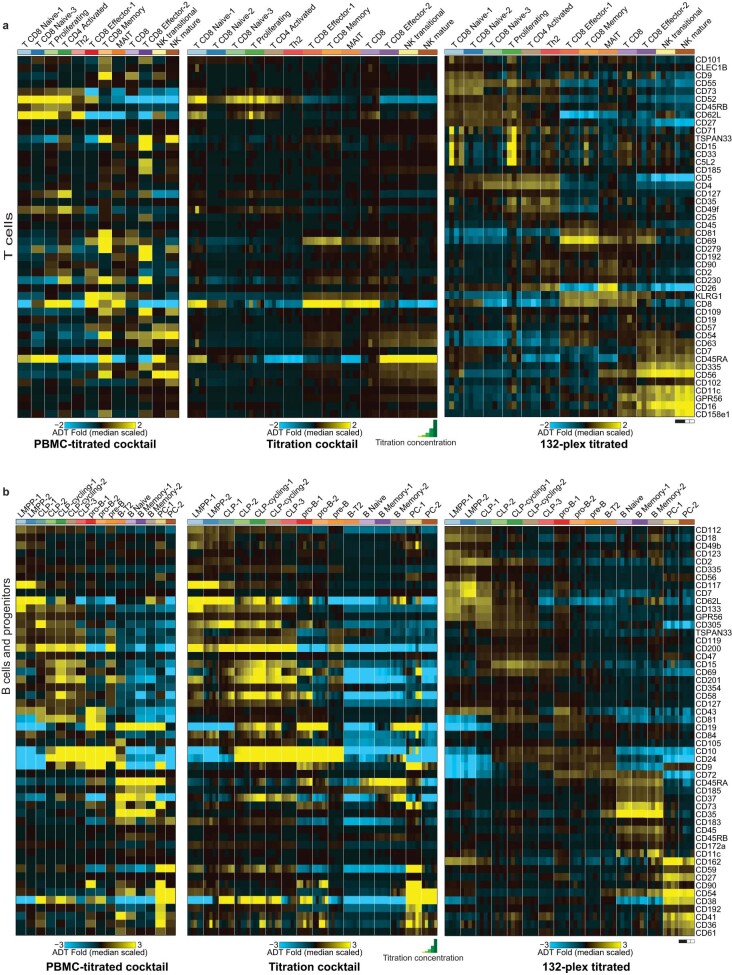
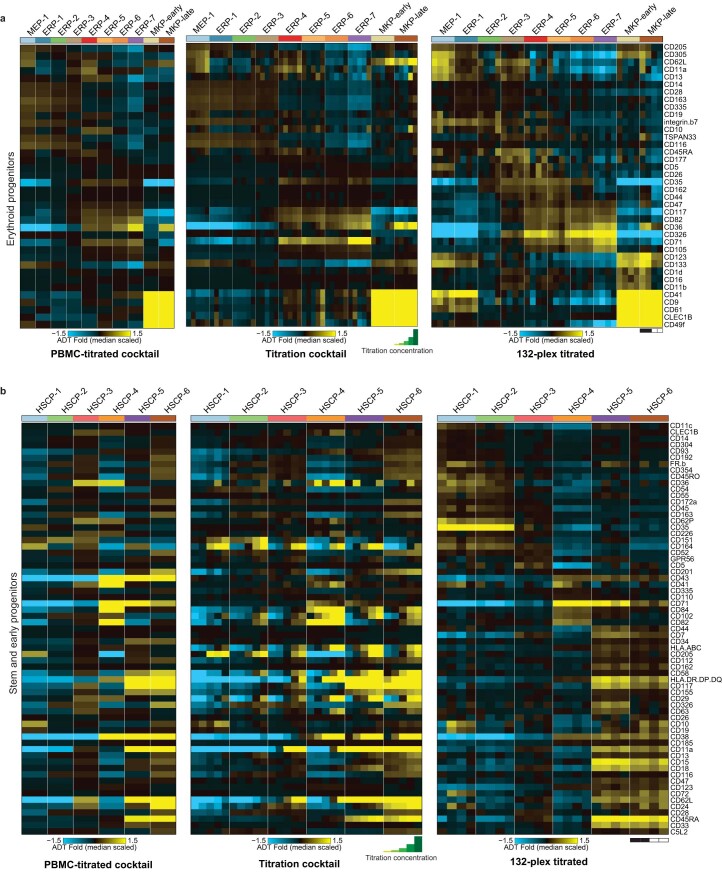
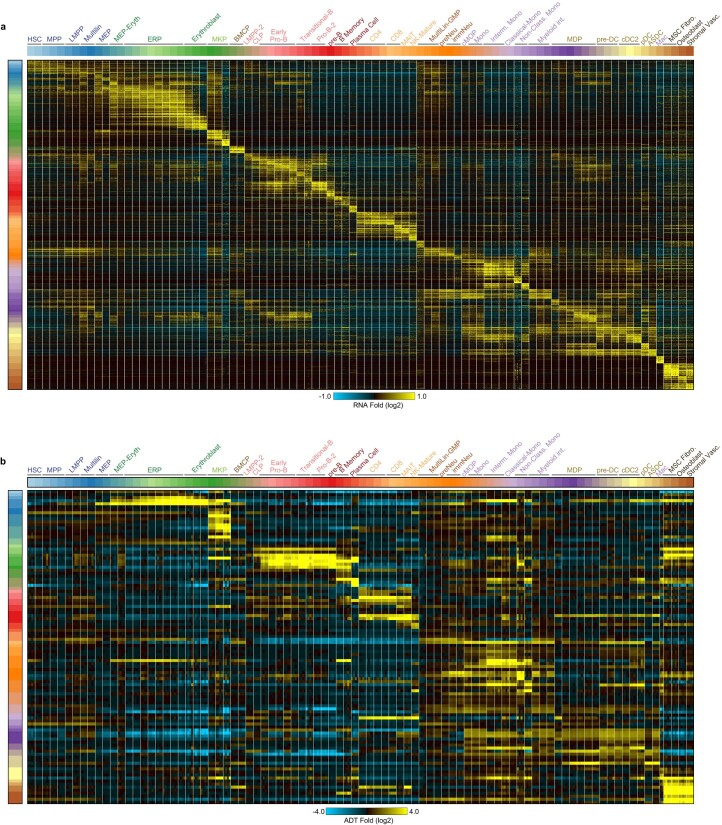
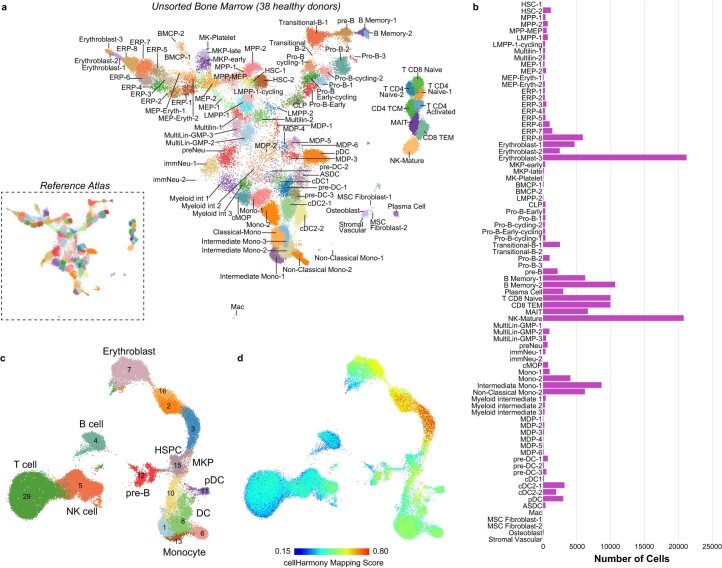
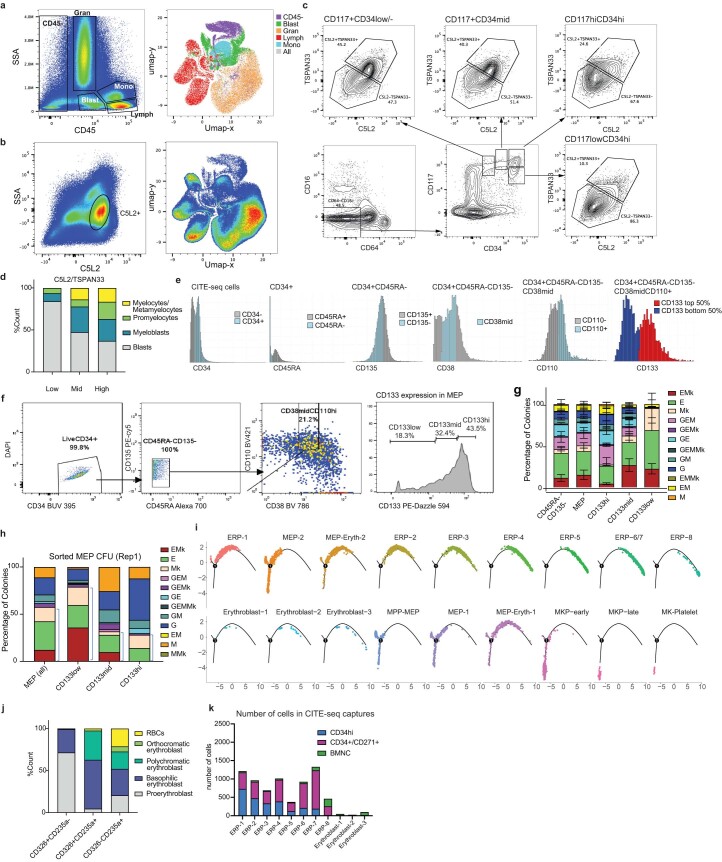
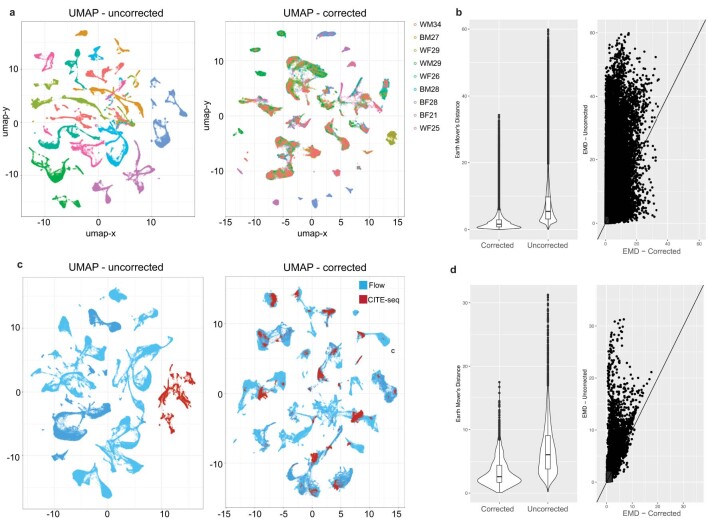
Analysis of the human hematopoietic progenitor compartment is being transformed by single-cell multimodal approaches. Cellular indexing of transcriptomes and epitopes by sequencing (CITE-seq) enables coupled surface protein and transcriptome profiling, thereby revealing genomic programs underlying progenitor states. To perform CITE-seq systematically on primary human bone marrow cells, we used titrations with 266 CITE-seq antibodies (antibody-derived tags) and machine learning to optimize a panel of 132 antibodies. Multimodal analysis resolved >80 stem, progenitor, immune, stromal and transitional cells defined by distinctive surface markers and transcriptomes. This dataset enables flow cytometry solutions for in silico-predicted cell states and identifies dozens of cell surface markers consistently detected across donors spanning race and sex. Finally, aligning annotations from this atlas, we nominate normal marrow equivalents for acute myeloid leukemia stem cell populations that differ in clinical response. This atlas serves as an advanced digital resource for hematopoietic progenitor analyses in human health and disease.


Conflict of interest statement

J.C. and O.S. declare that they are employees and stakeholders of BioLegend. The other authors declare no competing interests.

Figures

Fig. 1
Fig. 1. An integrative transcriptomic atlas of human bone marrow cell states.
a, Bone marrow aspirate cell isolation and titration experimental workflow. b, Scheme for the integration of prior reference cell annotation labels (cellHarmony and Azimuth) with unsupervised clustering of 315,792 bone marrow cells using scTriangulate based on RNA. c, Uniform manifold approximation and projection (UMAP) of the source cell isolation enrichment approach for cells from four healthy donors. d, Final scTriangulate clusters annotated by the reference study annotation source. e, scTriangulate stability confidence score from the integration (Shapley confidence score). f, Transcriptome-defined cluster annotations based on the source clusters and marker genes. gi, Top RNA-defined marker genes in HSPCs (g), presumptive multilineage progenitors (h) and stromal cells (i). Abbreviations: BMCP, basophil/mast cell progenitor; Mk, megakarocyte; Er, erythroid; Myel, myeloid; MultiLin, multi-lineage progenitor; TEM, effector memory T cell; TCM, central memory T cell; MAIT, mucosal-associated invariant T cell; MPP, multipotent progenitors; Eos, eosinophils; MKP, megakaryocyte progenitor; ASDC, AXL+SIGLEC6+ DC; Mono, monocyte; cMOP, common monocyte progenitor; Mac, macrophage; MSC, mesenchymal stem cell; Neu, neutrophil; PC, plasma cell; int, intermediate.
Fig. 2
Fig. 2. An optimized antibody cocktail for bone marrow progenitor characterization.
a, Decision tree to nominate ADTs and optimal working concentration; TCR, T cell antigen receptor; BCR, B cell receptor. b, Distribution of CD38 ADT abundance (x axis) with changes in titration by capture and concentration (y axis). c, Cell population-specific detection of CD38 by concentration. dg, Heat map of ADT expression by cell state and concentration for ADTs with improved detection in the 132 titrated cocktail (e and g) versus the titrations (d and f). ADTs for which concentrations were increased (d and e) or decreased (f and g) in the titrated mix are shown. Each cluster column of titration data (d and f) consists of five columns representing 0.25× to 4× relative to the ‘working’ concentration in the 275-plex titration mix. Each cluster column of titrated data (e and g) consists of four columns representing the donors in the order of African ancestry female, African ancestry male, European ancestry female and European ancestry male, respectively; Baso/mast, basophil/mast cell; PLT, platelets.
Fig. 3
Fig. 3. A multimodal progenitor cell atlas links surface markers with lineage specification.
a, Schematic showing the multimodal cluster integration strategy from multiple clustering resolutions (MUON WNN) and transcriptome-defined cell states (scTriangulate). b, The most stable clusters defined by annotation source in the final scTriangulate (scTri) integration. c, Reclassification accuracy (SCCAF statistic) for the final scTriangulate clusters with (multimodal) and without considering ADT (RNA only). d, UMAP projection and annotation of the final 89 scTriangulate clusters. e, UMAP indicating multimodal scTriangulate clusters that were further separated with the addition of ADTs versus transcriptome-only clustering (see Fig. 1c). ‘Split’ clusters are indicated in blue, and populations outlined in red correspond to those in f. f, UMAP of example cell populations selectively resolved by the addition of ADTs. Exemplar ADTs are shown; red, relative expression; gray, no expression. g, Heat map of distinguishing ADT markers (MarkerFinder algorithm) for selected predicted lineage subsets. h, Pearson pairwise gene and ADT correlation similarity matrix dot plot for the top correlated and anticorrelated genes with C5L2 and TSPAN33 ADT expression among GMPs, preNeu and immNeus; green, ADTs. i, Heat map showing the relative abundance of C5L2 and TSPAN33 in granulocyte progenitors and correlated marker gene relative expression (median normalized). j, Heat map showing the relative abundance of CD326 and CD235a in ERPs and correlated marker gene relative expression (median normalized); eryth, erythroid; cMOP, common monocyte progenitor; cDC, classical DC. Source data
Fig. 4
Fig. 4. Identification of markers to dissect transitional cell states.
a, Illustration of the donor cohort and Infinity Flow experimental design. b, Expression of surface markers that could enable purification of committed granulocyte progenitors. c, Proposed gating for C5L2+TSPAN33+ cells in Infinity Flow (top) and representative cytometry sorting (bottom). d, Cytospin morphology of cells sorted based on C5L2+TSPAN33+ expression, Wright–Giemsa staining of low (top left), mid (top right) and high (bottom left) and Quick III staining of high (bottom right). e, Differentiation potential of C5L2+TSPAN33+ sorted cells by c.f.u. assay. Data are shown as mean ± s.d. f, Cell composition in a virtually gated MEP subset by CD133 expression in CITE-seq data; Ba/Ma/Eo, basophil/mast cell/eosinophil; Neu, neutrophil. g, CD71 expression in immunophenotypically defined MEPs by CD133 expression in Infinity Flow. h, MEP subset by CD133 expression in cytometry sorting. i, c.f.u. readout of MEP cells sorted based on CD133 expression from the donor in h (data from the other donor are shown in Extended Data Fig. 9h). Blue brackets highlight the proportion of megakaryocytic/erythroid single and bipotential colonies. j, CD326 and CD235a denote three distinct cell populations in Infinity Flow (top) and cytometry sorting (bottom) that are different in cell size and CD71 expression. k, Morphology of sorted cells based on CD326 and CD235a expression; CD326+CD235a, proerythroblasts; CD326+CD235a+, basophilic erythroblasts; CD326CD235a+, (1) reticulocyte, (2) polychromatic erythroblast, (3) orthochromatic erythroblast, (4) basophilic erythroblast, (5) mature RBC, (6) transitioning polychromatic-to-orthochromatic erythroblast, (7) orthochromatic erythroblast and (8) orthochromatic erythroblast. The Infinity Flow object shown is representative of donor WM29. The data from the c.f.u. assays are the results of three replicates from two donors either combined (e) or displayed individually (i). Data in d and k are representative of ten high-power fields (differential count in Extended Data Fig. 9); c.f.u. types: granulocytic (G), monocytic (M), erythroid (E) and megakaryocytic (Mk) cells. Source data
Fig. 5
Fig. 5. Variation of surface marker expression across donors and between technologies.
a, Consistent expression pattern of CD4 presented in a ridge plot before and after correction in nine donors. b, Inconsistent expression of CD29 presented in a ridge plot before and after correction in nine donors. c, CD83 corrected expression presented in a ridge plot is consistent across eight donors. d, CD58 corrected expression presented in a ridge plot is inconsistent across donors. e, Consistent expression of CD5 across technologies and donors. f,g, Varied expression distribution in both donors and across technologies (CD102 (f) and CD45RA (g)). h, Venn diagram showing surface markers that exhibit consistent expression across donors and technologies by ridge plot distribution visualization. i, Surface marker expression dissimilarity examined by Anderson–Darling testing. Across donor (x axis) and technology within donor (y axis) distribution dissimilarity for n = 132 markers (see Methods). Dissimilarity values are the log10-transformed values of the Anderson–Darling test t values. j, Heat map showing the correlation of 37 highly consistent surface markers from h with multimodal clusters from titrated data. The batch effect correction was performed with cyCombine; pDC, plasmacytoid DC. Source data
Fig. 6
Fig. 6. AML LSCs align with distinct healthy multilineage progenitors.
CITE-seq bone marrow biopsies from individuals with AML with prior evidence of p-LSCs (sensitive to venetoclax/azacytidine), m-LSCs (resistant to venetoclax/azacytidine) or both (p-LSCs + m-LSCs) aligned to our multimodal atlas (Azimuth). a, Cell frequency was compared between AML captures. Asterisks (*) indicate that the sample LSC type was validated by xenograft. b, Differences in imputed cell surface ADT abundance (Azimuth) comparing p-LSC to m-LSC AML CITE-seq biopsies. Corresponding differentially expressed ADTs from the original study CITE-seq datasets are indicated in green (m-LSC enriched) or red (p-LSC enriched). c, Example of differentially expressed surface markers in p-LSC (n = 2) versus p-LSC + m-LSC (n = 1) samples for ADT TotalVI scaled counts within the indicated mapped cell states. Dots represent individual cells. Displayed P values were computed from a two-sided empirical Bayes moderated t-test (FDR corrected). Source data
Extended Data Fig. 1
Extended Data Fig. 1. Experimental and bioinformatic of molecular titration workflow.
a, Schematic showing sample processing, HTO multiplex strategy and 10X Chromium X loading workflow. b, Sequencing specifications and data pre-processing workflow. Sequencing metrics in Supplementary Table 3.
Extended Data Fig. 2
Extended Data Fig. 2. Divergent bone marrow single-cell annotations by study.
a-e) UMAP of single-cell annotations by studies derived through reference label projection (cellHarmony) (a-d) or unsupervised sub-clustering (ICGS2) (e). The reference source annotations are indicated by first author and year of publication, where provided.
Extended Data Fig. 3
Extended Data Fig. 3. Heatmaps of all ADTs in the optimized titration atlas.
a, Heatmap of 132 ADTs in the titrated CITE-Seq ADT mix. b, Heatmap of ADTs excluded and isotypes controls (highlighted in red).
Extended Data Fig. 4
Extended Data Fig. 4. Additional examples of ADT concentration optimization.
a, Percentage of CD44 ADT UMI counts in cells by capture and concentration. b, Ridgeplot examination of CD44 dynamic range by capture. Row heights vary based on expression. c, Specificity of CD29 ADT evaluated on UMAP at five titration concentrations. d, Specificity of CD90 ADT evaluated by UMAP visualization at five titration concentrations. e, Violin plots of CD90 ADT expression in stem cell populations. Mean shown on top of each plot.
Extended Data Fig. 5
Extended Data Fig. 5. ADT marker specificity in lymphoid lineages.
Top ADT markers examined in the PBMC-titrated cocktail (left, average expression of four titration donors), customized titration cocktail (middle, average expression of four titration donors at each concentration from low to high) and 132-plex titrated cocktail (right, average expression of each titrated donors, color decodes race) in T (a), B (b).
Extended Data Fig. 6
Extended Data Fig. 6. ADT marker specificity in stem and progenitors.
Heatmap of the top ADT markers in erythroid/megakaryocytic (a) lineages and HSPCs (b).
Extended Data Fig. 7
Extended Data Fig. 7. CITE-Seq titrated cell populations are defined by unique mRNA and ADT markers.
Heatmap of the top 60 transcriptome (a) or top 5 surface epitope (b) markers from the software AltAnalyze (MarkerFinder algorithm) for all scTriangulate annotated clusters. Source data
Extended Data Fig. 8
Extended Data Fig. 8. Validation of CITE-Seq evidenced cell populations in bone marrow biopsies from 38 donors.
a, Projected UMAP of 242,832 healthy bone marrow mononuclear cells (10x Genomics Chromium platform) from the aggregate of three prior studies to our CITE-Seq fully titrated bone marrow reference. The reference CITE-Seq clusters used for label transfer and UMAP coordinate projection are shown in the inset. b, Bone marrow cell frequencies of all unsorted cells from 38 healthy donors. c, UMAP of unsupervised clustering (ICGS2) of cells from 20 bone marrow healthy donors (GSE120221). d, Projection of CITE-Seq label mapping scores from the software cellHarmony in the UMAP from panel c to infer annotation confidence.
Extended Data Fig. 9
Extended Data Fig. 9. Validation of transitional cell states.
a, Cells in a commonly used clinical diagnostic gate (CD45/SSA) and their presentation on UMAP. b, C5L2 + cells visualized on UMAP. c, CD34+/dim CD117+ cells examined for C5L2 and TSPAN33 expression. d, Cell count by morphology of C5L2/TSPAN33 Low/Mid/High sorted cells. e, Virtually gated ‘MEP’ in CITE-seq data. f, Sorting gate setup in CD133 index sorting. g, CFU readout of indexed sorted cells grouped by CD133 expression. Error bar shows Mean with SD. h, CFU readout of MEP cells sorted based CD133 expression from the other donor. i, Monocle trajectory analysis of erythroid progenitor hierarchy. j. Cell count by morphology in CD326+, CD326 + CD235a+ and CD235a+ sorted cells. k, Number of erythroid progenitors from each CITE-seq capture. Morphology cell counts are based on 10 high-power fields. CFU assays are results of three replicates from two donors either combined (g) or displayed individually (h). Source data
Extended Data Fig. 10
Extended Data Fig. 10. Integration of global CITE-Seq and Infinity Flow antibody profiles.
a, UMAP representation of Infinity Flow objects from each of the 9 different analyzed donors. b, Earth Mover’s Distance (EMD) dissimilarity evaluation of correction within the Infinity Flow data to assess variance between donors (n = 9). c, UMAP indicating the integration of 4 matched CITE-seq and Infinity Flow datasets (n = 4). d, EMD evaluation of correction between CITE-Seq and Infinity Flow for the four matching sample pairs. The Violin plots show the inter-quartile range and outlier cells from the indicated EMD distributions.

References

    1. Chen H, Ye F, Guo G. Revolutionizing immunology with single-cell RNA sequencing. Cell Mol. Immunol. 2019;16:242–249. doi: 10.1038/s41423-019-0214-4. - DOI - PMC - PubMed
    1. Papalexi E, Satija R. Single-cell RNA sequencing to explore immune cell heterogeneity. Nat. Rev. Immunol. 2018;18:35–45. doi: 10.1038/nri.2017.76. - DOI - PubMed
    1. Oetjen, K. A. et al. Human bone marrow assessment by single-cell RNA sequencing, mass cytometry, and flow cytometry. JCI Insight3, e124928 (2018). - PMC - PubMed
    1. Zhu YP, et al. Identification of an early unipotent neutrophil progenitor with pro-tumoral activity in mouse and human bone marrow. Cell Rep. 2018;24:2329–2341. doi: 10.1016/j.celrep.2018.07.097. - DOI - PMC - PubMed
    1. Pellin D, et al. A comprehensive single cell transcriptional landscape of human hematopoietic progenitors. Nat. Commun. 2019;10:2395. doi: 10.1038/s41467-019-10291-0. - DOI - PMC - PubMed