. 2024 Mar 21;14(1):37.
doi: 10.1186/s13578-024-01218-4.

Revealing the role of SPP1+ macrophages in glioma prognosis and therapeutic targeting by investigating tumor-associated macrophage landscape in grade 2 and 3 gliomas

Affiliations

Revealing the role of SPP1+ macrophages in glioma prognosis and therapeutic targeting by investigating tumor-associated macrophage landscape in grade 2 and 3 gliomas

Wenshu Tang et al. Cell Biosci. .

Abstract

Background: Glioma is a highly heterogeneous brain tumor categorized into World Health Organization (WHO) grades 1-4 based on its malignancy. The suppressive immune microenvironment of glioma contributes significantly to unfavourable patient outcomes. However, the cellular composition and their complex interplays within the glioma environment remain poorly understood, and reliable prognostic markers remain elusive. Therefore, in-depth exploration of the tumor microenvironment (TME) and identification of predictive markers are crucial for improving the clinical management of glioma patients.

Results: Our analysis of single-cell RNA-sequencing data from glioma samples unveiled the immunosuppressive role of tumor-associated macrophages (TAMs), mediated through intricate interactions with tumor cells and lymphocytes. We also discovered the heterogeneity within TAMs, among which a group of suppressive TAMs named TAM-SPP1 demonstrated a significant association with Epidermal Growth Factor Receptor (EGFR) amplification, impaired T cell response and unfavourable patient survival outcomes. Furthermore, by leveraging genomic and transcriptomic data from The Cancer Genome Atlas (TCGA) dataset, two distinct molecular subtypes with a different constitution of TAMs, EGFR status and clinical outcomes were identified. Exploiting the molecular differences between these two subtypes, we developed a four-gene-based prognostic model. This model displayed strong associations with an elevated level of suppressive TAMs and could be used to predict anti-tumor immune response and prognosis in glioma patients.

Conclusion: Our findings illuminated the molecular and cellular mechanisms that shape the immunosuppressive microenvironment in gliomas, providing novel insights into potential therapeutic targets. Furthermore, the developed prognostic model holds promise for predicting immunotherapy response and assisting in more precise risk stratification for glioma patients.

Keywords: EGFR; Glioma; Immune suppression; TAM-SPP1; Tumor-associated macrophages.


Conflict of interest statement

All authors declared that there are no competing interest.

Figures
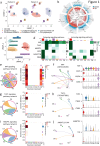
Fig. 1
Fig. 1
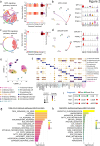
Illustration of cellular communication networks between tumor cells and TAMs in the low-grade glioma microenvironment. a scRNA-seq analysis of glioma patients. UMAP projection of 17,687 single cells isolated from tumor tissues, coloured by graph-based cell clusters and inferred cell types. b Volcano plot showing significantly upregulated or downregulated genes in each cluster, with the top three markers for each cluster highlighted. c UMAP projection of 17,687 single cells coloured according to automated cell type annotation by “ScType”. d Heatmap revealing the major MIF, THY1, ANGPTL, SPP1, GALECTIN and PDGF signals that significantly contribute to outgoing or incoming signaling for specific cell groups. e, g, i Chord plots and heatmaps showing significantly interacting pathways and communication probabilities of MIF (e), THY1 (g) and ANGPTL (i) pathways between tumor cells and TAMs in glioma TME. f, h, j Circle and violin plots depicting ligand-receptor pairs in each pathway and their respective expression patterns in each cell cluster
Fig. 2
Fig. 2
Illustration of cellular communication network between TAMs and lymphocytes as well as the characterization of TAM subsets in glioma patients. a, c Chord plots and heatmaps displaying significantly interacting pathways (SPP1 and GALECTIN) and communication probabilities between TAMs and lymphocytes in glioma TME. b, d Circle plots and violin plots indicating the ligand-receptor pairs in SPP1 and GALECTIN pathways and their expression patterns across cell clusters. e UMAP coloured by graph-based cell clusters and inferred cell types at an increased resolution. f Dot plot displaying three canonical markers among the top differentially expressed genes across clusters. g, h Hallmark pathway analysis showing the top 15 enriched categories of differentially expressed genes in TAM-CCL3 (g) and TAM-SPP1 (h) (Log2FC > 0.25, p < 0.05, n = 338 and 476) compared with other TAM subsets, coloured by normalized enrichment scores (NES) score. i Clinical prognostic prediction values for each TAM subtype in TCGA glioma patients. (with median value of gene expression used as cut-off. Green: high expression of biomarkers associated with better survival; red: high expression of biomarkers associated with poor survival ; ns: not significant)
Fig. 3
Fig. 3
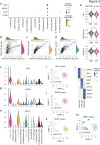
Characterization of distinct functions and diversely activated transcription factors within TAM subsets. a Dot plot indicating the expression of T cell exhaustion markers in each cluster of the glioma single cell dataset. bd Spearman correlation between signature scores of the top five markers in TAM-AIF1 (C1QB, C1QA, HLA-DRB1, AIF1, CD74), TAM-CCL3 (CCL3, CCL4, IL1B, CCL3L1, CCL4L2), TAM-SPP1 (SPP1, FTL, APOC1, S100A11, APOC2), and the signature score of immune checkpoints (CD274, PDCD1LG2, CTLA4, PDCD1, LAG3, TIGIT) in the TCGA glioma dataset. e Analysis of TIDE, T cell dysfunction and T cell exclusion scores calculated by the TIDE algorithm in TCGA glioma patients with high and low marker scores for TAM-SPP1. f, g, h Violin plots showing expression of three TFs (BCL3, NFKB2, and MEF2C), selected as examples of enriched TFs in TAM-CCL3 or TAM-AIF1. ik, m UMAP plots showing the regulon activity for TFs at the single-cell resolution, with cells having AUC scores higher than the threshold highlighted. l Heatmap showing top regulon activity in each TAM subtype. Statistical significance was determined by two-tailed Spearman correlation between variables for (bd), and by unpaired two-tailed Student’s t-test for (e). **p < 0.01; ****p < 0.0001
Fig. 4
Fig. 4
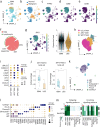
Single-cell RNA-seq analysis reveals interaction between representative TAM subsets and exhausted T cells. a, b UMAP projection of 122,626 single cells isolated from 17 glioma patients (six grade2/3 LGG and 11 grade 4 GBM samples), coloured by LGG/GBM (a) and normal/malignant cells (b). ce UMAP plot coloured by expression pattern of PTPRC (c), CD68 (d) and CD3D (e). f Chord plot showing the significantly interacting pathways between TAMs and lymphocytes in the glioma TME. g UMAP plot and violin plot showing SPP1’s expression pattern and levels in LGG and GBM. h UMAP projection of the three clusters of TAMs in the 17 glioma patients. i Dot plot indicating the expression of CCL3, CCL4L2, IL1B, AIF1, C1QA, C1QB, SPP1, S100A11 and LGALS1 in each cluster of the TAM subsets. j Box plot showing the proportion of AIF1+TAM and SPP1+TAM in total cells between LGG and GBM. k UMAP projection of six clusters of lymphocytes in the 17 glioma patients. l Dot plot indicating the expression of marker genes in each cluster of the lymphocytes. m Heatmap revealing the intensity of outgoing and incoming signals for TAM and lymphocyte subsets. Statistical significance was determined by unpaired two-tailed Student’s t-test for (j). *p < 0.05
Fig. 5
Fig. 5
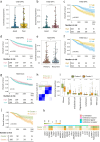
Survival analysis of TAM subsets deconvoluted from bulk RNA-seq datasets. a, b Boxplots showing the differential distribution of TAM-SPP1 in primary glioma patients from the TCGA (a) and CGGA (b) datasets (Good: alive; poor: death). c, d Kaplan–Meier curves of overall survival according to the proportions of TAM-SPP1 in TCGA (c) and CGGA (d) glioma patients. e Boxplots showing the differential distribution of TAM-SPP1 in primary and recurrent glioma patients from the CGGA dataset. f, g Kaplan–Meier curves of overall survival according to the proportions of TAM-CCL3 in TCGA (f) and CGGA (g) glioma patients. h Heatmap depicting a consensus clustering solution (K = 2) for three TAM signatures in 507 primary glioma samples from the TCGA dataset, the blue color indicating a high level of similarity in the expression profiles among the genes within a cluster. i Boxplot showing the differential distribution of seven cell types in Cluster 1 and Cluster 2 glioma patients from the TCGA datasets. j Kaplan–Meier curves of overall survival of patients in Cluster 1 and Cluster 2 among the 507 TCGA glioma patients. k Heatmap illustrating the expression pattern of inhibitory ligands, receptors, and enzymes in each cluster. Expression values are represented by z scores calculated across all tumors in the two clusters. (orange: high expression; green: low expression). Statistical significance was assessed by unpaired two-tailed Student’s t-test for (a, b, e, i), and by two-sided log-rank (Mantel-Cox) test for (c, d, f, g, j). *p < 0.05; **p < 0.01; ****p < 0.0001
Fig. 6
Fig. 6
Assessment of prognostic performance and predictive power of the TAM signature-based model. a ROC curves of the prognostic model predicting 1/3/5-years survival in the TCGA glioma dataset. b Kaplan–Meier curves of overall survival in TCGA glioma dataset according to the high (n = 178) and low (n = 329) risk score calculated based on the prognostic model. The cut-off is selected using the point that maximizes the difference between the true positive rate (TPR) and the false positive rate (FPR). c Forest plot describing the associations between survival outcomes with risk scores from the prognostic model and IDH mutation. The p value was inferred by the univariate Cox regression model. df Violin plots representing the distribution of TAM-SPP1 (d), TAM-AIF1 (e) and TAM-CCL3 (f) between TCGA glioma patients with high (n = 178) or low (n = 329) risk scores. gi Spearman correlation between risk scores and the signature score of the top five markers for each TAM cluster in the TCGA glioma dataset. j Prediction of potential clinical response to immunotherapy in TCGA glioma patients, comparing patients with high- versus low-risk score. km Analysis of TIDE (k), T cell dysfunction (l) and T cell exclusion (m) scores in TCGA glioma patients with high- and low- risk scores. n ROC curves of the prognostic model predicting 1/3/5-years survival in the CGGA glioma dataset. o Kaplan–Meier curves of overall survival in CGGA glioma dataset according to the high (n = 248) and low (n = 344) risk scores based on the prognostic model. The cut-off is selected using the point that maximizes the difference between the TPR and the FPR. p TIDE prediction of potential clinical immunotherapy response in CGGA glioma patients, comparing high- versus low-risk scores. q, r Analysis of TIDE (q) and T cell exclusion (r) scores in CGGA glioma patients with high and low risk scores. s, t Violin plots representing the TAM-SPP1 (s) and TAM-AIF1 (t) levels in CGGA glioma patients with high- and low-risk scores. Statistical significance was assessed by unpaired two-tailed Student’s t-test for (df, km, qt), by two-sided χ2 test for (j, p), by two-tailed Spearman correlation between variables for (gi) and by two-sided log-rank test for (b, o). *p < 0.05; **p < 0.01; ****p < 0.0001
Fig. 7
Fig. 7
Association of EGFR amplification with TAM subtypes and risk score. a, b The distribution of GISTIC2.0 assigned G-scores for recurrent focal amplifications (red) and deletions (blue) in glioma Cluster 1 (a) and Cluster 2 (b) patients. c Violin plot showing the differential levels of CCL2 mRNA [log2(TPM + 1)] expression between TCGA glioma patients with (n = 103) or without (n = 391) EGFR amplification. d, f Violin plots representing the differential levels of deconvoluted TAM-SPP1 (d) and TAM-CCL3 (f) proportions between TCGA glioma patients with (n = 103) or without (n = 391) EGFR amplification. e, g Violin plots showing the differential signature scores of marker genes for TAM-SPP1 (e) and TAM-CCL3 (g) between TCGA glioma patients with (n = 103) or without (n = 391) EGFR amplification. h Violin plot showing the differential levels of risk score between TCGA glioma patients with (n = 103) or without (n = 391) EGFR amplification. i, k Sankey plots visualizing the relationship between EGFR amplification, IDH mutation, TAM-SPP1 and risk score levels. j Kaplan-Meier curve of overall survival in EGFR amplified patients according to the high and low TAM-SPP1 levels. l Kaplan-Meier curve of overall survival in EGFR non-amplified and IDH mutant patients according to high- and low-risk scores calculated based on the prognostic model. Statistical significance was assessed by unpaired two-tailed Student’s t-test for (ch) and by two-sided log-rank test for (j, l). *p < 0.05; **p < 0.01; ***p < 0.001; ****p < 0.0001

References

    1. Jiang T, Tang G, Lin Y, Peng X, Zhang X, Zhai X, et al. Prevalence estimates for primary brain tumors in China: a multi-center cross-sectional study. Chin Med J. 2011;124:2578–2583. - PubMed
    1. Collaborators G 2016 B and OCC. Patel AP, Fisher JL, Nichols E, Abd-Allah F, Abdela J, et al. Global, regional, and national burden of brain and other CNS cancer, 1990–2016: a systematic analysis for the Global Burden of Disease Study 2016. Lancet Neurol. 2019;18:376–393. doi: 10.1016/S1474-4422(18)30468-X. - DOI - PMC - PubMed
    1. Johnson KC, Anderson KJ, Courtois ET, Gujar AD, Barthel FP, Varn FS, et al. Single-cell multimodal glioma analyses identify epigenetic regulators of cellular plasticity and environmental stress response. Nat Genet. 2021;53:1456–1468. doi: 10.1038/s41588-021-00926-8. - DOI - PMC - PubMed
    1. Bready D, Placantonakis DG. Molecular pathogenesis of low-grade glioma. Neurosurg Clin North Am. 2019;30:17–25. doi: 10.1016/j.nec.2018.08.011. - DOI - PMC - PubMed
    1. Louis DN, Perry A, Wesseling P, Brat DJ, Cree IA, Figarella-Branger D, et al. The 2021 WHO classification of tumors of the central nervous system: a summary. Neuro Oncol. 2021;23:1231–1251. doi: 10.1093/neuonc/noab106. - DOI - PMC - PubMed