Multicenter Study
. 2024 Mar 22:14:04069.
doi: 10.7189/jogh.14.04069.

Trajectories tracking of maternal and neonatal health in eastern China from 2010 to 2021: A multicentre cross-sectional study

Affiliations
Multicenter Study

Trajectories tracking of maternal and neonatal health in eastern China from 2010 to 2021: A multicentre cross-sectional study

Hui Zhu et al. J Glob Health. .

Abstract

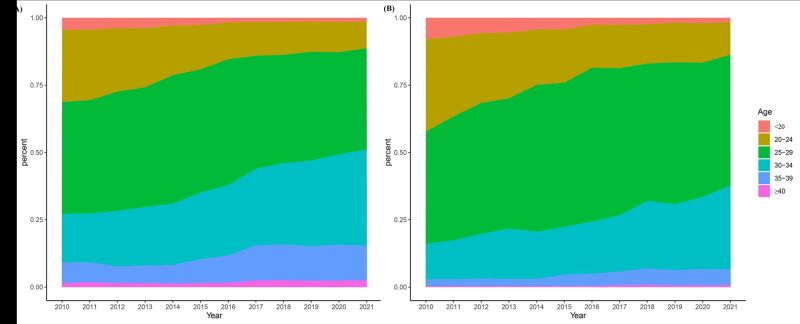
Background: China's fertility policy has dramatically changed in the past decade with the successive promulgation of the partial two-child policy, universal two-child policy and three-child policy. The trajectories of maternal and neonatal health accompanied the changes in fertility policy are unknown.

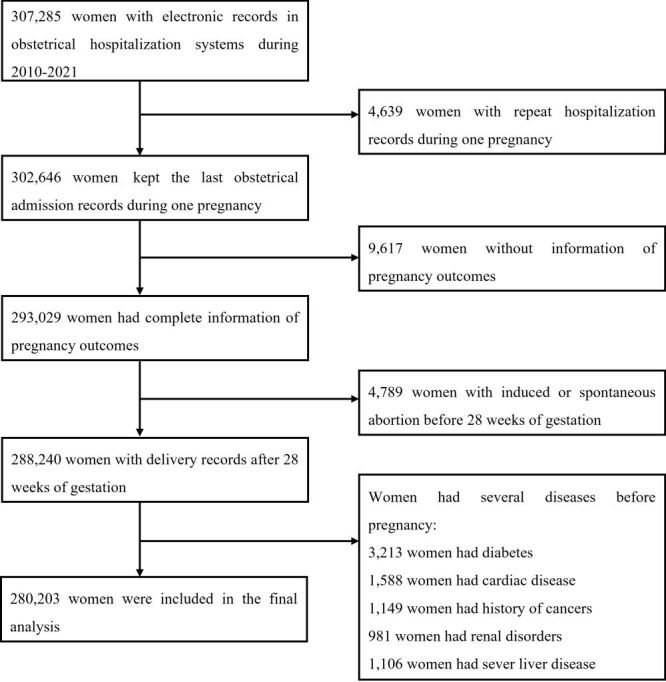
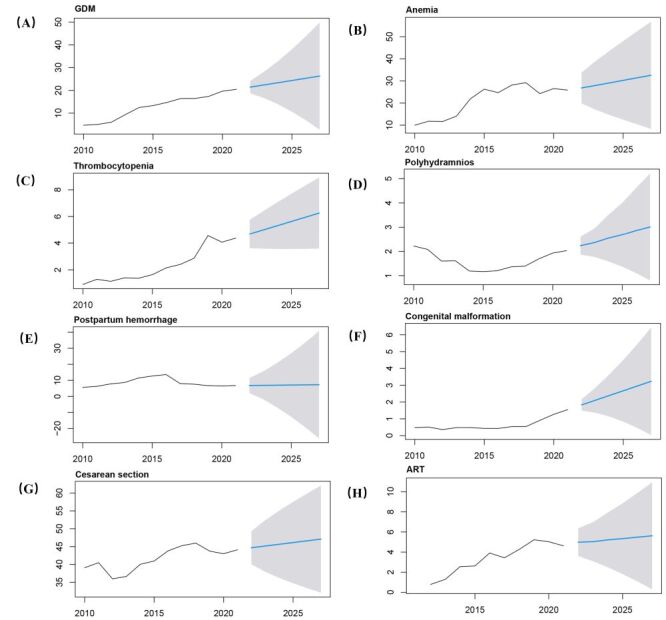
Methods: We obtained data of 280 203 deliveries with six common pregnancy complications and thirteen perinatal outcomes between 2010 and 2021 in eastern China. The average annual percent change (AAPC) was calculated to evaluated the temporal trajectories of obstetric characteristics and adverse outcomes during this period. Then, the autoregressive integrated moving average (ARIMA) models were constructed to project future trend of obstetric characteristics and outcomes until 2027.

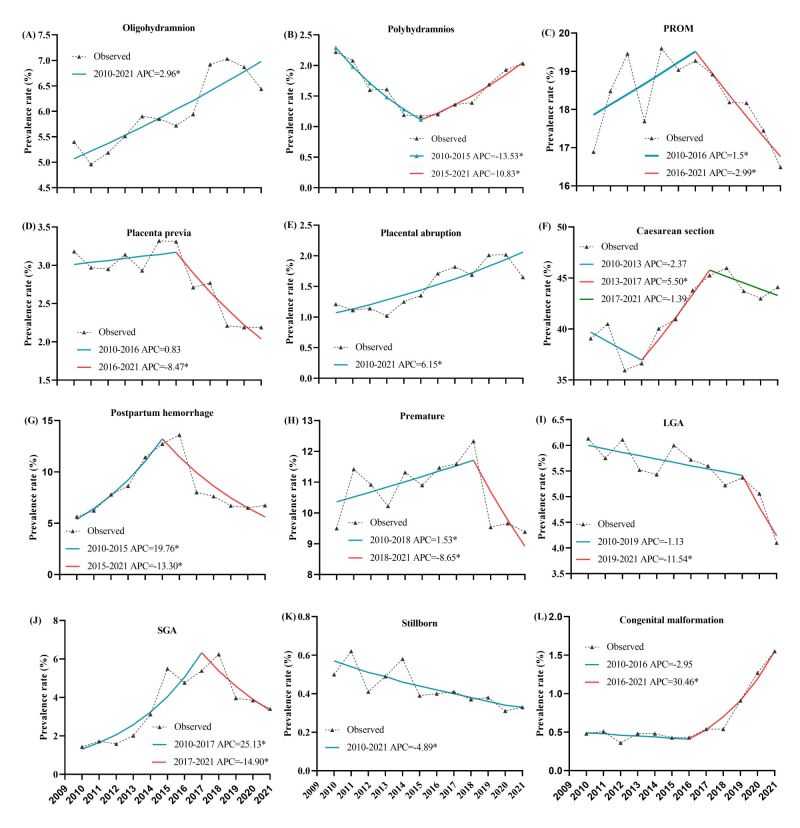
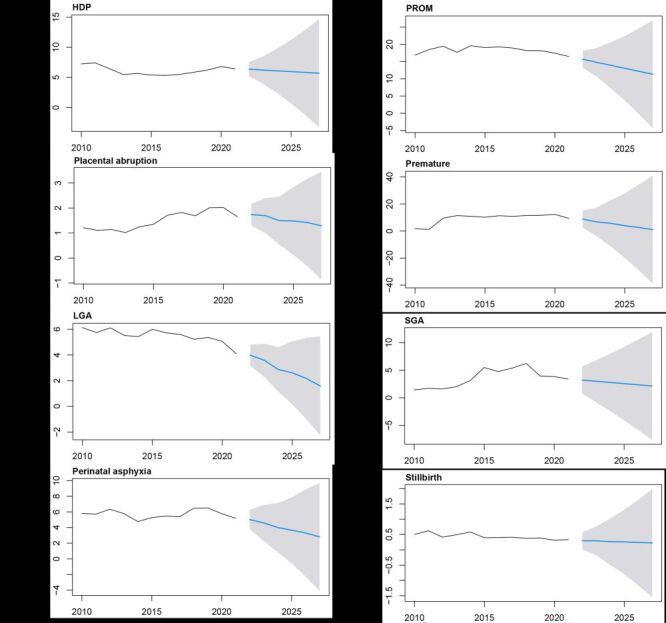
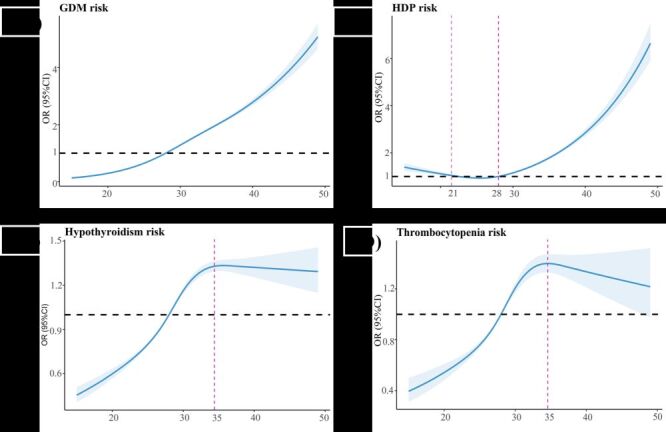
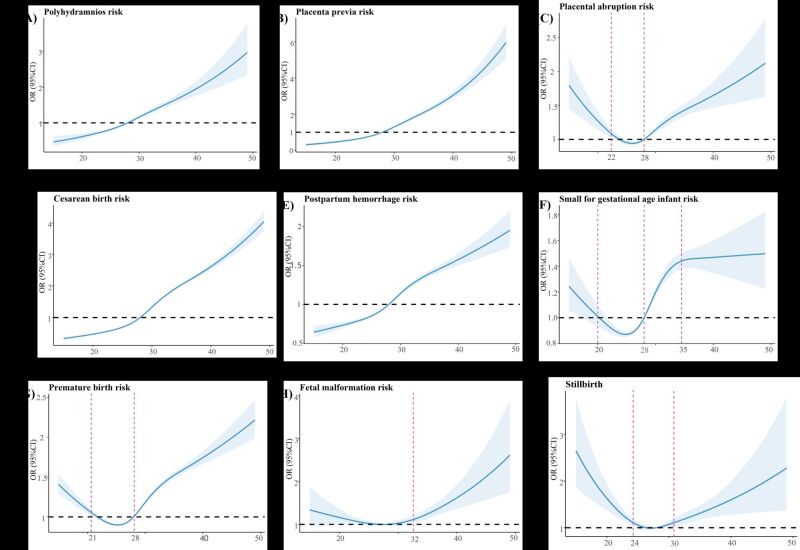
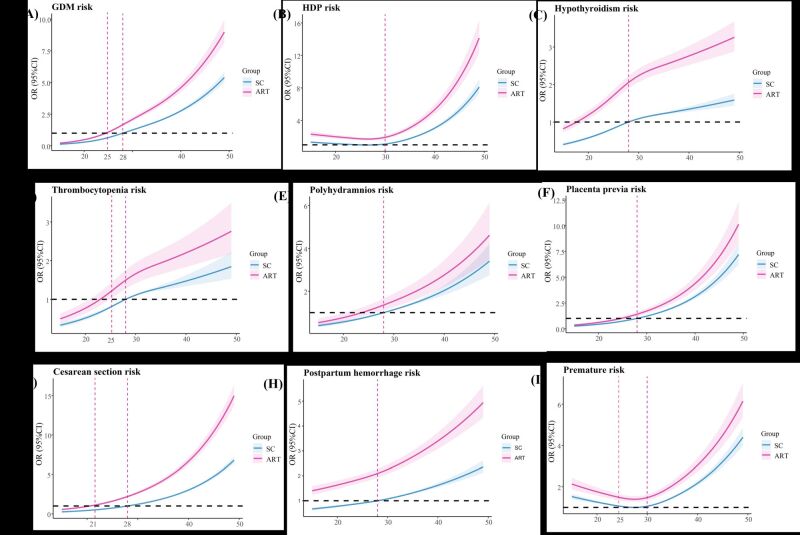
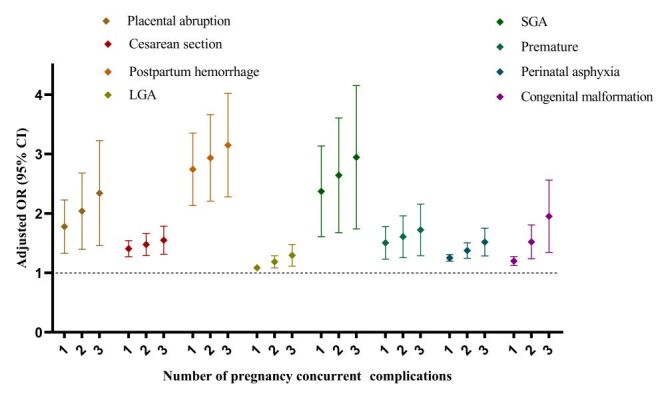
Results: The proportion of advanced maternal age (AMA), assisted reproduction technology (ART) treatment, gestational diabetes mellitus (GDM), anaemia, thrombocytopenia, thyroid dysfunction, oligohydramnios, placental abruption, small for gestational age (SGA) infants, and congenital malformation significantly increased from 2010 to 2021. However, the placenta previa, large for gestational age (LGA) infants and stillbirth significantly decreased during the same period. The AMA and ART treatment were identified as independent risk factors for the uptrends of pregnancy complications and adverse perinatal outcomes. The overall caesarean section rate remained above 40%. Importantly, among multiparas, a previous caesarean section was found to be associated with a significantly reduced risk of hypertensive disorders of pregnancy (HDP), premature rupture of membranes (PROM), placenta previa, placental abruption, perinatal asphyxia, LGA infants, stillbirths, and preterm births. In addition, the ARIMA time series models predicted increasing trends in the ART treatment, GDM, anaemia, thrombocytopenia, postpartum haemorrhage, congenital malformation, and caesarean section until 2027. Conversely, a decreasing trend was predicted for HDP, PROM, and placental abruption premature, LGA infants, SGA infants, perinatal asphyxia, and stillbirth.

Conclusions: Maternal and neonatal adverse outcomes became more prevalent from 2010 to 2021 in China. Maternal age and ART treatment were independent risk factors for adverse obstetric outcomes. The findings offered comprehensive trajectories for monitoring pregnancy complications and perinatal outcomes in China, and provided robust intervention targets in obstetric safety. The development of early prediction models and the implementation of prevention efforts for adverse obstetric events are necessary to enhance obstetric safety.


Conflict of interest statement

Disclosure of interest: The authors completed the ICMJE Disclosure of Interest Form (available upon request from the corresponding author) and disclose no relevant interests.

Figures

Figure 1
Figure 1
Flowchart for eligible participants of this study.
Figure 2
Figure 2
Stacked area graph of the trend in maternal age groups from 2010 − 2021. Panel A. The age distribution in the overall maternal population. Panel B. The age distribution in the primiparas
Figure 3
Figure 3
The temporal trends in prevalence of advanced maternal age, ART treatment and several pregnancy complications from 2010 to 2021. Panel A. Advanced maternal age. Panel B. ART treatment. Panel C. GDM. Panel D. Anaemia during pregnancy. Panel E. Thrombocytopenia during pregnancy. Panel F. HDP. The number of Joinpoints were selected by the optimal models from Joinpoint regression analysis. *Indicates that the annual percent change (APC) is significantly different from zero at the α = 0.05 level. ART – assisted reproductive technology, GDM – gestational diabetes mellitus, HDP – hypertensive disorders in pregnancy
Figure 4
Figure 4
The temporal trends in prevalence of maternal and foetal adverse outcomes from 2010 to 2021. Panel A. Oligohydramnios. Panel B. Polyhydramnios. Panel C. PROM. Panel D. Placenta previa. Panel E. Placental abruption. Panel F. Caesarean section. Panel G. Postpartum haemorrhage. Panel H. Premature. Panel I. LGA. Panel J. SGA. Panel K. Stillbirth. Panel L. Congenital malformation. The number of Joinpoints were selected by the optimal models from Joinpoint regression analysis. *Indicates that the annual percent change (APC) is significantly different from zero at the α = 0.05 level. PROM – premature rupture of membranes, LGA – Large-for-gestational-age infants, SGA – small-for-gestational-age infants
Figure 5
Figure 5
The predictions of the increased trend of adverse obstetric events in China from the ARIMA model. Panel A. The prevalence trend of GDM. Panel B. The prevalence trend of anaemia. Panel C. The prevalence trend of thrombocytopenia. Panel D. The prevalence trend of polyhydramnios. Panel E. The prevalence trend of postpartum haemorrhage. Panel F. The prevalence trend of congenital malformation. Panel G. The prevalence trend of caesarean section. Panel H. The prevalence trend of ART. The solid black line indicates the current prevalence of outcome events, the blue line indicates the predicted trend, and the shadow indicates the 95% confidence interval. GDM – gestational diabetes mellitus, ART – assisted reproductive technology
Figure 6
Figure 6
The predictions of the decreased trend of adverse obstetric events in China from the ARIMA model. Panel A. The prevalence trend of HDP. Panel B. The prevalence trend of PROM. Panel C. The prevalence trend of placental abruption. Panel D. The prevalence trend of premature. Panel E. The prevalence trend of LGA. Panel F. The prevalence trend of SGA. Panel G. The prevalence trend of perinatal asphyxia. Panel H. The prevalence trend of stillbirth. The solid black line indicates the current prevalence of outcome events, the blue line indicates the predicted trend, and the shadow indicates the 95% confidence interval. HDP – hypertensive disorders in pregnancy, PROM – premature rupture of membranes, LGA – Large-for-gestational-age infants, SGA – small-for-gestational-age infants
Figure 7
Figure 7
The dose-response relationship of maternal age and risk of pregnancy complications. Panel A. GDM. Panel B. HDP. Panel C. Hypothyroidism. Panel D. Thrombocytopenia. The blue lines were the fitted linear trend, and the shaded areas were 95% confidence interval. The red dotted lines indicate the point of inflection where a statistically significant difference occurs. GDM – gestational diabetes mellitus, HDP – hypertensive disorders in pregnancy
Figure 8
Figure 8
The dose-response relationship of maternal age and risk of maternal as well as foetal adverse outcomes. Panel A. Polyhydramnios. Panel B. Placenta previa. Panel C. Placental abruption. Panel D. Caesarean section. Panel E. Postpartum haemorrhage. Panel F. SGA. Panel G. Premature. Panel H. Congenital malformation. Panel I. Stillbirth. The blue lines were the fitted linear trend, and the shaded areas were 95% confidence interval. The red dotted lines indicate the point of inflection where a statistically significant difference occurs. SGA – small-for-gestational-age infants
Figure 9
Figure 9
The dose-response relationship of maternal age and pregnancy complications as well as adverse perinatal outcomes in ART and SC groups. Panel A. Risk of GDM with maternal age in ART and SC women. Panel B. Risk of HDP with maternal age in ART and SC women. Panel C. Risk of hypothyroidism with maternal age in ART and SC women. Panel D. Risk of thrombocytopenia with maternal age in ART and SC women. Panel E. Risk of polyhydramnios with maternal age in ART and SC women. Panel F. Risk of placenta previa with maternal age in ART and SC women. Panel G. Risk of caesarean section with maternal age in ART and SC women. Panel H. Risk of postpartum haemorrhage with maternal age in ART and SC women. Panel I. Risk of premature with maternal age and risk of stillbirth. The blue lines were the fitted linear trend of SC group, red lines were the fitted linear trend of ART group the and the shaded areas were 95% confidence interval. The red dotted lines indicate the point of inflection where a statistically significant difference occurs. ART – assisted reproductive technology, SC – spontaneous conception, GDM – gestational diabetes mellitus, HDP – hypertensive disorders in pregnancy
Figure 10
Figure 10
The cumulative effect of comorbid pregnancy complications for adverse perinatal outcomes. LGA – large for gestational age infants, SGA – small for gestational age infants

Similar articles

Cited by

References

    1. Tatum M.China’s three-child policy. Lancet. 2021;397:2238. 10.1016/S0140-6736(21)01295-2 - DOI - PubMed
    1. Zeng Y, Hesketh T.The effects of China’s universal two-child policy. Lancet. 2016;388:1930−8. 10.1016/S0140-6736(16)31405-2 - DOI - PMC - PubMed
    1. National Bureau of Statistics the People’s Republic of China. Statistical Bulletin of the People's Republic of China on National Economic and Social Development for 2016. Available: http://www.stats.gov.cn/sj/zxfb/202302/t20230203_1899428.html. Accessed: 28 Februry 2017.
    1. National Bureau of Statistics the People’s Republic of China. Statistical Bulletin of the People's Republic of China on National Economic and Social Development for 2017. Available: http://www.stats.gov.cn/sj/zxfb/202302/t20230203_1899855.html. Accessed: 28 Februry 2018.
    1. National Bureau of Statistics the People’s Republic of China. The Seventh National Census. Available: https://www.stats.gov.cn/sj/pcsj/rkpc/7rp/indexch.htm. Accessed: 11 May 2021.

Publication types