. 2024 Mar 7;10(6):e27600.
doi: 10.1016/j.heliyon.2024.e27600. eCollection 2024 Mar 30.

Magnolia officinalis Rehder & E. Wilson ameliorates white adipogenesis by upregulating AMPK and SIRT1 in vitro and in vivo

Affiliations

Magnolia officinalis Rehder & E. Wilson ameliorates white adipogenesis by upregulating AMPK and SIRT1 in vitro and in vivo

Yea-Jin Park et al. Heliyon. .

Abstract

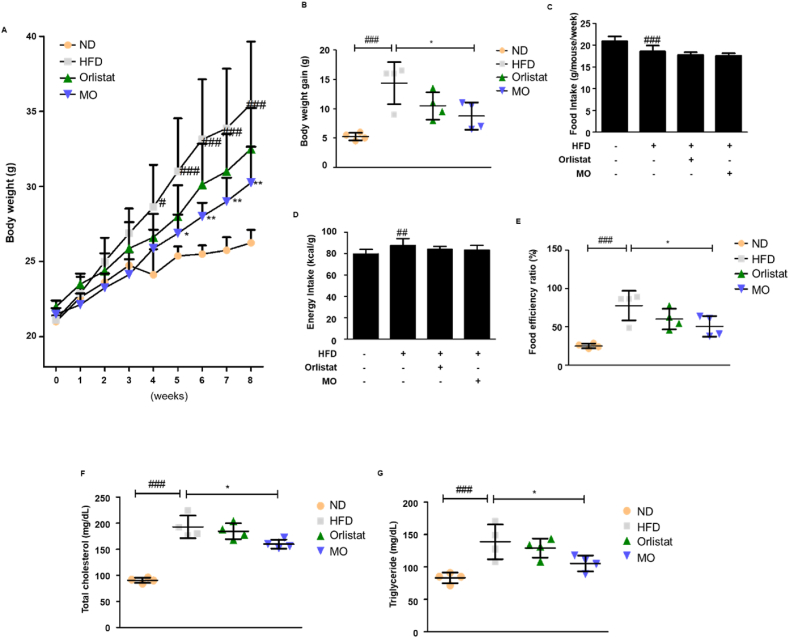
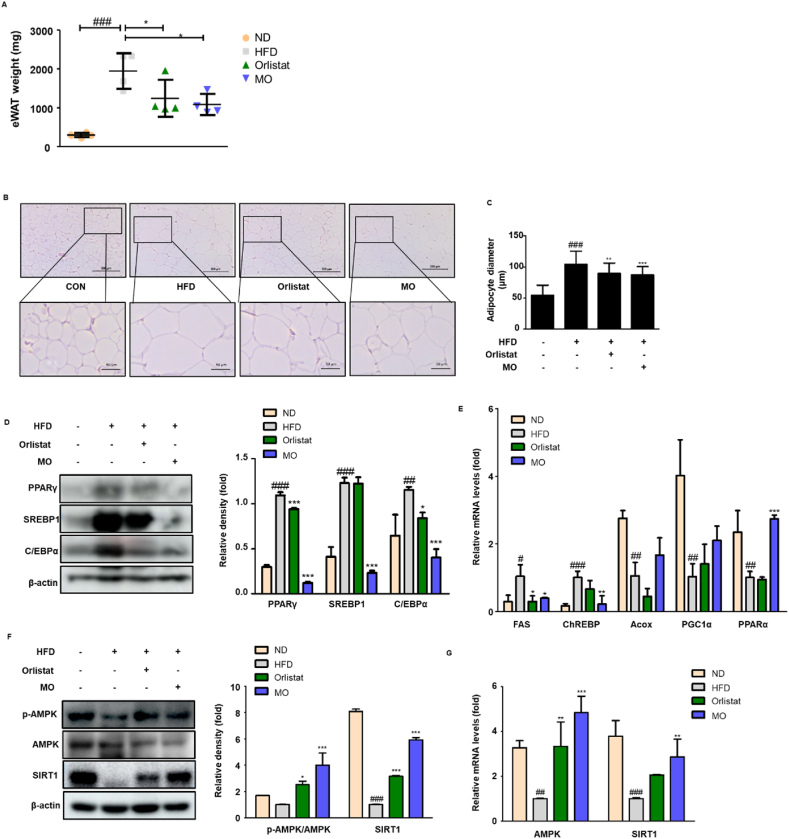
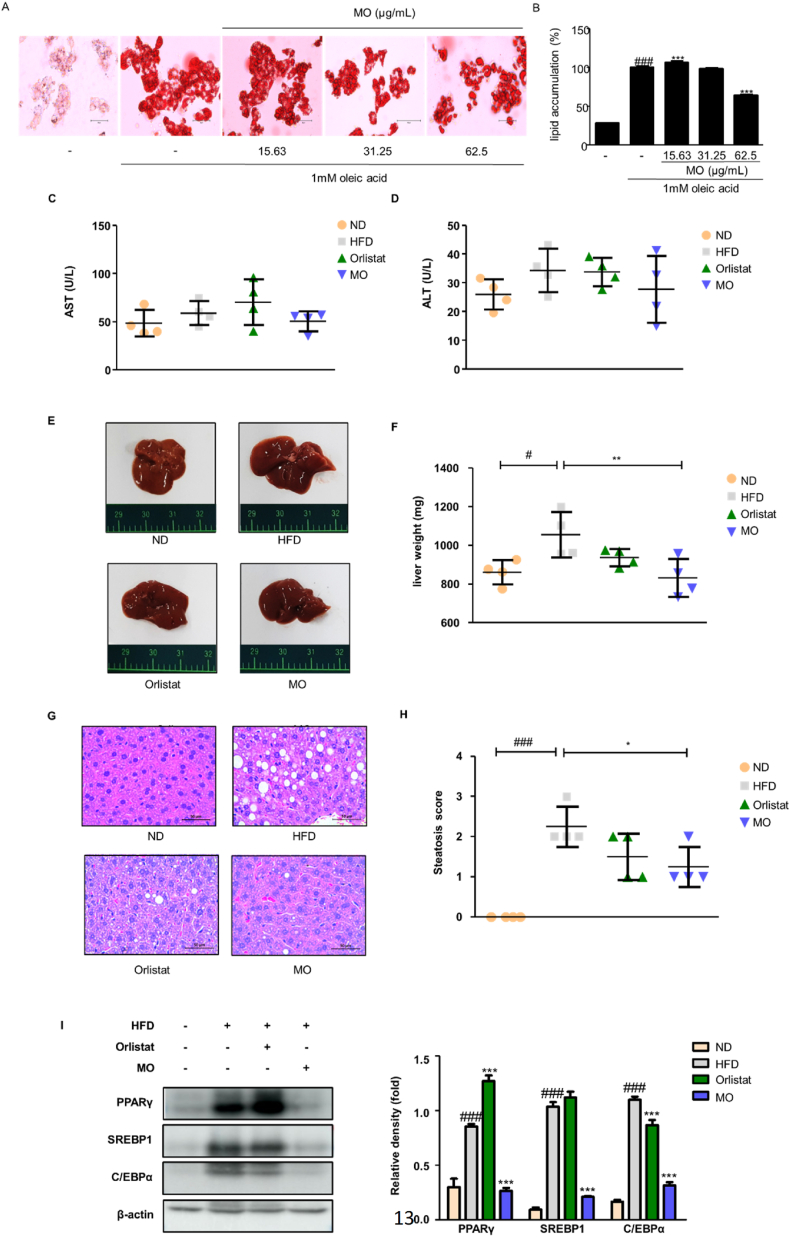
Although there is an established link between Magnolia Cortex (MO) and lipid metabolism in previous research, its exploration within the context of obesity has been limited. Therefore, the present study investigated the therapeutic effects of MO on obesity and its mechanism of action in vitro and in vivo. Our chromatography analysis revealed that Honokiol and Magnolol are contained in MO extract. In vitro experiments showed that lipid droplets, adipogenic, and lipogenic genes were notably diminished by increasing sirtuin 1 (SIRT1) and AMP-activated kinase (AMPK) protein expression in MO-treated 3T3-L1 adipocytes. In vivo experiments exhibited that MO administration significantly recovered the adipogenesis, lipogenesis, and fatty acid oxidation genes by increasing the SIRT1 and AMPK expression in white adipose tissue. Furthermore, hepatic steatosis by HFD feeding was ameliorated in MO-administered obese mice. We conclude that MO could be important manager for treating obesity through AMPK and SIRT1 regulation.

Keywords: AMP-Activated kinase; Adipose tissue; Magnolia cortex; Obesity; Sirtuin 1.


Conflict of interest statement

The authors declare that they have no known competing financial interests or personal relationships that could have appeared to influence the work reported in this paper.

Figures

Fig. 1
Fig. 1
Analysis of Magnolol and Honokiol in MO. UV chromatogram (A) and mass fragmentation pattern (B) of Magnolol, Honokiol, and MO.
Fig. 2
Fig. 2
Obesity is ameliorated in MO-administered mice. Male C57BL/6 mice were randomly assigned to the ND or the HFD group for 8 weeks. The HFD group was divided into three groups (n = 4 mice per group): HFD mice administered with water (vehicle), HFD mice administered with 20 mg/kg Orlistat, and HFD mice administered with 50 mg/kg MO. (A and C) Body weight and food intake were checked at 10 a.m. every Monday for 8 weeks. (B) Body weight gain. (C) Food intake. (D) Energy intake. (E) Food efficiency ratio. (F) Total cholesterol and (G) triglyceride levels were assessed. The values are represented as mean ± SD. #P < 0.05, ##P < 0.01, and ###P < 0.001 compared with ND group; *P < 0.05 and **P < 0.01 compared with HFD group; significances were determined using two-way ANOVA followed by a Bonferroni post hoc test, and one-way ANOVA followed by a Dunnett's post hoc test.
Fig. 3
Fig. 3
Function of MO in the adipose tissue of HFD-fed obese mice. (A) Epididymal white adipose tissue weight was measured at week 8 after Orlistat or MO administration. (B–C) H&E staining and adipocyte diameter in adipose tissue section. Scale bars are 200 (above) and 50 μm (below). (D) Western blot analysis of PPARγ, C/EBPα, and SREBP1 protein expression in adipose tissue. (E) qRT-PCR analysis of FAS, ChREBP, Acox, PGC-1α, and PPARα mRNA levels in adipose tissue. (F) Western blot of p-AMPK, AMPK, and SIRT1 protein expression in adipose tissue. Densitometric analysis was performed using ImageJ v1.50i. (G) qRT-PCR analsysis of AMPK and SIRT1 mRNA levels in adipose tissue. The uncropped gel blots are provided as supplementary materials. The values are represented as mean ± SD. #P < 0.05, ##P < 0.01, and ###P < 0.001 compared with ND group; *P < 0.05, **P < 0.01, and ***P < 0.001 compared with HFD group; significances were determined using one-way ANOVA followed by a Dunnett's post hoc test.
Fig. 4
Fig. 4
Adipogenesis is lower in MO-treated 3T3-L1 adipocytes. (A) 3T3-L1 preadipocytes were incubated in culture medium with MO (0–1000 μg/mL) for 2 days. The cell viability was analyzed using MTT assay. ***P < 0.001 compared with untreated control. (B) 3T3-L1 preadipocytes were incubated in differentiation medium with MO (31.25–125 μg/mL) for 8 days. The lipid droplets were stained with Oil Red O. (C) The OD value of Oil Red O eluted solution. ###P < 0.001 vs. non-differentiation group; **P < 0.01, and ***P < 0.001 compared with differentiation group. (D) 3T3-L1 preadipocytes were incubated in differentiation medium with MO (31.25–125 μg/mL) for 4 days, and then, cell lysates were collected and analyzed using western blotting with specific antibodies against PPARγ, C/EBPα, and SREBP1. (E) 3T3-L1 preadipocytes were incubated in MDI medium with MO for 2 h, and then, cell lysates were collected and analyzed using western blotting with specific antibodies against p-AMPK, AMPK, and SIRT1. β-actin was an internal control. Densitometric analysis was performed using ImageJ v1.50i. The uncropped gel blots are provided as supplementary materials. ###P < 0.001 vs. non-differentiation group; *P < 0.05, **P < 0.01, and ***P < 0.001 compared with differentiation group. The values are represented as mean ± SD and are representative of three independent experiments; significances were determined using one-way ANOVA followed by a Dunnett's post hoc test. (For interpretation of the references to colour in this figure legend, the reader is referred to the Web version of this article.)
Fig. 5
Fig. 5
MO administration improves hepatic steatosis in vivo (A) Oleic acid was treated in HepG2 cells with or without MO (0–62.5 μg/mL) for 48 h. The lipid droplets were stained with Oil Red O. (B) The optical density value of Oil Red O eluted solution. ###P < 0.001 vs. non-cells; ***P < 0.001 compared with oleic acid-treated cells. (C) AST and (D) ALT levels were assessed. (E) Representative images of liver. (F) The liver weight was measured at week 8 after Orlistat or MO administration. (G) H&E staining in liver section. (H) Steatosis score was measured using image J v1.50i. (I) Western blot analysis of PPARγ, C/EBPα, and SREBP1 protein expression in liver tissue. Densitometric analysis was performed using ImageJ v1.50i. The uncropped gel blots are provided as supplementary materials. The values are represented as mean ± SD. #P < 0.05 and ###P < 0.001 compared with ND group; *P < 0.05, **P < 0.01, and ***P < 0.001 compared with HFD group; significances were determined using one-way ANOVA followed by a Dunnett's post hoc test. (For interpretation of the references to colour in this figure legend, the reader is referred to the Web version of this article.)

References

    1. Bluher M. Metabolically healthy obesity. Endocr. Rev. 2020;41 doi: 10.1210/endrev/bnaa004. - DOI - PMC - PubMed
    1. Chen, K. et al. HMGB2 orchestrates mitotic clonal expansion by binding to the promoter of C/EBPbeta to facilitate adipogenesis. Cell Death Dis. 12, 666, doi:10.1038/s41419-021-03959-3(2021). - PMC - PubMed
    1. Majeed, Y. et al. SIRT1 promotes lipid metabolism and mitochondrial biogenesis in adipocytes and coordinates adipogenesis by targeting key enzymatic pathways. Sci. Rep. 11, 8177, doi:10.1038/s41598-021-87759-x(2021). - PMC - PubMed
    1. Nogueiras R., et al. Sirtuin 1 and sirtuin 3: physiological modulators of metabolism. Physiol. Rev. 2012;92:1479–1514. doi: 10.1152/physrev.00022.2011. - DOI - PMC - PubMed
    1. Narula S.P., Sharma P.L., Wahi P.L. Antiarrhythmic activity of racemic propranolol and its optical isomers in ouabain-induced cardiac arrhythmias in rhesus monkeys. Indian J. Med. Res. 1975;63:1705–1711. - PubMed

LinkOut - more resources