. 2023 Oct 31:4:770-784.
doi: 10.1038/s43017-023-00485-y.

The Anthropogenic Salt Cycle

Affiliations

The Anthropogenic Salt Cycle

Sujay S Kaushal et al. Nat Rev Earth Environ. .

Abstract

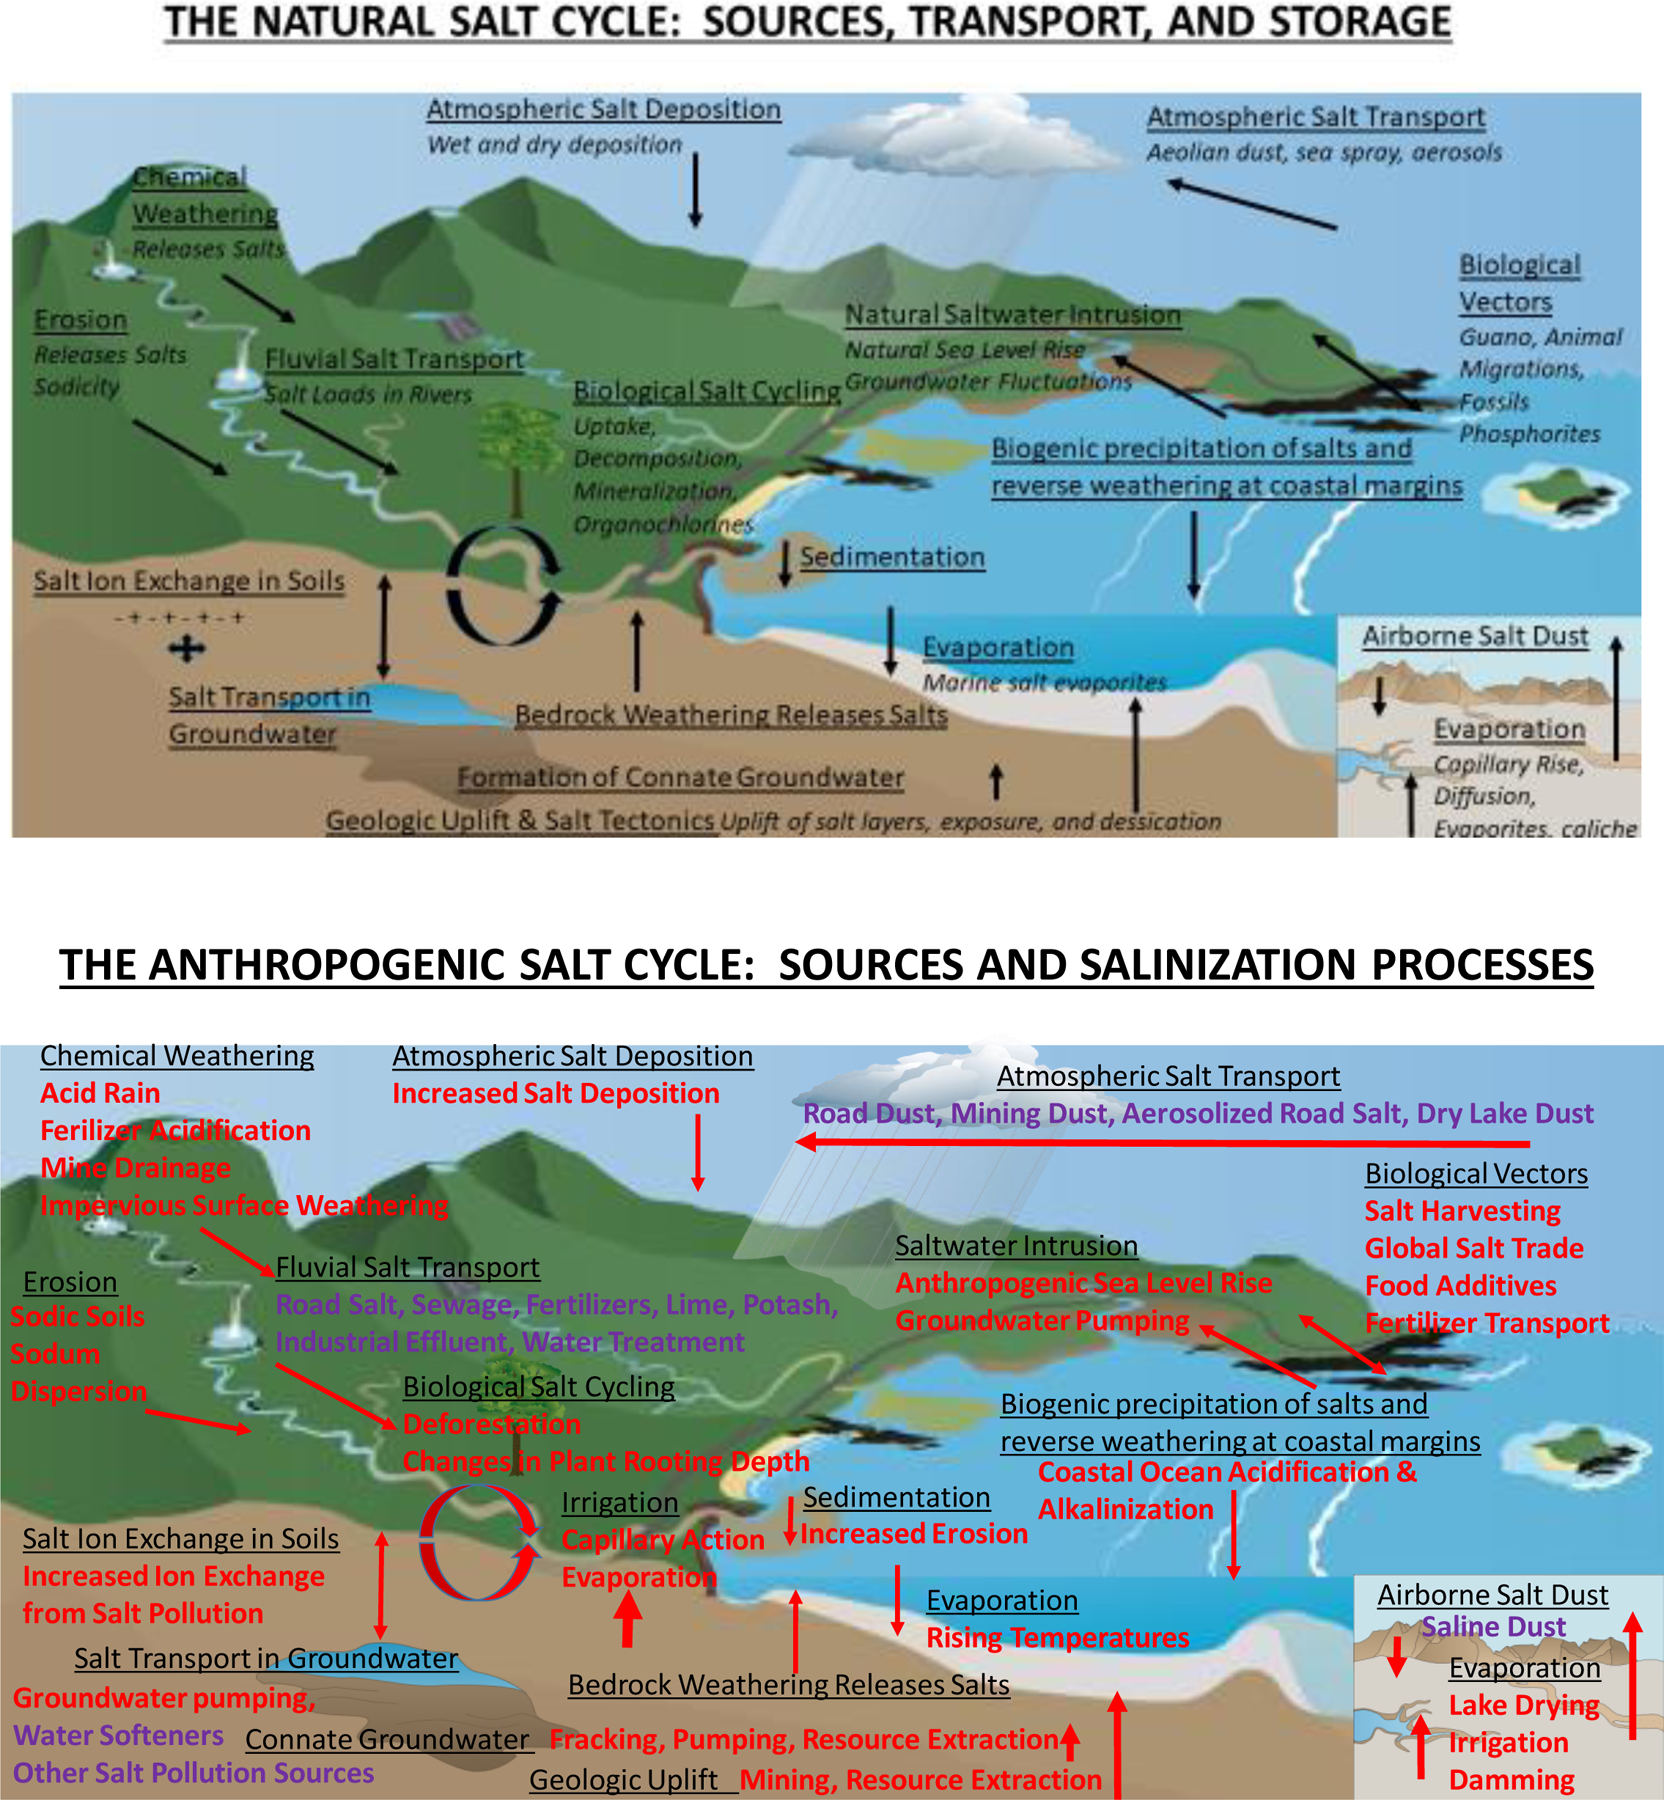
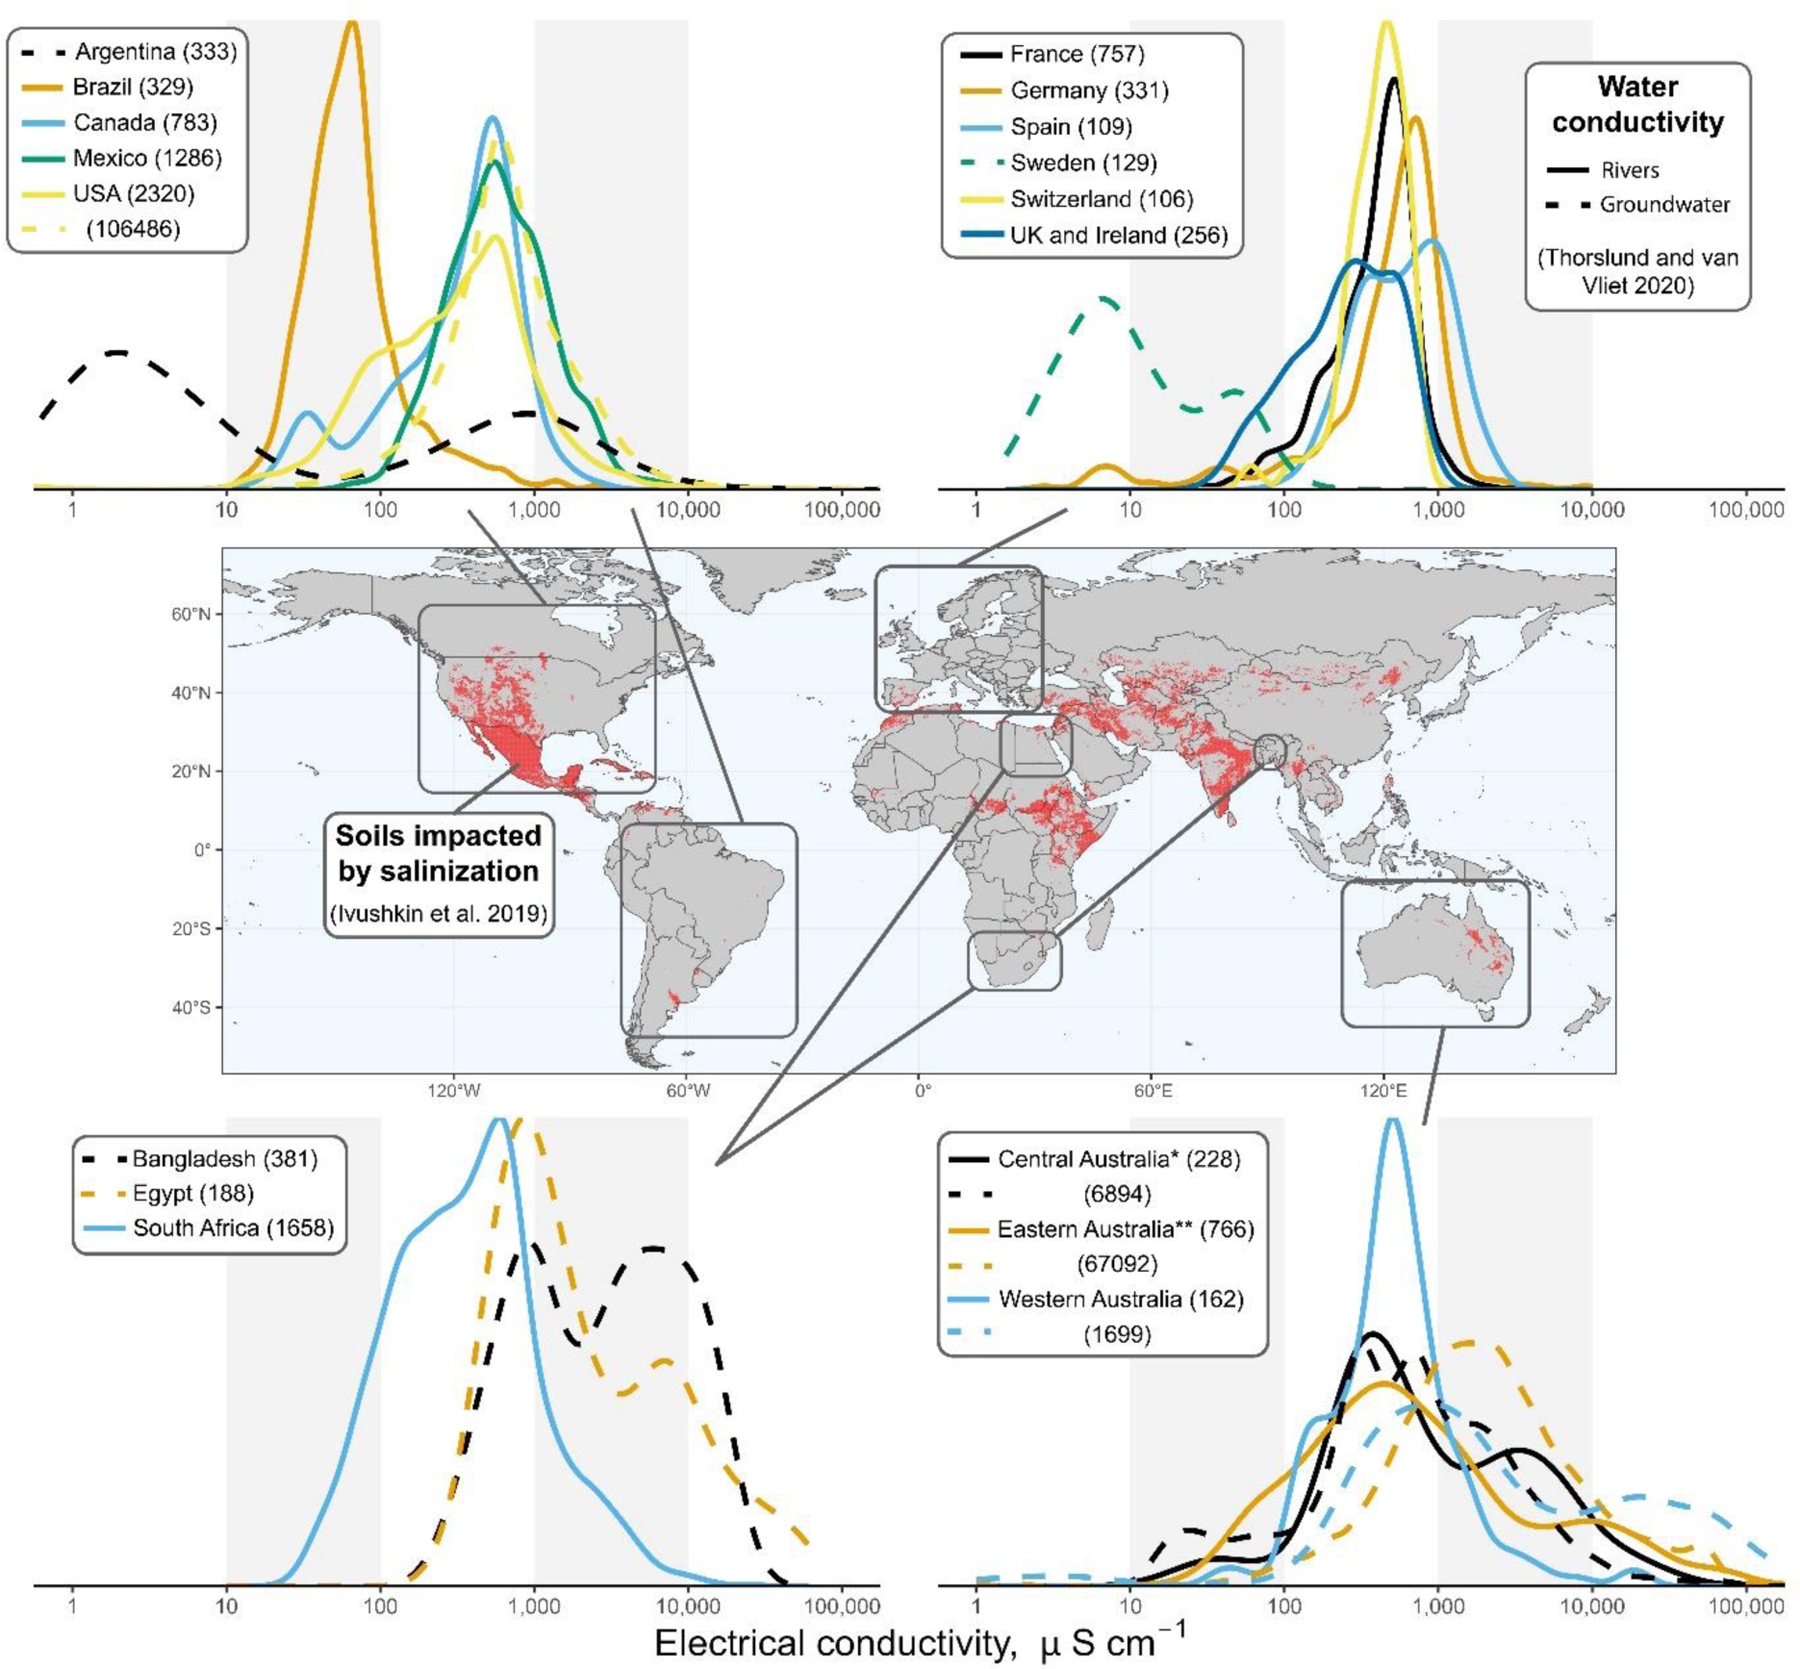
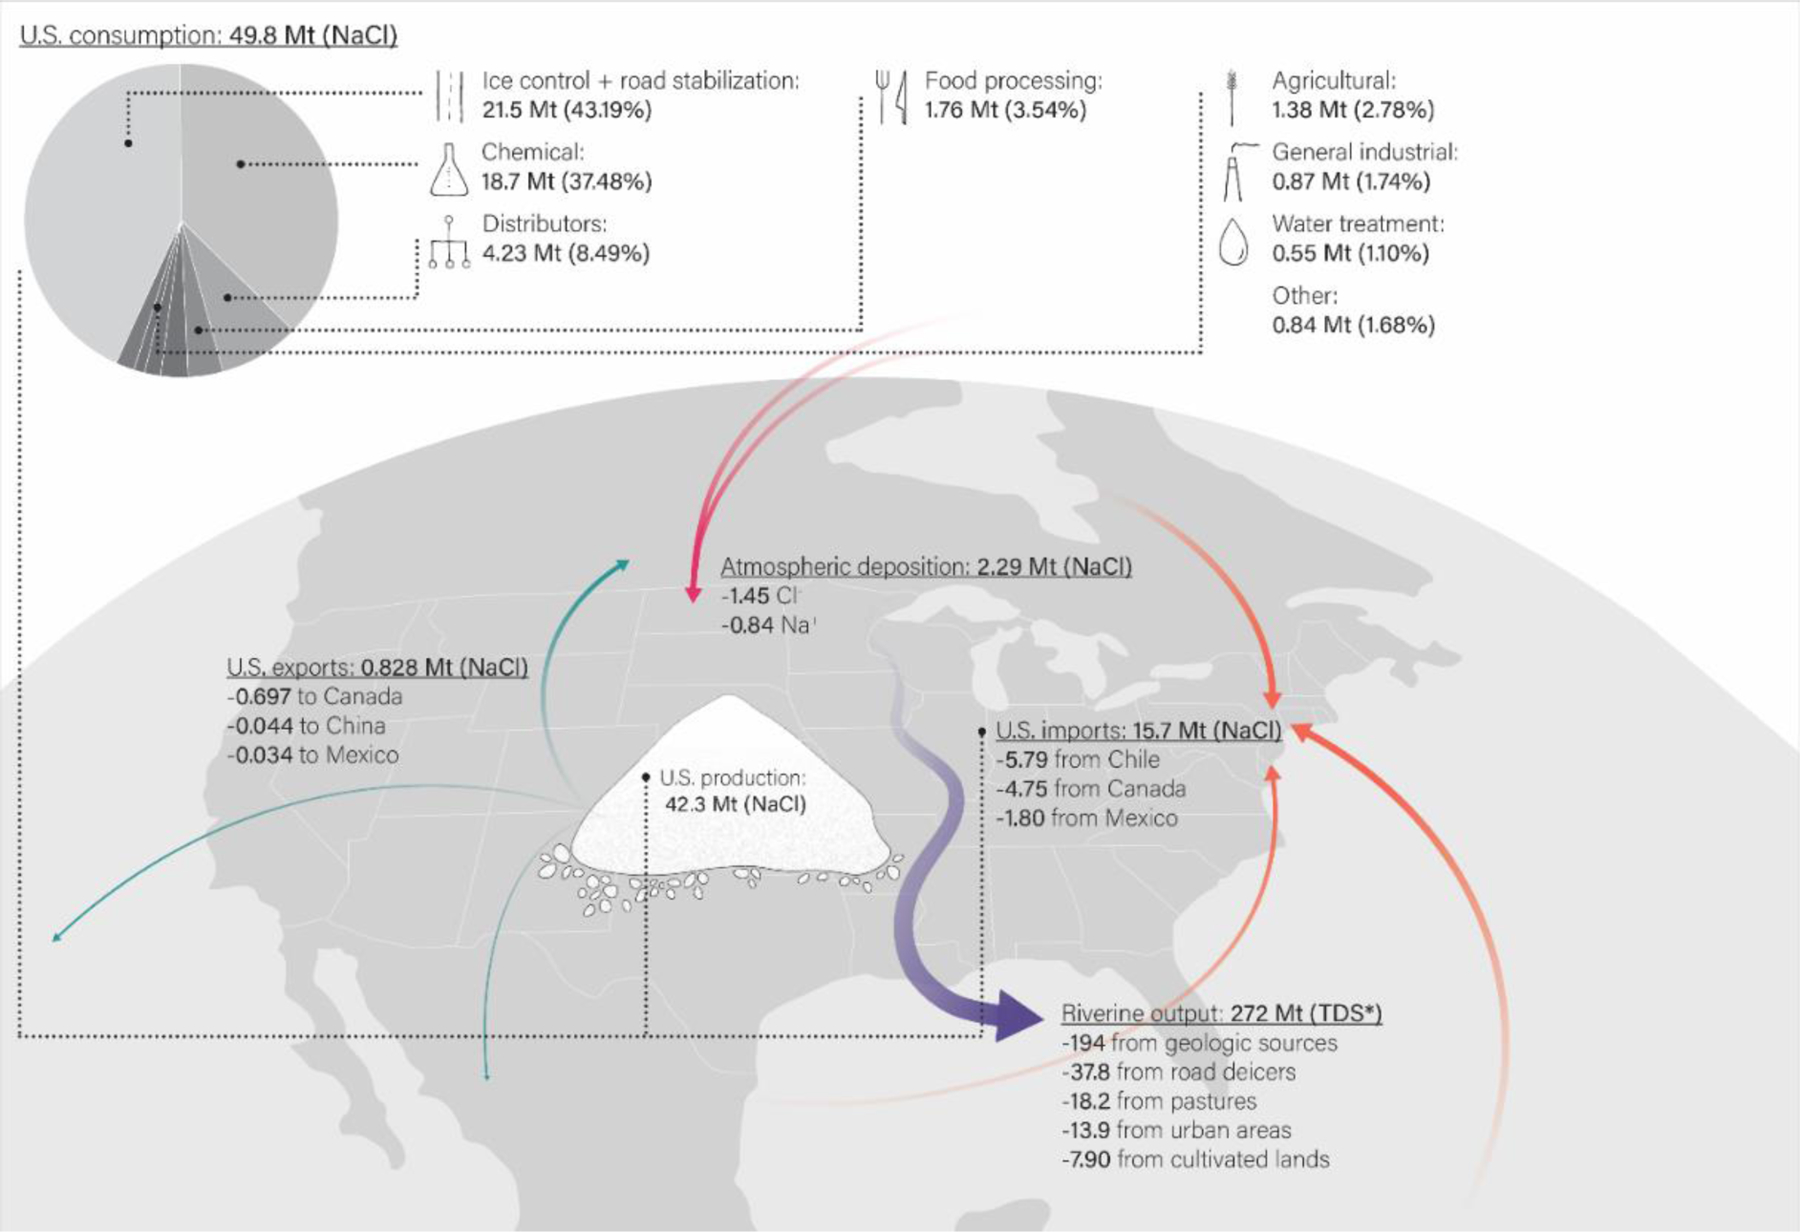
Increasing salt production and use is shifting the natural balances of salt ions across Earth systems, causing interrelated effects across biophysical systems collectively known as freshwater salinization syndrome. In this Review, we conceptualize the natural salt cycle and synthesize increasing global trends of salt production and riverine salt concentrations and fluxes. The natural salt cycle is primarily driven by relatively slow geologic and hydrologic processes that bring different salts to the surface of the Earth. Anthropogenic activities have accelerated the processes, timescales and magnitudes of salt fluxes and altered their directionality, creating an anthropogenic salt cycle. Global salt production has increased rapidly over the past century for different salts, with approximately 300 Mt of NaCl produced per year. A salt budget for the USA suggests that salt fluxes in rivers can be within similar orders of magnitude as anthropogenic salt fluxes, and there can be substantial accumulation of salt in watersheds. Excess salt propagates along the anthropogenic salt cycle, causing freshwater salinization syndrome to extend beyond freshwater supplies and affect food and energy production, air quality, human health and infrastructure. There is a need to identify environmental limits and thresholds for salt ions and reduce salinization before planetary boundaries are exceeded, causing serious or irreversible damage across Earth systems.


Conflict of interest statement

Competing Interests The authors have no competing interests.

Figures

Figure 1.
Figure 1.
a, The natural salt cycle is characterized by a balance in uplift of salts to the surface of the Earth and weathering and transport of salts to the oceans. Salinization is a natural process in many dryland environments (inset). b, The anthropogenic salt cycle is characterized by accelerated transport of salts to the surface of the Earth by mining and resource extraction, increased fluxes of salt to the atmosphere from saline dust, and increased soil salinity and evaporite formation owing to desiccation (inset). Anthropogenic sources of salts exceed natural sinks, with a wide variety of geological, chemical, biological, engineering and hydrological processes contributing to human alteration of the global salt cycle.
Figure 2.
Figure 2.. Salt production and consumption trends.
a, Rising trends in global production of salts since 1929, as reported by the USGS. b, Rising NaCl production (defined as the quantity of salt mined or manufactured that is available for sale) and consumption (defined as the quantity of salt sold or used, plus imports, minus exports) in the USA, with major uses of consumption shown.
Figure 3.
Figure 3.
Global heterogeneity in environmental salinity. a, Soils impacted by anthropogenic salinization (red-shaded areas) to at least some degree as of 2016 (ref. 93). b–e, Probability density plots showing the distributions of riverine (solid line) or groundwater (dashed line) freshwater conductivity values among countries or regions with ≥100 sites from an open-access global database of observations made over the past four decades178. Note that Eastern Australia includes Queensland, New South Wales, Victoria, Australian Capital Territory and Tasmania. Central Australia includes South Australia and Northern Territory. Electrical conductivity in water often serves as an easily measured proxy for total salinity in freshwater. Distributions reflect mean readings drawn from disparate river and stream or groundwater sampling locations from within each country or region. Coastal sites were omitted from distributions. Country or region site sample sizes are provided in the density plot legends.
Figure 4.
Figure 4.
Sodium and chloride concentrations in rivers. a,b, Rising trends in concentrations of Na+ and Cl− salt ions in select world rivers. c, Deviations in Na+:Cl− molar ratios from 1:1 (refs. –181) (indicated by dashed line). Variations Na+:Cl− molar ratios reflect variations in the sources, transport and transformation of salt ions across climate, geology, human activities, flowpaths and time. Rivers draining semiarid and arid regions with more sodic soils can have higher Na+:Cl− molar ratios whereas rivers draining humid regions have lower relative Na+:Cl− molar ratios owing to road salt (and other pollution sources) and greater retention of Na+ on soil ion exchange sites compared with Cl−. Data from the Global Freshwater Quality Database GEMStat.
Figure 5 (Box 1).
Figure 5 (Box 1).
A salt budget for the continental United States illustrating major natural and anthropogenic fluxes. The annual average NaCl production, consumption, imports, exports, and atmospheric deposition between 2013 and 2017, as well as riverine outputs of total dissolved solids (TDS) indicated by * in the continental United States, reported in million metric tons (Mt). Data on production, consumption, imports, and exports were obtained from the United State Geological Survey (USGS) Annual Minerals Yearbook. Atmospheric deposition values were interpolated and estimated from Kaushal et al. (2021) ,.

References

    1. Jackson RB & Jobbágy EG From icy roads to salty streams. Proceedings of the National Academy of Sciences 102, 14487–14488 (2005). - PMC - PubMed
    1. Anning DW & Flynn ME Dissolved-solids sources, loads, yields, and concentrations in streams of the conterminous United States. Dissolved-solids sources, loads, yields, and concentrations in streams of the conterminous United States vols 2014–5012 113 http://pubs.er.usgs.gov/publication/sir20145012 (2014).
    1. Dugan HA & Arnott SE The ecosystem implications of road salt as a pollutant of freshwaters. Wiley Interdisciplinary Reviews: Water n/a, e1629 (2022).
    1. Cañedo-Argüelles M et al. Effects of potash mining on river ecosystems: An experimental study. Environmental Pollution 224, 759–770 (2017). - PubMed
    1. Geological Survey US. How large is a lifetime supply of minerals for the average person? https://www.usgs.gov/faqs/how-large-a-lifetime-supply-minerals-average-p... (2023).