Comment
. 2024 Mar 7:15:1363169.
doi: 10.3389/fimmu.2024.1363169. eCollection 2024.

Decidual leukocytes respond to African lineage Zika virus infection with mild anti-inflammatory changes during acute infection in rhesus macaques

Affiliations
Comment

Decidual leukocytes respond to African lineage Zika virus infection with mild anti-inflammatory changes during acute infection in rhesus macaques

Michelle R Koenig et al. Front Immunol. .

Abstract

Zika virus (ZIKV) can be vertically transmitted during pregnancy resulting in a range of adverse pregnancy outcomes. The decidua is commonly found to be infected by ZIKV, yet the acute immune response to infection remains understudied in vivo. We hypothesized that in vivo African-lineage ZIKV infection induces a pro-inflammatory response in the decidua. To test this hypothesis, we evaluated the decidua in pregnant rhesus macaques within the first two weeks following infection with an African-lineage ZIKV and compared our findings to gestationally aged-matched controls. Decidual leukocytes were phenotypically evaluated using spectral flow cytometry, and cytokines and chemokines were measured in tissue homogenates from the decidua, placenta, and fetal membranes. The results of this study did not support our hypothesis. Although ZIKV RNA was detected in the decidual tissue samples from all ZIKV infected dams, phenotypic changes in decidual leukocytes and differences in cytokine profiles suggest that the decidua undergoes mild anti-inflammatory changes in response to that infection. Our findings emphasize the immunological state of the gravid uterus as a relatively immune privileged site that prioritizes tolerance of the fetus over mounting a pro-inflammatory response to clear infection.

Keywords: Zika virus; decidua; immunome; inflammation; pregnancy; rhesus macaque.


Conflict of interest statement

The authors declare that the research was conducted in the absence of any commercial or financial relationships that could be construed as a potential conflict of interest.

Figures
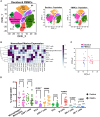
Figure 1
Figure 1
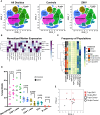
Evaluation of total leukocytes in decidual and PBMC samples from all pregnancies. (A) t-SNE map generated from pre-gated (live, CD45+, single cells) leukocytes from the decidua and PBMCs showing CD4 T cells, CD8 T cells, macrophage/monocytes, dendritic cells (DC), innate lymphoid cells (ILCs), B cells, CD8+ CD4+ double-positive (DP) T cells, and CD8- CD4- double-negative (DN) T cells identified by FlowSOM clustering. Panels to the right show the distribution of those cells, specifically within decidua and PBMC samples. (B) Heatmap of each marker’s median fluorescent intensity (MFI) in the clusters identified by FlowSOM. Marker expression is normalized by column. (C) Principal component analysis of the MFI of each marker within each cluster as shown in (B) from all decidua (n=15) and PBMC (n=15) samples. (D) Scatter plot of the frequency of the major immune cell populations found in each decidual (n=15) and PBMC (n=15) sample. The relative frequency of each population was compared using a paired t-test; the p values for each test are shown; * indicates significant p values (p < 0.05 is considered significant).
Figure 2
Figure 2
Evaluation of total leukocytes in decidua samples from ZIKV- and control-treated dams. (A) t-SNE map generated from pre-gated leukocytes from the decidua showing CD4 T cells, CD8 T cells, macrophages, dendritic cells (DC), innate lymphoid cells (ILCs), and B cells identified by FlowSOM clustering. Left panel: all samples, center: control samples, right: ZIKV samples. The respective percentage for each population is shown under each population name. (B) Heatmap of the MFI of each marker in the clusters identified by FlowSOM. Marker expression is normalized by column. (C) Heatmap of leukocyte population frequencies. Each row represents one sample. Each sample’s treatment and group identity is annotated on the left side of the heatmap. (D) Scatter plot of the frequency of the major immune cell populations found in pooled ZIKV vs. Control samples. The relative frequency of each population was compared using a t-test; the p values for each test are shown; * indicates significant p values. (E) Principal component analysis of the MFI of each marker and cluster as shown in (B).
Figure 3
Figure 3
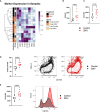
Decidual macrophage populations in ZIKV and control samples. (A) Heatmap of the MFI of each macrophage marker. Marker expression is normalized by column. Each row represents one sample for which the group and treatment are annotated on the left side. (B) Scatter plots showing the MFI of CD69 and (C) the MFI of CD163 in macrophages from ZIKV and control samples. (D) Scatter plot showing the frequency of CD163+ macrophages within all macrophages for each sample. Flow plots to the right show gating of CD163+ macrophages in representative control (black) and ZIKV (red) samples. (E) Scatter plot showing the MFI of CD163 in CD163+ macrophages and a histogram of the data shown in the flow plots in (C). Comparisons were made using a t-test; * indicates a statistically significant p value.
Figure 4
Figure 4
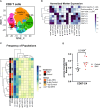
Evaluation of decidual ILCs from ZIKV and control samples. (A) t-SNE map generated from pre-gated ILCs from the decidua showing the populations identified by FlowSOM clustering. The left panel shows decidual ILCs from all samples, the center panel control, and the right panel ZIKV. The respective percentage for each population is shown under each population name. (B) Heatmap of the MFI of each marker in the clusters identified by FlowSOM. Marker expression is normalized by column. Black triangles indicate markers used for clustering. (C) Heatmap of the ILC population frequencies. Each row represents one sample. Each sample’s treatment and group identity is annotated on the left side of the heatmap.
Figure 5
Figure 5
Comparison of decidual ILCs between ZIKV and control samples. (A) Scatter plot showing the percent of ILC-C1 at the group level. Significance was determined by a one-way ANOVA followed by a Bonferroni’s comparison test. (B) Scatter plot comparing the arcsine transformed MFI of Eomes per sample in the four clusters labeled on the x-axis. (C) Comparison of the MFI of RORγt in ILC3-C of ZIKV and control samples. (D) Scatter plot showing the arcsine transformed MFI of CD11c in control samples. (B-D) Comparisons were made using a t-test; * indicates a statistically significant p value.
Figure 6
Figure 6
Evaluation of decidual Cytotoxic T cells from ZIKV and control samples. (A) t-SNE map generated from pre-clustered CD8+ Cytotoxic T cells from the decidua showing populations identified by FlowSOM clustering. DN, double-negative T cells (CD8- CD4-); DP, Double-positive T cells (CD8+ CD4+). (B) Heatmap of the MFI of each marker in the clusters identified by FlowSOM. Marker expression is normalized by column. Black triangles indicate markers used for clustering. (C) Heatmap of the CD8 T cell population frequencies. Each row represents one sample. Treatment and group identity of each sample is annotated on the left side of the heatmap. (D) A scatter plot comparing the arcsine transformed MFI of Eomes in ZIKV and control samples in CD8T-C4. Comparisons were made using a t-test; * indicates a significant p value.
Figure 7
Figure 7
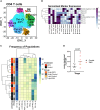
Evaluation of decidual helper T cells from ZIKV and control samples. (A) t-SNE map generated from pre-gated CD4+ helper T cells from the decidua showing populations identified by FlowSOM clustering. DN = double-negative T cells (CD8- CD4-). DP = Double-positive T cells (CD8+ CD4+). (B) Heatmap of the MFI of each marker in the clusters identified by FlowSOM. Marker expression is normalized by column. Black triangles indicate markers used for clustering. (C) Heatmap of the CD4 T cell population frequencies. Each row represents one sample. Treatment and group identity of each sample is annotated on the left side of the heatmap. (D) Scatter plot comparing the arcsine transformed MFI of FoxP3 in ZIKV and control cells in the Treg cluster. Comparisons were made using a t-test; * indicates a significant p value.
Figure 8
Figure 8
Cytokines and chemokines in decidual samples. (A) Heatmap of normalized cytokine and chemokine values (columns) from decidua samples (rows). Values are normalized by column. Samples are annotated on the left side of the heatmap, showing the treatment, group, and approximate gestational age in days (gd) of the sample. (B) Comparison of IL-23, IL-8, and IL-12p40 in decidua samples from ZIKV vs. controls. A t-test was used to determine statistical significance. (C) Comparisons of TNF-ɑ, IL-1β, and IL-10 at the group level. (B, C) P values for each comparison are shown. Significance was determined using a one-way ANOVA followed by followed by a Bonferroni’s comparison test. * indicates statistically significant p values.
Figure 9
Figure 9
Cytokines and chemokines in placenta and fetal membranes. (A) Heatmaps of normalized cytokine and chemokine values (columns) from samples (rows). Chorionic villi samples are shown on the left panel and chorionic plate samples on the right. Values are normalized by column. Samples are annotated on the left side of the heatmaps, showing the treatment, group, and approximate gestational age in days (gd) of the sample. (B) Comparison of IFN-β levels in chorionic villous samples (left panel) and IL-6 values in chorionic plate samples (right panel) from ZIKV and controls. Significance was determined by a one-way ANOVA followed by a Bonferroni’s comparison test. (C) Comparison of IL-6 and IP-10 in chorionic villous samples between samples that were ZIKV-exposed but uninfected and samples with confirmed ZIKV infection in the villi. Significance was determined by a t-test. (B, C) P values for each comparison are shown; * indicates statistically significant p values. (D) Heatmap of normalized cytokine and chemokine values (columns) from samples (rows). Values are normalized by column. Samples are annotated on the left side of the heatmap, showing tissue (amniotic and chorionic membrane), the treatment, and the group.

Comment on

References

    1. Dick GWA. Zika Virus (I). Isolations and serological specificity. Trans R Soc Trop Med Hyg. (1952) 46:509–20. doi: 10.1016/0035-9203(52)90042-4 - DOI - PubMed
    1. Hayes EB. Zika virus outside Africa. Emerg Infect Dis. (2009) 15:1347–50. doi: 10.3201/eid1509.090442 - DOI - PMC - PubMed
    1. Metsky HC, Matranga CB, Wohl S, Schaffner SF, Freije CA, Winnicki SM, et al. . Zika virus evolution and spread in the Americas. Nature. (2017) 546:411–5. doi: 10.1038/nature22402 - DOI - PMC - PubMed
    1. CDC . CDC concludes Zika causes microcephaly and other birth defects. CDC Newsroom; (2016). Available at: https://www.cdc.gov/media/releases/2016/s0413-zika-microcephaly.html.
    1. Brasil P, Pereira JP, Moreira ME, Ribeiro Nogueira RM, Damasceno L, Wakimoto M, et al. . Zika Virus Infection in Pregnant Women in Rio de Janeiro. N Engl J Med. (2016) 375:2321–34. doi: 10.1056/NEJMoa1602412 - DOI - PMC - PubMed

Publication types