

Socioeconomic inequality in health in older adults in Brazil
- PMID: 38515904
- PMCID: PMC10953994
- DOI: 10.1016/j.dialog.2022.100009
Socioeconomic inequality in health in older adults in Brazil
Abstract
Objective: This study analyzed socioeconomic inequality in self-rated health for older adults (aged fifty or over) in Brazil.
Methods: Data from the 2015-2016 Brazilian Longitudinal Study of Aging (ELSI-Brazil). Socioeconomic inequality in self-rated health was measured using the concentration index, which was decomposed to analyze the contribution of different factors.
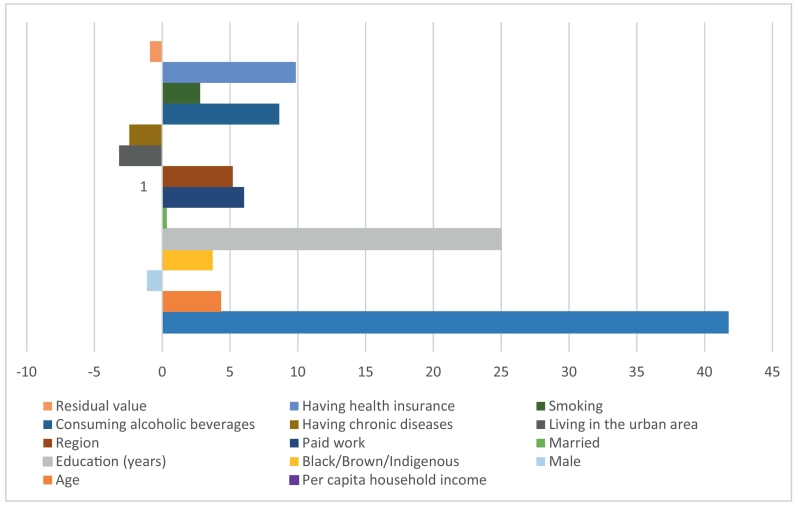
Results: This study revealed that 11.5% of the older adults interviewed reported their health as poor and very poor. For the complete sample, the estimated concentration index, -0.2434, indicated that there is a concentration of poor and very poor self-rated health among older and poorer adults. Income, education and having a private health insurance plan are the factors that contributed most to the observed inequality.
Discussion: The decomposition showed that there are avoidable inequalities in relation to socioeconomic status for older adults in Brazil. These factors can guide the formulation of social and health policies aimed at reducing health inequalities.
Keywords: Concentration index; Older adults; Self-rated health; Socioeconomic inequalities.
© 2022 The Authors.
Conflict of interest statement
None.
Figures

Similar articles
-
Inequalities in basic activities of daily living among older adults: ELSI-Brazil, 2015.Rev Saude Publica. 2018 Oct 25;52Suppl 2(Suppl 2):14s. doi: 10.11606/S1518-8787.2018052000617. Rev Saude Publica. 2018. PMID: 30379283 Free PMC article.
-
Evaluating socioeconomic inequalities in self-rated oral health and its contributing factors in Brazilian older adults.PLoS One. 2025 Jan 3;20(1):e0316145. doi: 10.1371/journal.pone.0316145. eCollection 2025. PLoS One. 2025. PMID: 39752470 Free PMC article.
-
Socioeconomic-related inequalities in self-rated health status in Kermanshah city, Islamic Republic of Iran: a decomposition analysis.East Mediterr Health J. 2020 Jul 23;26(7):820-827. doi: 10.26719/emhj.20.001. East Mediterr Health J. 2020. PMID: 32794168
-
How is smoking distributed in relation to socioeconomic status? Evidence from Brazil in the years 2013 and 2019.Econ Hum Biol. 2023 Apr;49:101240. doi: 10.1016/j.ehb.2023.101240. Epub 2023 Mar 24. Econ Hum Biol. 2023. PMID: 37044042
-
Measurement and decomposition of income-related inequality in self-rated health among the elderly in China.Int J Equity Health. 2019 Jan 8;18(1):4. doi: 10.1186/s12939-019-0909-2. Int J Equity Health. 2019. PMID: 30621687 Free PMC article.
Cited by
-
Sarcopenia in the Oldest-Old Adults in the Capital of Brazil: Prevalence and Its Associated Risk Factors.Nutrients. 2024 Nov 21;16(23):3976. doi: 10.3390/nu16233976. Nutrients. 2024. PMID: 39683370 Free PMC article.
-
Environmental justice beyond race: Skin tone and exposure to air pollution.Proc Natl Acad Sci U S A. 2025 Mar 11;122(10):e2407064122. doi: 10.1073/pnas.2407064122. Epub 2025 Mar 4. Proc Natl Acad Sci U S A. 2025. PMID: 40035760 Free PMC article.
-
Interrelationships of frailty, hemoglobin, cognition, and depressive symptoms in aging: a path analysis of the ELSI-Brazil study.Cad Saude Publica. 2025 Apr 28;41(3):e00105124. doi: 10.1590/0102-311XEN105124. eCollection 2025. Cad Saude Publica. 2025. PMID: 40298671 Free PMC article.
-
Dysphagia in frail elderly: self-reported mealtime symptoms and risk.Rev Saude Publica. 2025 Aug 25;59:e23. doi: 10.11606/s1518-8787.2025059006440. eCollection 2025. Rev Saude Publica. 2025. PMID: 40862426 Free PMC article.
References
-
- U.N . United Nations Department of Economic and Social Affairs; 2015. UN Adopts New Global Goals, Charting Sustainable Development for People and Planet by 2030.http://www.un.org/en/development/desa/news/sustainable/un-adopts-new-glo...
-
- U. Desa . Online ed. UN DESA; New York: 2015. United Nations Department of Economic and Social Affairs, Population Division. World Population Prospects: The 2015 Revision, Key Findings and Advance Tables.
-
- U.N. Desa . Vol. 11. United Nations Department for Economic and Social Affairs; New York (US): 2019. World Population Prospects 2019: Highlights; p. 125.
-
- Vasto S., Scapagnini G., Bulati M., Candore G., Castiglia L., Colonna-Romano G., et al. Biomarkes of aging. Front Biosci (Schol Ed). 2010;2:392–402. - PubMed
-
- Organization W.H. World Health Organization; 2015. World Report on Ageing and Health.
LinkOut - more resources
Full Text Sources
