. 2024 Mar 20;13(1):2327682.
doi: 10.1080/2162402X.2024.2327682. eCollection 2024.

STING is significantly increased in high-grade glioma with high risk of recurrence

Affiliations

STING is significantly increased in high-grade glioma with high risk of recurrence

Meishi Zhong et al. Oncoimmunology. .

Abstract

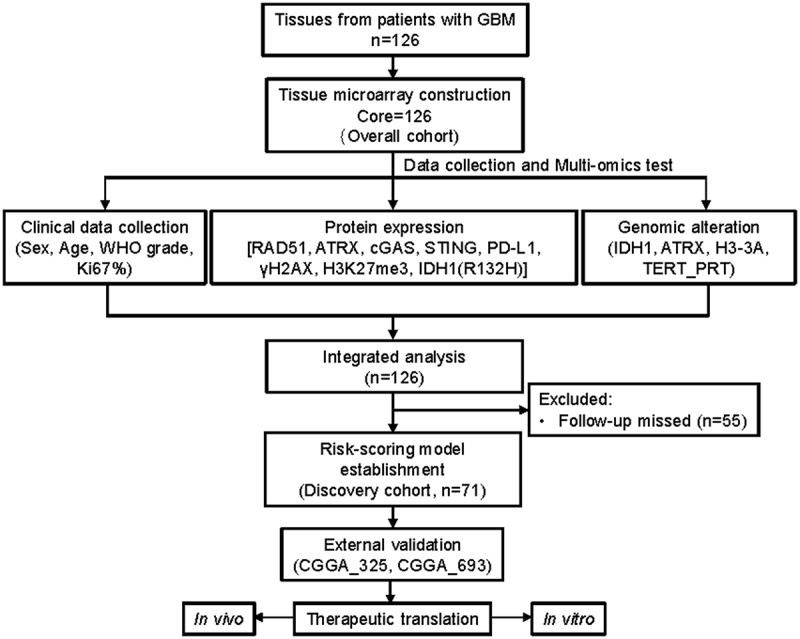
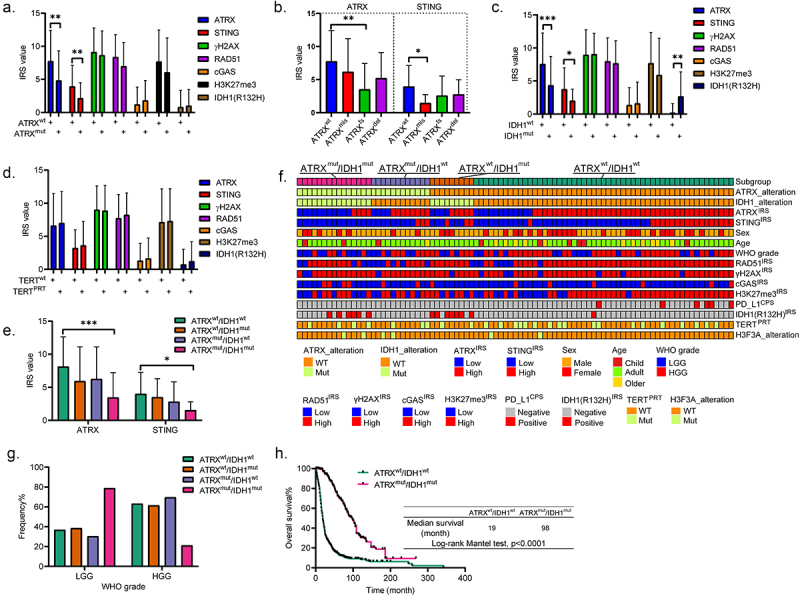
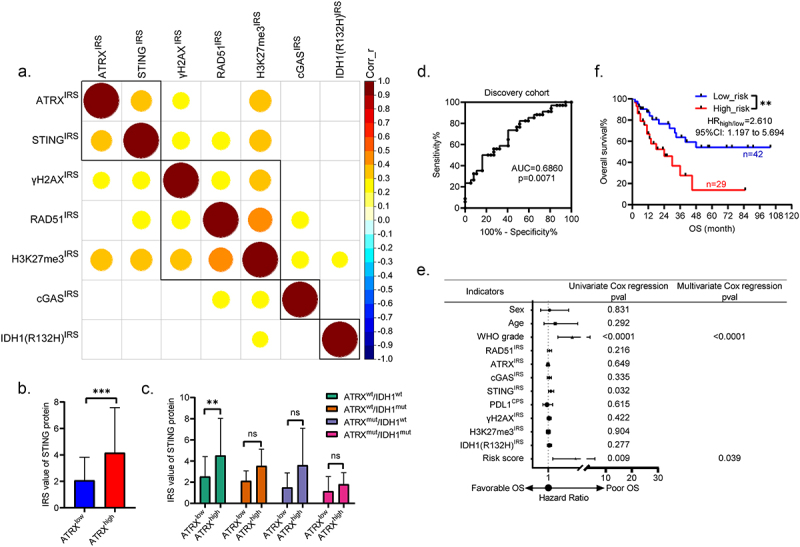
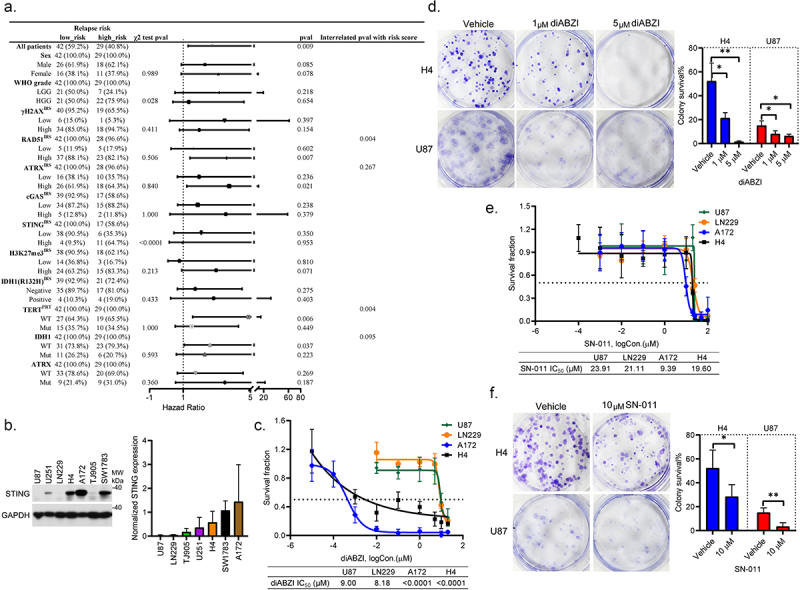
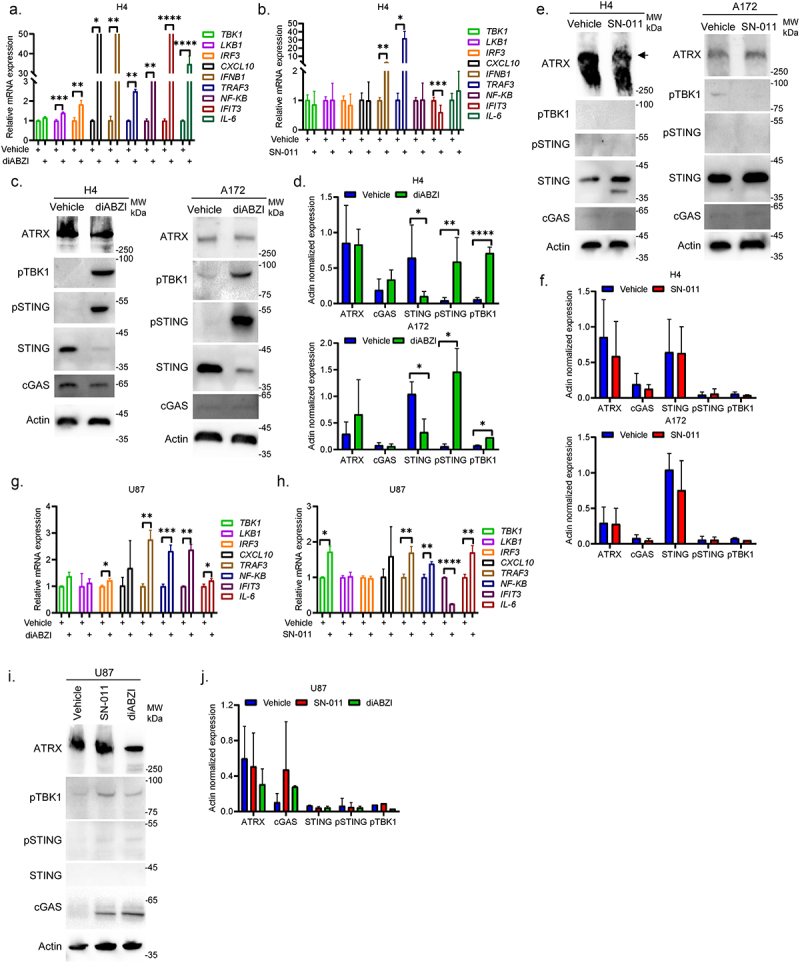
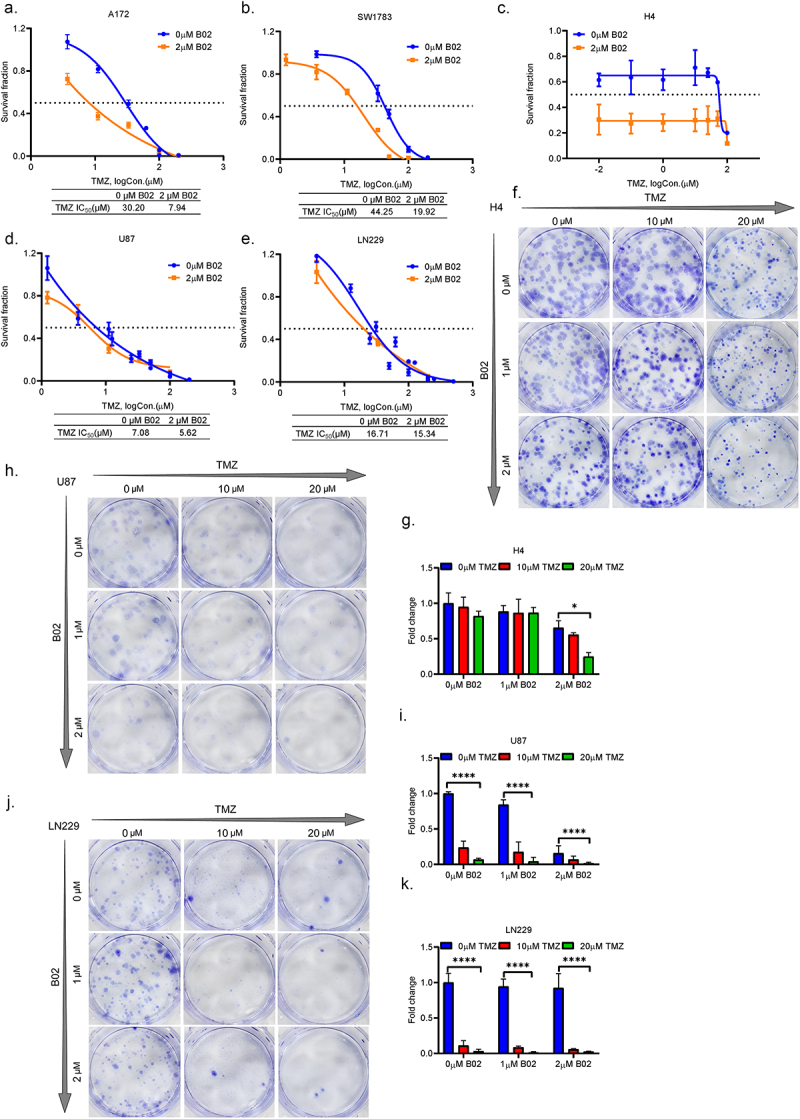
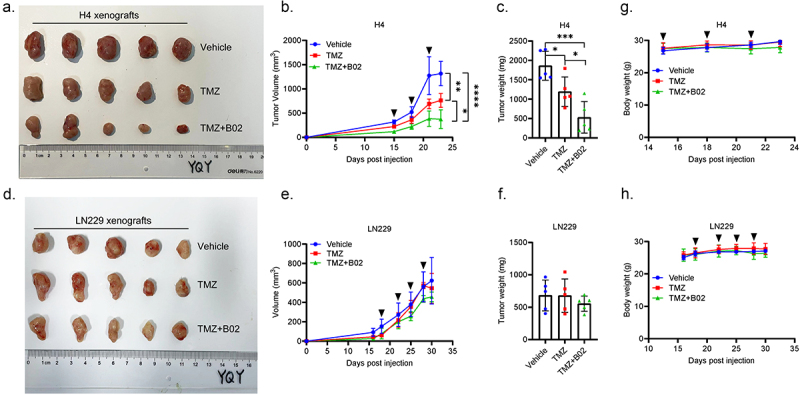
In this study, we aimed to comprehensively characterize the potential relationships among the frequently mutated genes, well-known homologous recombination repair (HRR) proteins, and immune proteins in glioma from a clinical perspective. A total of 126 surgical tissues from patients initially diagnosed with glioma were included. The genetic alterations were tested using the targeted next-generation sequencing technique. The expression of HRR proteins, immune proteins, and genetic alteration-related proteins were detected using immunostaining. Integrated analysis showed that ATRX is positively correlated with STING in high-grade glioma (HGG) with wild-type ATRX and IDH1. Then, a relapse predictive risk-scoring model was established using the least absolute shrinkage and selection operator regression algorithms. The scores based on the expression of ATRX and STING significantly predict the recurrence for glioma patients, which further predict the survival for specific subgroups, characterized with high expression of RAD51 and wild-type TERT. Moreover, STING is significantly higher in patients with high relapse risk. Interestingly, STING inhibitors and agonists both suppress the growth of HGG cells, regardless of their STING levels and STING pathway activity, whereas RAD51 inhibitor B02 is found to exclusively sensitize HGG cells with high expression of STING to temozolomide in vitro and in vivo. Overall, findings in the study not only reveal that ATRX is closely correlated with STING to drive the relapse of HGG, but also provide a STING-guided combined strategy to treat patients with aggressive gliomas. Translation of these findings will ultimately improve the outcomes for ATRX and IDH1 genomically stratified subgroups in HGG.

Keywords: ATRX; IDH1; RAD51 inhibitor; STING; high-grade glioma; temozolomide sensitivity.


Conflict of interest statement

No potential conflict of interest was reported by the author(s).

Figures

Figure 1.
Figure 1.
Work flowchart of this clinical and translational study.
Figure 2.
Figure 2.
ATRX and STING are both highly expressed in HGG with wild-type ATRX and IDH1. (a). The bar plots showing the different expression of indicated proteins in tissues with ATRXwt or ATRXmut. The IRS values are shown as mean ± STD. **p < 0.01. (b). The bar plots showing the different expression of ATRX and STING in tissues with different types of ATRX mutations. mis, missense; fs, frameshift; del, deletion. The IRS values are shown as mean ± STD. *p < 0.05, **p < 0.01. (c). The bar plots showing the different expression of indicated proteins in tissues with IDH1wt or IDH1mut. The IRS values are shown as mean ± STD. *p < 0.05, **p < 0.01, ***p < 0.001. (d). The bar plots showing the different expression of indicated proteins in glioma tissues with TERTwt or TERTPRT. The IRS values are shown as mean ± STD. (e). The bar plots showing the different expression of ATRX and STING in ATRX and IDH1 genetically stratified glioma subgroups. The IRS values are shown as mean ± STD. *p < 0.05, ***p < 0.001. (f). The heatmaps showing the features of clinicopathology, genetic alterations, immune proteins, and HRR proteins in ATRX and IDH1 genetically stratified glioma subgroups. (g). The bar plots showing the frequency of ATRX and IDH1 genetically stratified cases in LGG and HGG. (h). The KM survival curves showing the different OS rates between glioma patients from cBioportal database with ATRXwt/IDH1wt and ATRXmut/IDH1mut.
Figure 3.
Figure 3.
ATRX is positively correlated with STING to drive the relapse of HGG with wild-type ATRX and IDH1. (a). The matrix showing the mutual correlations among indicated proteins in the overall cohort. Blank grids mean p > 0.05, while colored grids mean p < 0.05. Corr_r, correlation coefficient. (b). The bar plots showing the different expression of STING in tissues with ATRXlow or ATRXhigh. The IRS values are shown as mean ± STD. ***p < 0.001. (c). The bar plots showing the differential expression of STING in ATRX and IDH1 genomically stratified subgroups with ATRXhigh and ATRXlow. The IRS values are shown as mean ± STD. **p < 0.01. (d). The ROC curve evaluating the predictive capability of relapse risk scores in the discovery cohort. AUC = 0.6860, **p < 0.01. (e). The forest plot showing the univariate and multivariate cox regression analysis used to identify independent prognostic markers in the discovery cohort. (f). The KM survival curves showing the different OS rates between patients with low_risk and high_risk scores in the discovery cohort. **p < 0.01.
Figure 4.
Figure 4.
The STING targeted therapies are both promising in suppressing the growth of HGG cells regardless of STING levels. (a). The multiplex forest plot showing the correlation and differential prognosis of risk scores in clinical and molecular features stratified subgroups. (b). The representative western blotting results showing the expression of indicated proteins in HGG cells (left panel). The GAPDH normalized relative expression of STING from at least three independent experiments is shown as mean ± STD (right panel). (c). The survival curves showing the responses of indicated HGG cells to STING agonist diABZI. Data from at least three independent assays are shown as mean ± STD. (d). The representative colony formation results of indicated HGG cells in response to different concentrations of diABZI, taking the vehicle treated cells as controls. Data from three independent experiments are shown as mean ± STD. *p < 0.05, **p < 0.01. (e). The survival curves showing the responses of indicated HGG cells to STING inhibitor SN-011. Data from at least three independent assays are shown as mean ± STD. (f). The representative colony formation results of indicated HGG cells in response to SN-011, taking the vehicle treated cells as controls. Data from three independent experiments are shown as mean ± STD. *p < 0.05, **p < 0.01.
Figure 5.
Figure 5.
The STING targeted therapies are both promising in suppressing the growth of HGG cells regardless of STING pathway activation. (a–b). The bar plots showing the differential expressions of STING-related inflammatory genes in H4 cells tested by qRT-PCR assays in response to diABZI (a) and SN-011 (b). Data from three independent experiments are shown as mean ± STD. *p < 0.05, **p < 0.01, ***p < 0.001, ****p < 0.0001. (c,d). The representative western blotting results of indicated proteins in H4 and A172 cells treated with vehicle or diABZI (c). The actin normalized expression of indicated proteins from at least three independent assays are shown as mean ± STD (d). *p < 0.05, **p < 0.01 and ****p < 0.0001. (e,f). The representative western blotting results of indicated proteins in H4 and A172 cells treated with vehicle or SN-011 (e). The actin normalized expression of indicated proteins from at least three independent assays are shown as mean ± STD (f). (g,h). The bar plots showing the differential expressions of STING related inflammatory genes in U87 cells tested by qRT-PCR assays in response to diABZI (g) and SN-011 (h). Data from three independent experiments are shown as mean ± STD. *p < 0.05, **p < 0.01, ***p < 0.001, and ****p < 0.0001. (i,j). The representative western blotting results of indicated proteins in U87 cells treated with vehicle or diABZI or SN-011 (i). The actin normalized expression of indicated proteins from at least three independent assays are shown as mean ± STD.
Figure 6.
Figure 6.
RAD51 inhibitor B02 significantly sensitizes HGG cells with high expression of STING to TMZ in vitro. (a–c). The survival curves showing the responses of STING proficient A172 (a), SW1783 (b) and H4 (c) cells to TMZ treatments with or without 2 μM RAD51 inhibitor B02. Data from at least three independent experiments are shown as mean ± STD. (d–e). The survival curves showing the responses of STING deficient U87 (d) and LN229 (e) cells to TMZ treatments with or without 2 μM RAD51 inhibitor B02. Data from at least three independent experiments are shown as mean ± STD. (f–k). The representative colony formation results of H4 cells (f), U87 cells (h) and LN229 cells (j) in response to different combined treatments of B02 and TMZ. The vehicle treated cells (0 μM B02 + 0 μM TMZ) normalized fold changes of H4 cells (g), U87 cells (i) and LN229 cells (k) from three independent experiments are shown as mean ± STD (g). *p < 0.05.
Figure 7.
Figure 7.
B02 exclusively sensitizes HGG cells with high expression of STING to TMZ in vivo. (a). Image of H4 (STINGhigh) xenografts from NOD SCID mice administered with vehicle (n = 5), 50 mg/kg TMZ (n = 5) and 50 mg/kg TMZ plus 25 mg/kg B02 (n = 5), respectively. (b). The growth curves of H4 ×enografts in response to indicated treatments, shown by the tumor volumes (mm3). (c). The tumor weights of H4 ×enografts in figure 7A. (d). Image of LN229 (STINGlow) xenografts from NOD SCID mice administered with vehicle (n = 5), 50 mg/kg TMZ (n = 5) and 50 mg/kg TMZ plus 25 mg/kg B02 (n = 5), respectively. (e). The growth curves of LN229 ×enografts in response to indicated treatments, shown by the tumor volumes (mm3). (f). The tumor weights of LN229 ×enografts in figure 7D. (g–h). The body weights of H4 (g) and LN229 (h) bearing NOD SCID mice in response to indicated treatments. Black arrows indicate the therapeutic administration. *p < 0.05, **p < 0.01, ***p < 0.001, ****p < 0.0001.

Similar articles

Cited by

References

    1. Bauchet L, Ostrom QT.. Epidemiology and molecular epidemiology. Neurosurg Clin N Am. 2019. Jan;30(1):1–13. doi:10.1016/j.nec.2018.08.010. - DOI - PubMed
    1. Berger TR, Wen PY, Lang-Orsini M, Chukwueke UN.. World health organization 2021 classification of central nervous system tumors and implications for therapy for adult-type gliomas: a review. JAMA Oncol. Oct 1 2022;8(10):1493–1501. doi:10.1001/jamaoncol.2022.2844. - DOI - PubMed
    1. Gallego O. Nonsurgical treatment of recurrent glioblastoma. Curr Oncol. 2015. Aug;22(4):273–281. doi:10.3747/co.22.2436. - DOI - PMC - PubMed
    1. Kannan S, Murugan AK, Balasubramanian S, Munirajan AK, Alzahrani AS. Gliomas: genetic alterations, mechanisms of metastasis, recurrence, drug resistance, and recent trends in molecular therapeutic options. Biochem Pharmacol. 2022. Jul;201:115090. doi:10.1016/j.bcp.2022.115090. - DOI - PubMed
    1. Haase S, Banerjee K, Mujeeb AA, Hartlage CS, Núñez FM, Núñez FJ, Alghamri MS, Kadiyala P, Carney S, Barissi MN. et al. H3.3-G34 mutations impair DNA repair and promote cGAS/STING-mediated immune responses in pediatric high-grade glioma models. J Clin Invest. Nov 15 2022;132(22). doi:10.1172/JCI154229. - DOI - PMC - PubMed