

What do macroinvertebrate indices measure? Stressor-specific stream macroinvertebrate indices can be confounded by other stressors
- PMID: 38516302
- PMCID: PMC10952762
- DOI: 10.1111/fwb.14106
What do macroinvertebrate indices measure? Stressor-specific stream macroinvertebrate indices can be confounded by other stressors
Abstract
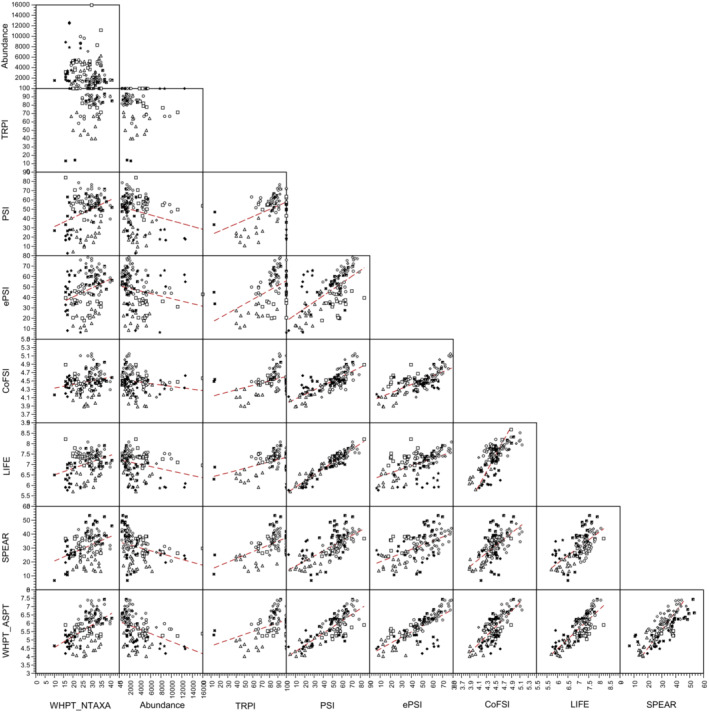
Monitoring programmes worldwide use biota to assess the "health" of water bodies. Indices based on biota are used to describe the change in status of sites over time, to identify progress against management targets and to diagnose the causes of biological degradation. A variety of numerical stressor-specific biotic indices have been developed based on the response of biota to differences in stressors among sites. Yet, it is not clear how variation in pressures within sites, over what time period, and in what combination has the greatest impact on different biotic groups. An understanding of how temporal variation in pressures influences biological assessment indices would assist in setting achievable targets and help focus catchment-scale mitigation strategies to ensure that they deliver the desired improvements in biological condition.Hydrochemical data provided by a network of high-frequency (15 or 30 min) automated monitoring stations over 3 years were matched to replicated biological data to understand the influence of spatio-temporal variation in pollution pressures on biological indices. Hydrochemical data were summarised in various ways to reflect central tendency, peaks, troughs and variation over 1-90 days before the collection of each biological sample. An objective model selection procedure was used to determine which hydrochemical determinand, and over what time period, best explained variation in the biological indices.Stressor-specific indices derived from macroinvertebrates which purportedly assess stress from low flows, excess fine sediment, nutrient enrichment, pesticides and organic pollution were significantly inter-correlated and reflected periods of low oxygen concentration, even though only one index (ASPTWHPT, average score per taxon) was designed for this purpose. Changes in community composition resulting from one stressor frequently lead to confounding effects on stressor-specific indices.Variation in ASPTWHPT was best described by dissolved oxygen calculated as Q5 over 10 days, suggesting that low oxygen events had most influence over this period. Longer-term effects were apparent, but were masked by recovery. Macroinvertebrate abundance was best described by Q95 of stream velocity over 60 days, suggesting a slower recovery in numbers than in the community trait reflected by ASPTWHPT.Although use of ASPTWHPT was supported, we recommend that additional independent evidence should be used to corroborate any conclusions regarding the causes of degradation drawn from the other stressor-specific indices. The use of such stressor-specific indices alone risks the mistargeting of management strategies if the putative stressor-index approach is taken to be more reliable than the results herein suggest.
Keywords: bioassessment; diffuse pollution; high frequency monitoring; hydrochemistry; multiple stressors.
© 2023 The Authors. Freshwater Biology published by John Wiley & Sons Ltd.
Conflict of interest statement
The authors declare no conflicts of interest.
Figures


References
-
- Armitage, P. D. , Moss, D. , Wright, J. F. , & Furse, W. T. (1983). The performance of a new biological water quality score system based on macroinvertebrates over a wide range of unpolluted running‐water sites. Water Research, 17, 333–347. 10.1016/0043-1354(83)90188-4 - DOI
-
- Beketov, M. A. , Foit, K. , Schäfer, R. B. , Schriever, C. A. , Sacchi, A. , Capri, E. , Biggs, J. , Wells, C. , & Liess, M. (2009). SPEAR indicates pesticide effects in streams—Comparative use of species‐ and family‐level biomonitoring data. Environmental Pollution, 157, 1841–1848. 10.1016/j.envpol.2009.01.021 - DOI - PubMed
-
- Birk, S. , Bonne, W. , Borja, A. , Brucet, S. , Courrat, A. , Poikane, S. , Solimini, A. , van de Bund, S. , Zampoukas, N. , & Hering, D. (2012). Three hundred ways to assess Europe's surface waters: An almost complete overview of biological methods to implement the water framework directive. Ecological Indicators, 18, 31–41. 10.1016/j.ecolind.2011.10.009 - DOI
-
- Birk, S. , Chapman, D. , Carvalho, L. , Spears, B. M. , Andersen, H. E. , Argillier, C. , Auer, S. , Baattrup‐Pedersen, A. , Banin, L. , Beklioğlu, M. , Bondar‐Kunze, E. , Borja, A. , Branco, P. , Bucak, T. , Buijse, A. D. , Cardoso, A. C. , Couture, R. M. , Cremona, F. , de Zwart, D. , … Hering, D. (2020). Impacts of multiple stressors on freshwater biota across spatial scales and ecosystems. Nature Ecology & Evolution, 4, 1060–1068. 10.1038/s41559-020-1216-4 - DOI - PubMed
-
- Blaen, P. J. , Khamis, K. , Lloyd, C. E. M. , Bradley, C. , Hannah, D. , & Krause, S. (2016). Real‐time monitoring of nutrients and dissolved organic matter in rivers: Capturing event dynamics, technological opportunities and future directions. Science of the Total Environment, 569, 647–660. 10.1016/j.scitotenv.2016.06.116 - DOI - PubMed
Grants and funding
LinkOut - more resources
Full Text Sources