. 2024 Feb 22;9(6):e171961.
doi: 10.1172/jci.insight.171961.

Tubular CPT1A deletion minimally affects aging and chronic kidney injury

Affiliations

Tubular CPT1A deletion minimally affects aging and chronic kidney injury

Safaa Hammoud et al. JCI Insight. .

Abstract

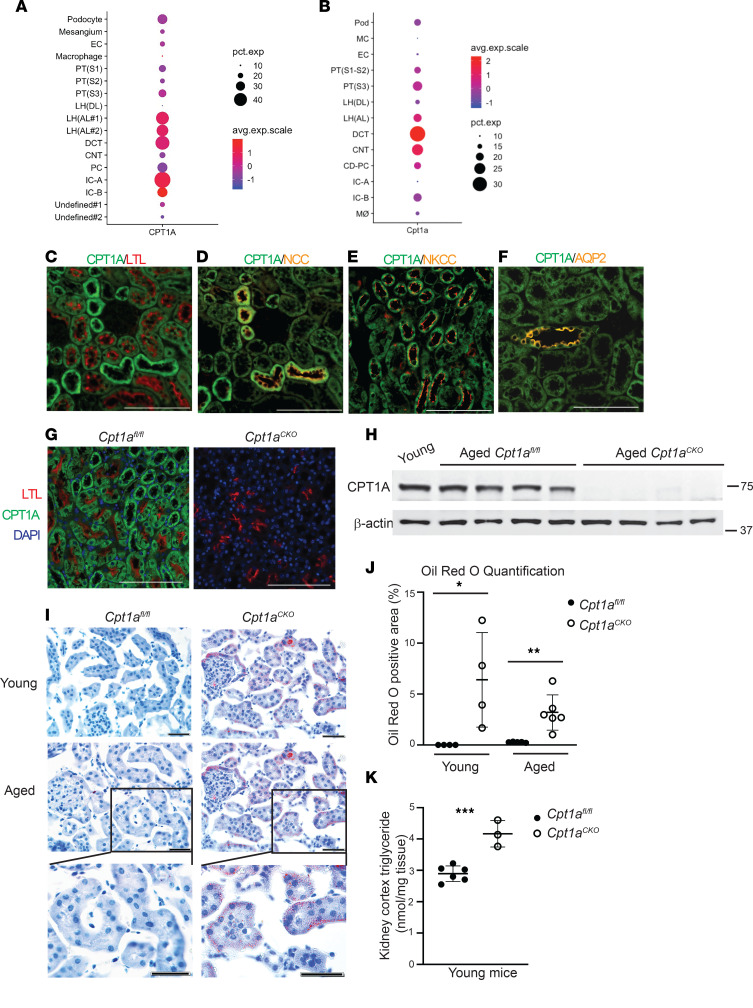
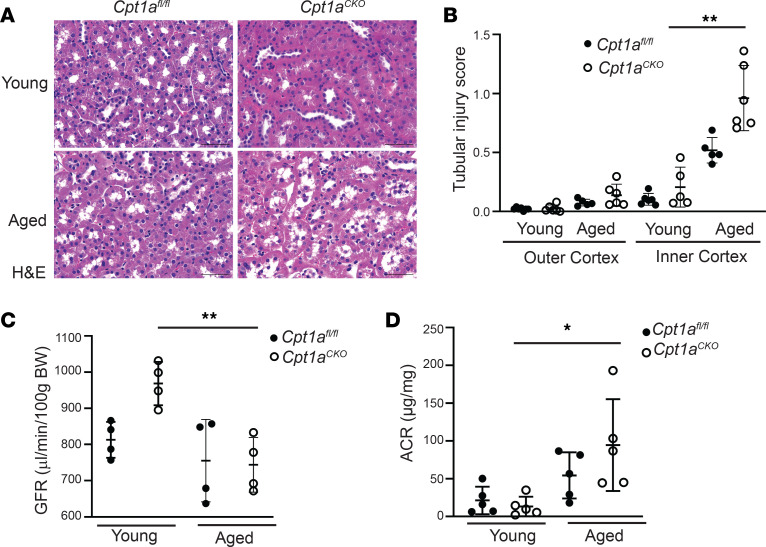
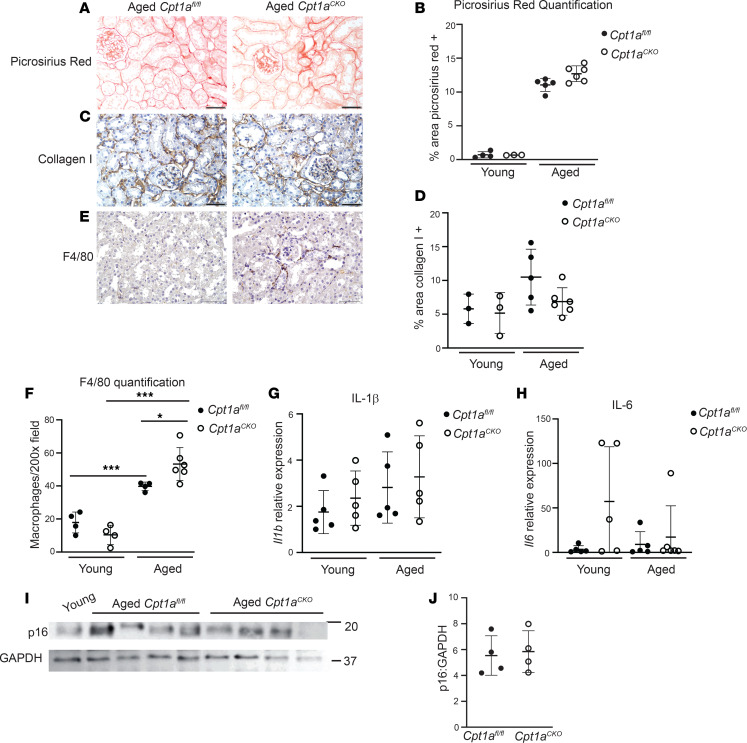
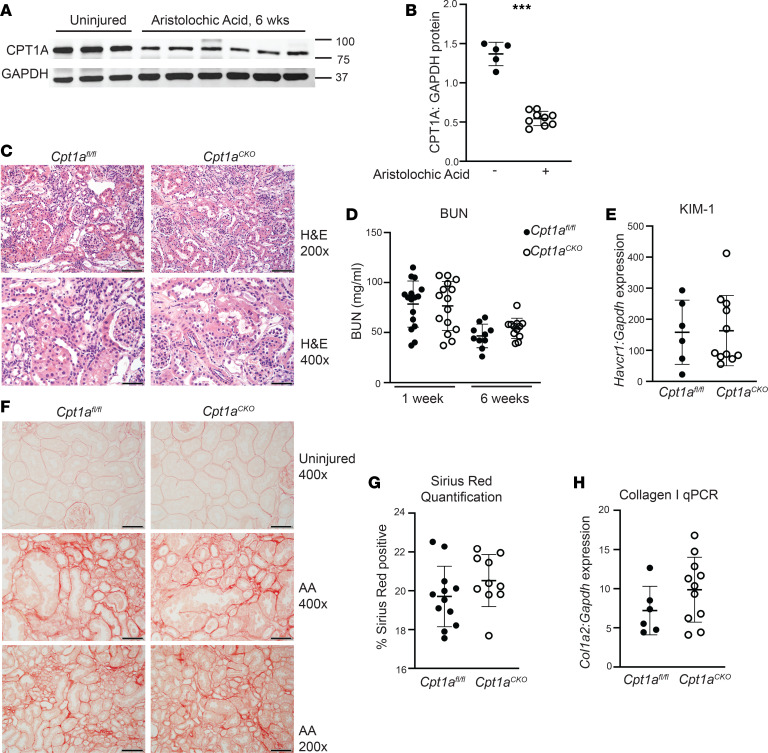
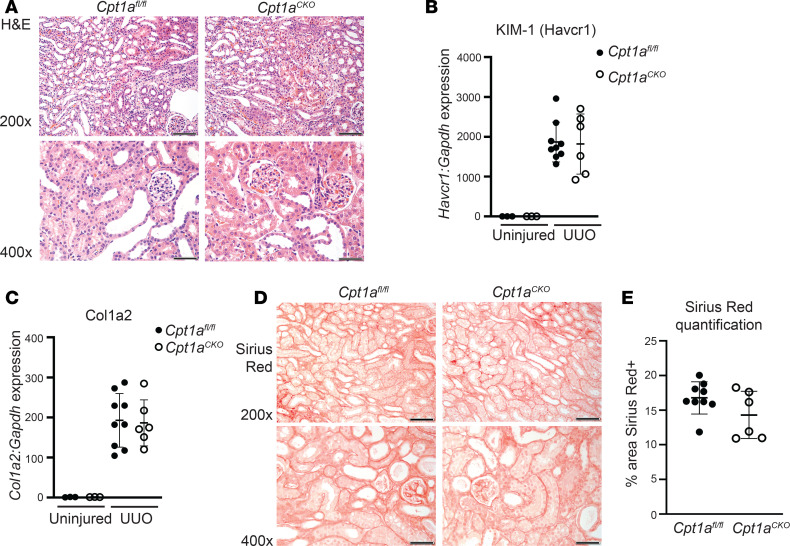
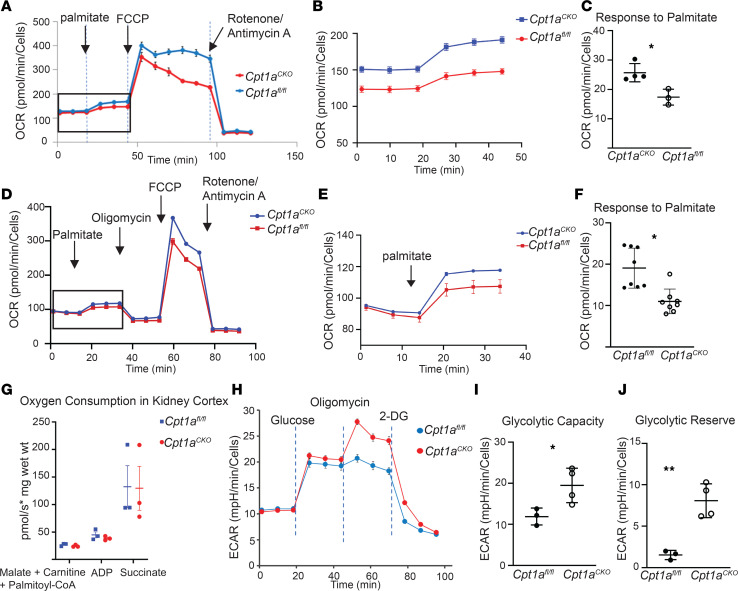
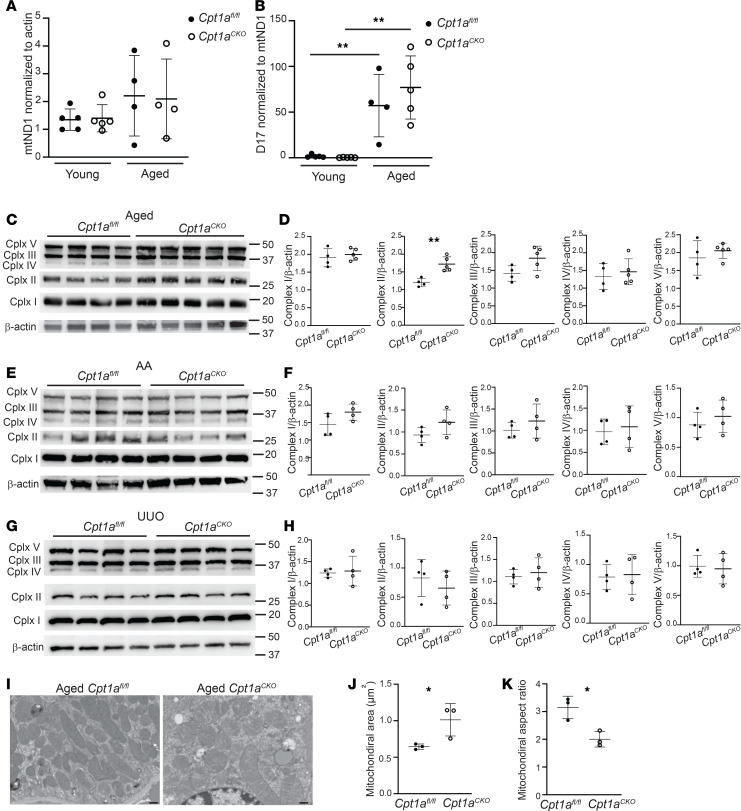
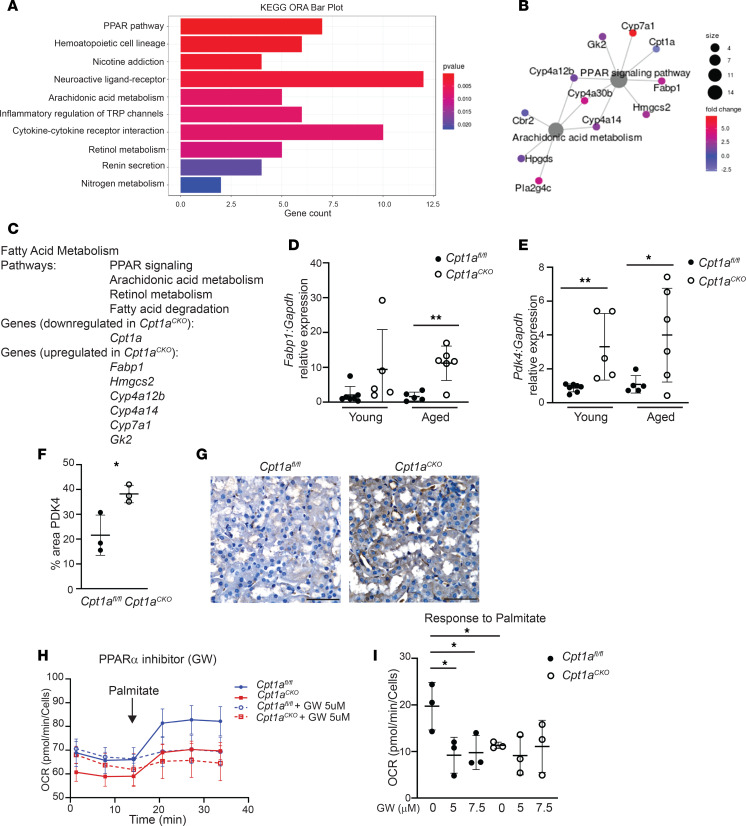
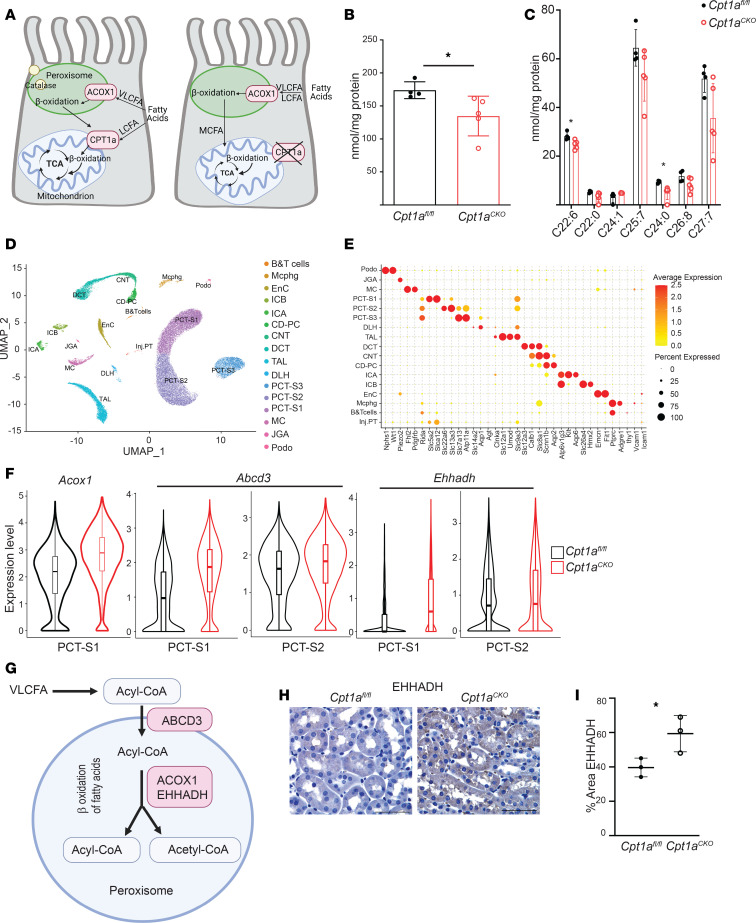
Kidney tubules use fatty acid oxidation (FAO) to support their high energetic requirements. Carnitine palmitoyltransferase 1A (CPT1A) is the rate-limiting enzyme for FAO, and it is necessary to transport long-chain fatty acids into mitochondria. To define the role of tubular CPT1A in aging and injury, we generated mice with tubule-specific deletion of Cpt1a (Cpt1aCKO mice), and the mice were either aged for 2 years or injured by aristolochic acid or unilateral ureteral obstruction. Surprisingly, Cpt1aCKO mice had no significant differences in kidney function or fibrosis compared with wild-type mice after aging or chronic injury. Primary tubule cells from aged Cpt1aCKO mice had a modest decrease in palmitate oxidation but retained the ability to metabolize long-chain fatty acids. Very-long-chain fatty acids, exclusively oxidized by peroxisomes, were reduced in kidneys lacking tubular CPT1A, consistent with increased peroxisomal activity. Single-nuclear RNA-Seq showed significantly increased expression of peroxisomal FAO enzymes in proximal tubules of mice lacking tubular CPT1A. These data suggest that peroxisomal FAO may compensate in the absence of CPT1A, and future genetic studies are needed to confirm the role of peroxisomal β-oxidation when mitochondrial FAO is impaired.

Keywords: Chronic kidney disease; Fatty acid oxidation; Metabolism; Nephrology.


Figures

Figure 1
Figure 1. Cpt1aCKO mice have robust recombination and increased lipid accumulation.
Single-cell transcriptomics data from Kidney Interactive Transcriptomics (https://humphreyslab.com/SingleCell/) shows gene expression of CPT1A (A) and Cpt1a (B) in normal human and murine kidneys, respectively. (C) CPT1A protein expression in young murine kidneys colocalizes with proximal tubules (LTL). Strongly CPT1A+ and LTL tubules stained for Na/Cl cotransporter (NCC), consistent with high CPT1A expression in the distal convoluted tubule (D). There was also colocalization of CPT1A with the thick ascending limb as marked by Na/K/Cl cotransporter (NKCC) and collecting ducts as shown by aquaporin 2 (AQP2) (E and F). CPT1A protein expression was efficiently blocked in Cpt1aCKO mice shown by IF in young mice (G) and cortical tissue immunoblots from aged mice with β-actin as loading control (n = 4) (H). Representative frozen sections, with Oil Red O staining lipid droplets in red, with quantification of percentage of positive area (n = 4–6) (I and J). Triglyceride content within kidneys, with each dot representing a different kidney (n = 3–6) (K). Results are shown as the mean ± SD. *P < 0.05, **P < 0.01, ***P < 0.001. Unpaired t test between the 2 genotypes was used to detect statistical significance. Scale bar: 100 μM (CG); 50 μM (I).
Figure 2
Figure 2. Deletion of tubular Cpt1a does not markedly impair kidney function in aging.
Representative H&E staining of young and aged Cpt1aCKO and floxed mice with quantification of tubular injury (see Methods) in the outer and inner cortex (n = 5–6) (A and B). Transdermal glomerular filtration rate (tGFR) measured by FITC-sinistrin (n = 4) (C) and urinary albumin-to-creatinine ratio (ACR) (n = 5) (D) of young and old mice by genotype. Results are shown as the mean ± SD. *P < 0.05, **P < 0.01. Unpaired t test between the 2 genotypes was used to detect statistical significance between the 2 genotypes. For multiple comparisons in C and D, 1-way ANOVA was performed followed by Šidák’s multiple comparisons test. Scale bar: 50 μM.
Figure 3
Figure 3. Aged Cpt1aCKO mice have increased inflammation but not increased fibrosis.
No differences in fibrosis between aged Cpt1aCKO mice and floxed controls were observed by Picrosirius red staining (A) and quantification (n = 3–5) (B) or collagen I staining (C) and quantification (n = 3–6) (D). Aged Cpt1aCKO mice had increased macrophages, measured by immunohistochemistry for F4/80, shown in brown and quantified (n = 4–6) (E and F). Gene expression of IL-1β (Il1b, n = 5) and IL-6 (Il6, n = 5) in renal cortices are quantified by qPCR and normalized to Gapdh (G and H). Renal cortices were immunoblotted for p16 and GAPDH (loading control) and quantified (n = 4) using ImageJ (I and J). The use of GAPDH as loading control was validated against β-actin in Supplemental Figure 4. Data are shown as the mean ± SD. *P < 0.05, ***P < 0.001. One-way ANOVA was performed followed by Šidák’s multiple comparisons test for F, and unpaired t test between the 2 genotypes was used to measure significance in B, G, H, and J. Scale bar: 50 μM.
Figure 4
Figure 4. Tubular injury and fibrosis are not increased in Cpt1aCKO mice after aristolochic acid nephropathy.
Immunoblots of renal cortices from uninjured and injured (aristolochic acid nephropathy [AAN]) mice detecting CPT1A expression (values are shown in kDa) (A), which was quantified with GAPDH as loading control (n = 5–9) (B). (C) H&E images of AAN-injured mice, with blood urea nitrogen (BUN) at both 1 and 6 weeks (n = 10–15) after aristolochic acid injections (D). Gene expression for KIM-1 (Havcr1, n = 6–10) measured in kidney tissue with qPCR and normalized to Gapdh (E). Picrosirius red staining and quantification (n = 10–12) (F and G) in injured kidneys and Col1a2 (collagen I, n = 6–12) gene expression by qPCR in AAN-injured cortices (H). Data are shown as the mean ± SD.***P < 0.001. Unpaired t test between the 2 genotypes was used to detect statistical significance. Scale bar: 50 μM (C, bottom, and F, top and middle); 100 μM (C, top, and F, bottom). Original magnification, ×200 (C, top, and F, bottom); ×400 (C, bottom, and F, top and middle).
Figure 5
Figure 5. Deleting tubular Cpt1a does not alter fibrosis after UUO.
H&E following 7 days of unilateral ureteral obstruction (UUO) (A). KIM-1 (Havcr1, n = 6–9) gene expression by qPCR of injured and uninjured tissue (B). Collagen I (Col1a2) gene expression (C) and Picrosirius red staining with quantification (n = 6–9) (D and E) after UUO injury. Data are shown as the mean ± SD. Scale bar: 50 μM (bottom rows); 100 μM (top rows). Original magnification: ×400 (bottom rows); ×200 (top rows).
Figure 6
Figure 6. Primary proximal tubule–enriched cells lacking Cpt1a have altered metabolism but are still able to metabolize LCFA.
Representative data from Seahorse analysis show oxygen consumption rate (OCR) after treatment with palmitate, FCCP, and antimycin A/rotenone in primary proximal tubule–enriched cells (PT cells) from aged mice (A). An expanded view (boxed area in A) of the OCR response to palmitate is shown (B). Average OCR responses to palmitate from Cpt1afl/fl (n = 4) and Cpt1aCKO (n = 3) mice are quantified (C). Representative tracing from PT cells isolated from young mice showing OCR after palmitate, oligomycin, FCCP, and antimycin A/rotenone (D) with an expanded view of the response to palmitate (E) and quantification of this palmitate response with n = 8 per genotype (F). Kidney tissues from young Cpt1afl/fl and Cpt1aCKO mice were used to measure oxygen consumption in response to palmitoyl-CoA, a LCFA (G). Each dot represents a separate kidney (n = 3), and oxygen consumption is measured as picomole per second per mg of kidney (wet weight). Representative data from a glycolysis test measuring extracellular acidification rate (ECAR) are shown (H). Oligomycin is used to detect maximal glycolytic capacity, and 2-DG blocks glycolytic acidification to define the glucose-dependent ECAR (I). Glycolytic capacity of primary PT cells from young and old mice (each dot represents a separate mouse n = 3–4) and glycolytic reserve (the ECAR value after oligomycin minus that after the addition of glucose) are shown (J). Results are shown as the mean ± SD. *P < 0.05, **P < 0.01. Unpaired t test between the 2 genotypes was used to detect statistical significance. FCCP, carbonyl cyanide-4 (trifluoromethoxy) phenylhydrazone; 2-DG, 2-deoxy-glucose; LCFA, long-chain fatty acid.
Figure 7
Figure 7. Assessment of Cpt1a tubular deletion on mitochondria.
Mitochondrial DNA copy number was measured using mitochondrial-encoded ND1 gene expression and normalized to nuclear-encoded actin (n = 4–5) (A). The common mitochondrial mutation, D17, was measured using qPCR and normalized to mitochondrial ND1 expression (n = 4–5) (B). Mitochondrial complexes were measured and quantified using immunoblots on cortical kidney tissue using ImageJ from aged (C and D), aristolochic acid–treated (AA-treated) (E and F), and UUO-injured mice (n = 4–5) (G and H). Representative electron micrograph images are shown (I) from aged mice, with quantification of area and aspect ratio (J and K) (see Methods). Each dot represents an average value for 1 mouse (n = 3). Results are shown as the mean ± SD. *P < 0.05; **P < 0.01. Unpaired t test between the 2 genotypes was used to detect statistical significance, except for A and B, where 1-way ANOVA was performed, followed by Šidák’s multiple comparisons. Scale bar: 500 nM.
Figure 8
Figure 8. RNA-Seq showing Cpt1aCKO kidneys with upregulated PPAR gene expression.
Bulk RNA-Seq on aged Cpt1afl/fl and Cpt1aCKO kidneys and gene ontology overrepresentation analysis (ORA) were performed using enrichGO from clusterProfiler. Gene networks and pathways significantly altered between genotypes are shown (A and B), with the pathways and genes specifically related to fatty acid metabolism listed (C). Significant changes in Fabp1, a known transcriptional target of PPARα, expression, that were identified by RNA-Seq were confirmed with qPCR (n = 5–6) (D). Pdk4, another target involved in glycolysis, was significantly upregulated in aged Cpt1aCKO murine kidneys in RNA-Seq (E) and confirmed by qPCR (n = 5–6) and protein expression (n = 3) (F and G). Scale bar: 50 μm. Primary PT cells with or without PPARα inhibitor (GW6371) had OCR responses to palmitate measured by Seahorse with a representative tracing shown (H) and quantified (I). Data are shown as the mean ± SD. *P < 0.05, **P < 0.01. Statistical significance between the 2 genotypes was determined by unpaired t test for DF. One-way ANOVA was performed followed by Šidák’s multiple comparisons test for H.
Figure 9
Figure 9. Peroxisomes likely compensate to metabolize LCFA in absence of CPT1A.
CPT1A and ACOX1 regulate β-oxidation of LCFA and VLFCA, respectively, in mitochondria and peroxisomes. Schematic of how peroxisomes may compensate to metabolize LCFA through ACOX1 in the absence of CPT1A (A). (B) Total levels of VLCFA (≥22 carbons) and individual VLCFA (C) were analyzed using mass spectroscopy in kidney tissue from Cpt1aCKO mice and floxed controls (n = 4–5). Data are shown as the mean ± SD. *P < 0.05. Statistical significance between the 2 genotypes was determined by unpaired t test. UMAP projection of cell types derived from single-nucleus RNA-Seq of cortical kidney tissues isolated from 3-month-old Cpt1afl/fl (n = 2) and Cpt1aCKO (n = 3) mice (D). A dot plot exhibiting expression levels of known, cell-type-specific marker genes and the percentage of cells in each cluster expressing cell-type-specific marker genes (E). Violin plots of peroxisomal genes significantly upregulated in segments of the proximal tubule with adjusted P values (*P < 0.01, **P < 1 × 10⁻¹⁰, ***P < 1 × 10–20; see Table 1 for specific P values and fold changes) (F). ABCD3 is a key transporter for importing VLCFA and LCFA into peroxisomes, and ACOX1 and EHHADH are enzymes involved in the first and second steps of peroxisomal FAO, respectively (G). Immunohistochemistry of EHHADH (H) and quantification (I) of young murine kidneys from Cpt1afl/fl and Cpt1aCKO mice. Scale bar: 50 μm. VLCFA, very long-chain fatty acid; LCFA, long-chain fatty acid; ACOX1, acyl-CoA oxidase 1; TCA, tricarboxylic acid; PCT-S1, proximal tubule, segment S1; PCT-S2, proximal tubule, segment S2; EHHADH, enoyl-CoA hydratase and 3-hydroxyacyl CoA dehydrogenase.

References

    1. Kang HM, et al. Defective fatty acid oxidation in renal tubular epithelial cells has a key role in kidney fibrosis development. Nat Med. 2015;21(1):37–46. doi: 10.1038/nm.3762. - DOI - PMC - PubMed
    1. Idrovo JP, et al. Stimulation of carnitine palmitoyltransferase 1 improves renal function and attenuates tissue damage after ischemia/reperfusion. J Surg Res. 2012;177(1):157–164. doi: 10.1016/j.jss.2012.05.053. - DOI - PMC - PubMed
    1. Miguel V, et al. Renal tubule Cpt1a overexpression protects from kidney fibrosis by restoring mitochondrial homeostasis. J Clin Invest. 2021;131(5):140695. doi: 10.1172/JCI140695. - DOI - PMC - PubMed
    1. Gai Z, et al. Lipid accumulation and chronic kidney disease. Nutrients. 2019;11(4):722. doi: 10.3390/nu11040722. - DOI - PMC - PubMed
    1. Denic A, et al. Structural and functional changes with the aging kidney. Adv Chronic Kidney Dis. 2016;23(1):19–28. doi: 10.1053/j.ackd.2015.08.004. - DOI - PMC - PubMed

Publication types