. 2024 Feb 8;9(6):e171844.
doi: 10.1172/jci.insight.171844.

GNTI-122: an autologous antigen-specific engineered Treg cell therapy for type 1 diabetes

Affiliations

GNTI-122: an autologous antigen-specific engineered Treg cell therapy for type 1 diabetes

Gene I Uenishi et al. JCI Insight. .

Abstract

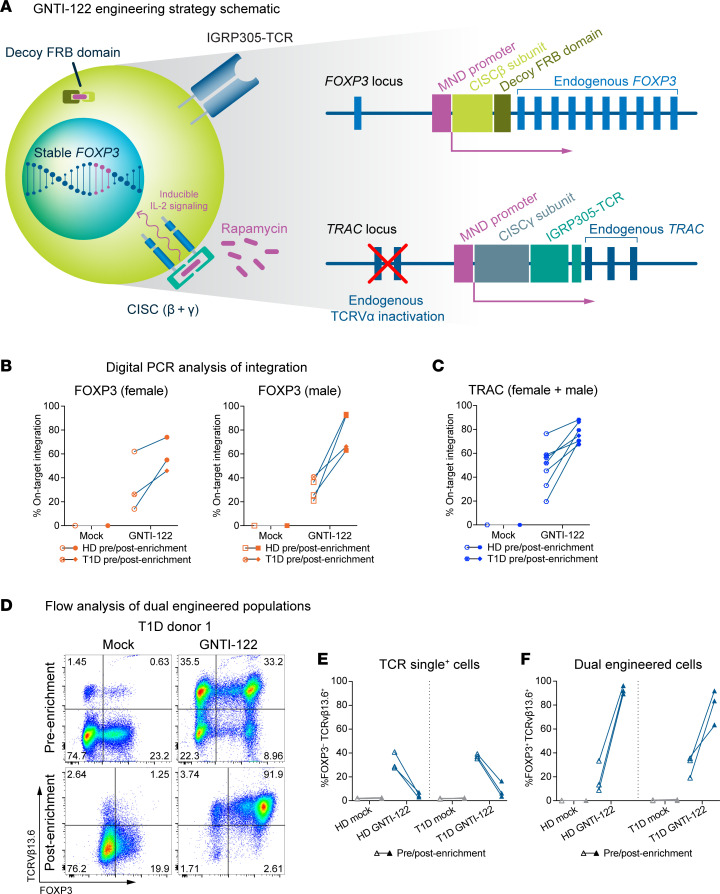
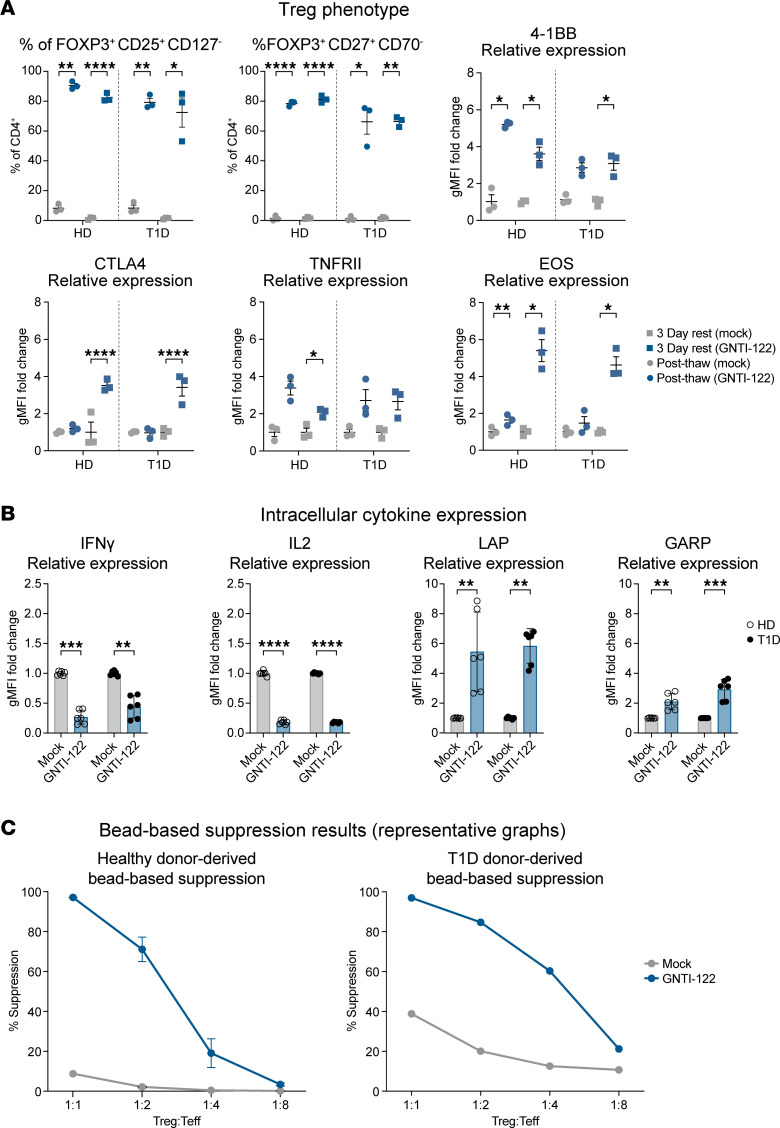
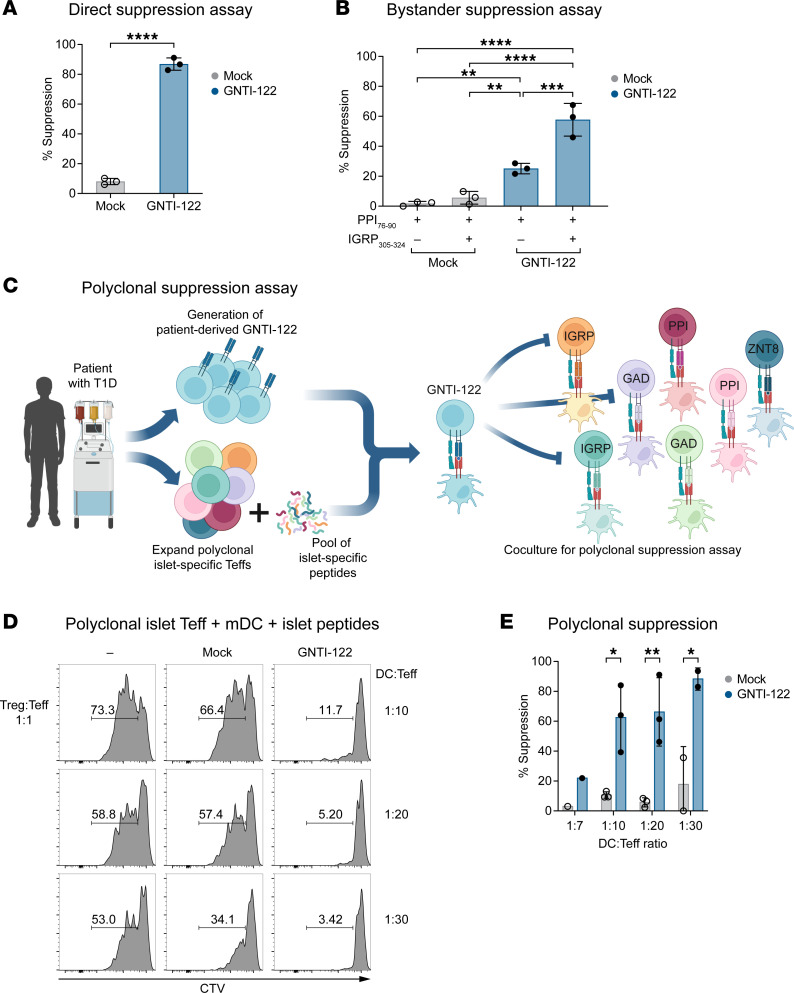
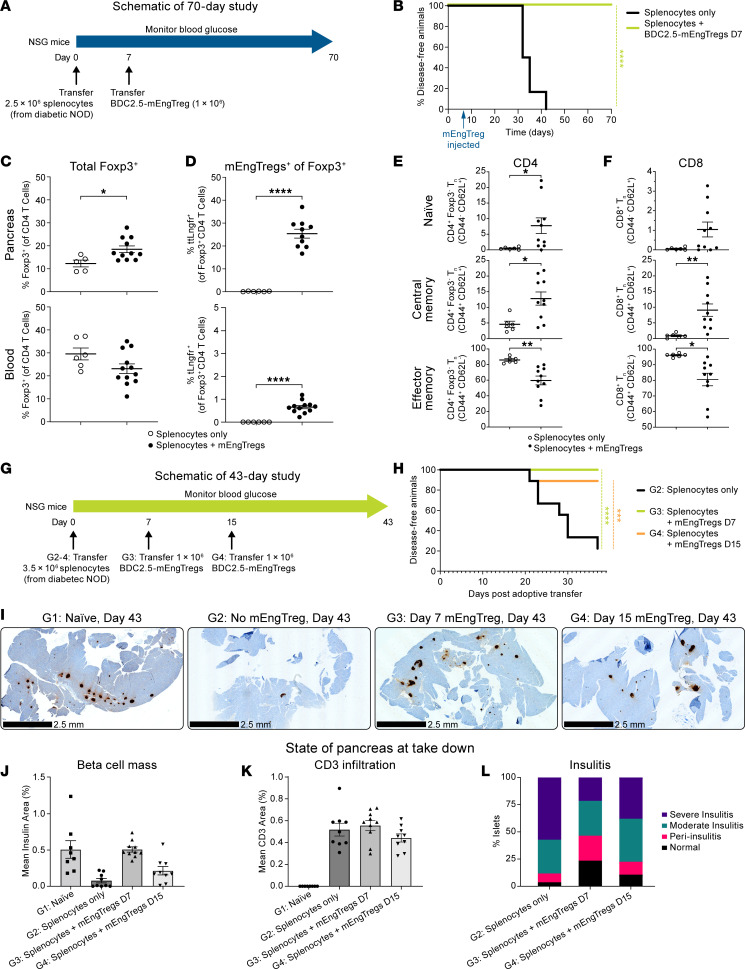
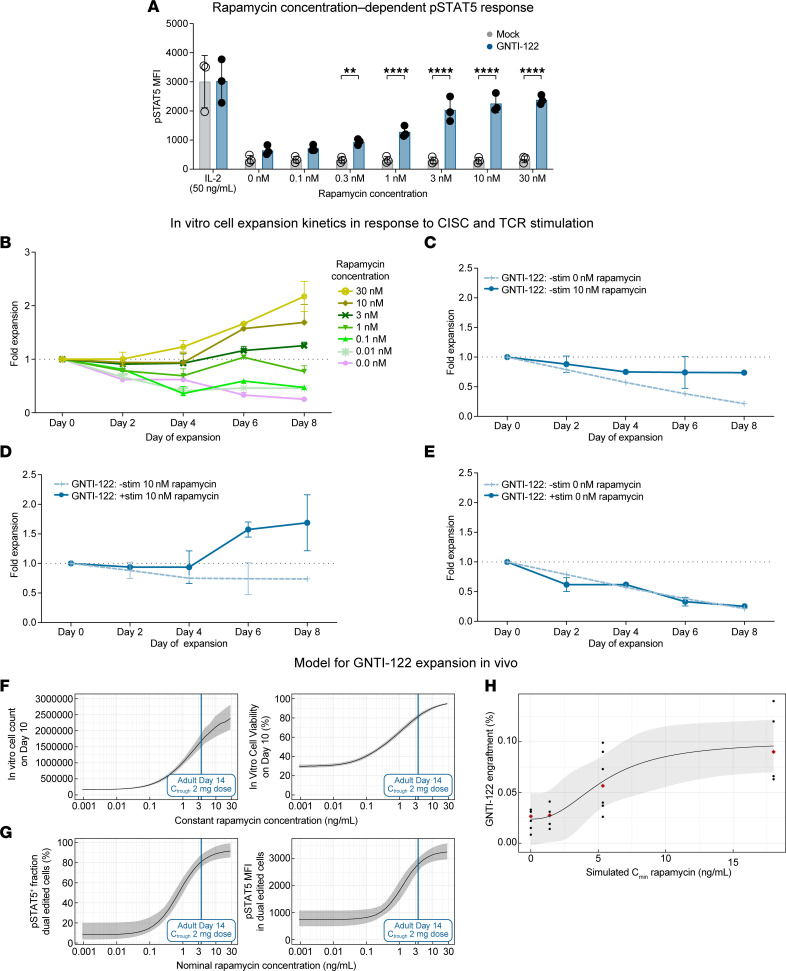
Tregs have the potential to establish long-term immune tolerance in patients recently diagnosed with type 1 diabetes (T1D) by preserving β cell function. Adoptive transfer of autologous thymic Tregs, although safe, exhibited limited efficacy in previous T1D clinical trials, likely reflecting a lack of tissue specificity, limited IL-2 signaling support, and in vivo plasticity of Tregs. Here, we report a cell engineering strategy using bulk CD4+ T cells to generate a Treg cell therapy (GNTI-122) that stably expresses FOXP3, targets the pancreas and draining lymph nodes, and incorporates a chemically inducible signaling complex (CISC). GNTI-122 cells maintained an expression profile consistent with Treg phenotype and function. Activation of CISC using rapamycin mediated concentration-dependent STAT5 phosphorylation and, in concert with T cell receptor engagement, promoted cell proliferation. In response to the cognate antigen, GNTI-122 exhibited direct and bystander suppression of polyclonal, islet-specific effector T cells from patients with T1D. In an adoptive transfer mouse model of T1D, a mouse engineered-Treg analog of GNTI-122 trafficked to the pancreas, decreased the severity of insulitis, and prevented progression to diabetes. Taken together, these findings demonstrate in vitro and in vivo activity and support further development of GNTI-122 as a potential treatment for T1D.

Keywords: Autoimmunity; Diabetes; Gene therapy; Therapeutics.


Figures

Figure 1
Figure 1. Genome engineering of GNTI-122 from CD4+ T cells.
(A) Resulting genome-engineered product of GNTI-122. Digital PCR results of transgene integration at the (B) FOXP3 and (C) TRAC loci of mock-engineered (Mock) and GNTI-122 cells from healthy donors (HDs) and patients with type 1 diabetes (T1D). (D) Representative FACS analysis of GNTI-122 and Mock cells generated from a patient with T1D, before enrichment to after enrichment with rapamycin (n = 3). Cells were stained 3 days after editing before enrichment to determine the initial TCRVb13.6+FOXP3+ editing frequency and at the time of cryopreservation after enrichment to determine purity. (E and F) Graphical representation of 3 independent batches of GNTI-122 cells and their corresponding Mock cells generated in parallel, from 3 HDs and 3 donors with T1D. Graphs represent the TCR single-positive population and dual-engineered populations. FRB, FKBP-rapamycin binding domain; MND, myeloproliferative sarcoma virus enhancer, negative control region deleted, dl587rev primer-binding site substituted; CISC, chemically inducible signaling complex.
Figure 2
Figure 2. Stable FOXP3 expression imparts Treg phenotype and function.
(A) Cells produced from 3 healthy donors (HDs) and 3 donors with type 1 diabetes (T1D) (total of 6 individual donors) were analyzed for flow cytometry immediately after thawing and after resting for 3 days. The percentages of each population (±SEM) are shown for GNTI-122 cells compared to mock-engineered (Mock) cells and are based on live CD4+ cells. The geometric MFI (gMFI) relative expression (mean ± SEM) for each marker is shown for the GNTI-122 cells compared to Mock cells. The MFI values for the Mock cells are based on CD4+, whereas the MFI values for the GNTI-122 cells are based on CD4+TCRVβ13.6+FOXP3+ (2-way ANOVA with Tukey’s multiple-comparison test). (B) Cells from 3 different HD and T1D donors were either stimulated with PMA/ionomycin/monensin for 5 hours and then stained (for intracellular IFN-γ and IL-2) or stimulated with anti-CD3/anti-CD28 activation beads for 24 hours and then stained (for surface LAP and GARP). Each cytokine was gated on either CD4+ for Mock cells or TCRVb13.6+FOXP3+ for GNTI-122 cells. Data presented as mean relative levels ± SD from duplicate measurements (2-way ANOVA with Šidák’s multiple-comparison test). (C) Representative bead-based suppression results from GNTI-122 cells generated from an individual HD and an individual donor with T1D (n = 3, mean ± SEM). *P < 0.05; **P < 0.01; ***P < 0.001; ****P < 0.0001. Teff, T effectors; PMA, phorbol 12-myristate 13-acetate; LAP, latency-associated protein; GARP, glycoprotein A repetitions predominant.
Figure 3
Figure 3. The expression of IGRP305-TCR imparts antigen-specific direct and bystander suppression of islet antigen–specific Teffs.
Graphs include 3 individual donors of GNTI-122. GNTI-122 cells were cocultured with autologous Teffs from patient donors with T1D, and monocyte-derived dendritic cells as antigen-presenting cells (APCs). (A) Teffs express the same TCR, and APCs were loaded with their cognate peptide IGRP305-324 (for Tregs) (unpaired, 2-tailed t test). (B) Teffs express a different TCR, and the APCs were loaded with corresponding cognate peptide PPI76–90 (for Teffs) and IGRP305–324 (for Tregs) (2-way ANOVA). (C) Schematic diagram (created in BioRender.com) of the patient with T1D-derived pancreatic islet peptide–specific Teff polyclonal suppression assay. (D) Representative flow plots and (E) graphical representation of 3 independent experiments of polyclonal suppression assay where Teffs specific for 9 different cognate peptides were isolated, and APCs were loaded with their cognate peptides, including IGRP305–324, to activate GNTI-122 (unpaired, 2-tailed t test); mean ± SEM,*P < 0.05; **P < 0.01; ***P < 0.001; ****P < 0.0001. Mock, mock engineered; EngTregs, engineered T regulatory cells; mDC, monocyte-derived dendritic cells; CTV, CellTrace Violet.
Figure 4
Figure 4. IGRP305-TCR is specific for its cognate peptide.
K562/DR4 cells were pulsed with 1 μg/mL of the indicated alanine mutant peptides (A) or pathogen-derived peptides (B) and cocultured with IGRP305-TCR or control TCR-transduced T cells at a 3:1 effector/target ratio. CD137 expression was measured after 20 hours. The mean of 2 to 3 technical replicates is shown. Error bars denote 1 SD.
Figure 5
Figure 5. Antigen-specific murine engineered Tregs protect against an adoptive transfer model of diabetes, increase Treg levels in the pancreas, and reduce pancreatic effector memory T cells.
(A) Experimental outline. (B) Kaplan-Meier curve displaying diabetes incidence in mice given only diabetogenic splenocytes (n = 6) or mice additionally given mTregs on day 7 (n = 12). Percentages of (C) Foxp3+ and (D) tLngfr+Foxp3+ cells in the pancreas and blood on day 70. Memory subsets within Foxp3CD4+ T cells (E) or CD8+ T cells (F) in the pancreas on day 70. (G) Experimental outline. (H) Kaplan-Meier curve displaying diabetes incidence in mice given only diabetogenic splenocytes on day 0 (n = 10) and mice additionally given mEngTregs on day 7 (n = 10) or on day 15 (n = 10). (I) Representative immunohistochemistry for insulin. Scale bars: 2.5 mm. (J) β Cell mass of pancreata on day 43. (K) Quantification of CD3+ cell infiltration in pancreata on day 43. (L) Severity scores for islet inflammation (H&E staining). Approximately 20 islets quantified per mouse. Data are presented as mean ± SEM. Statistical analysis was by log-rank (Cox-Mantel) test; *P < 0.05; ***P < 0.001; ****P < 0.0001 by log-rank (Cox-Mantel) test (B and H) or unpaired, 2-tailed t test (J and K).
Figure 6
Figure 6. CISC activation enables rapamycin-mediated IL-2–like signaling to control GNTI-122 proliferation and viability in the absence of IL-2.
(A) Rapamycin concentration–dependent phosphorylation of STAT5 by CISC activation. MFI of p-STAT5 was quantified at each concentration of rapamycin. Repeated-measures ANOVA with Šidák’s multiple-comparison tests at each dose. **P < 0.01, ****P < 0.0001. Data are presented as mean ± SEM (n = 3 donors). (BE) GNTI-122 cell expansion in vitro was measured over 10 days; data presented as mean ± SEM (n = 2) from representative donors. (B) Chemically inducible signaling complex (CISC) activation by 10 nM rapamycin improved cell survival in the absence of TCR signaling. (C) Both CISC activation (10 nM rapamycin) and TCR signaling were required for cell proliferation. (D) TCR stimulation alone, in the absence of CISC activation by 10 nM rapamycin, did not support cell survival. (E) Rapamycin exposure–dependent proliferation of GNTI-122 in the presence of TCR stimulation. Simulation of rapamycin concentration-response relationship of in vitro GNTI-122 cell (F) expansion and viability, and (G) CISC activation (p-STAT5 percentage positive cells and MFI) alongside predicted rapamycin trough exposures (Cmin) in adult subjects at the 2-mg rapamycin daily dose. Median and 90% CI were derived from 500 population mean parameters sampled from the uncertainty distribution of the parameter estimates. (H) Model of rapamycin exposure-response for GNTI-122 engraftment in NSG mice on day 19, shown as a function of rapamycin trough (Cmin) concentrations. Black dots indicate observed GNTI-122 engraftment. Red diamonds correspond to median engraftment per simulated rapamycin exposure. Black line and ribbon indicate the model fit and 68% prediction interval.
Figure 7
Figure 7. Simulation of rapamycin dosing in adult and pediatric patients to achieve rapamycin exposures predicted to support GNTI-122 engraftment.
Simulated whole-blood rapamycin concentrations representing rapamycin exposures over the course of 14-day daily treatment regimen (A) in a 35-year-old adult at 2 mg per day dose and (B) in a 6-year-old child at 1.5 mg/m2 per day dose. The solid line depicts the 3.6 ng/mL trough concentration predicted to promote GNTI-122 engraftment in patients.

References

    1. Maude SL, et al. Tisagenlecleucel in children and young adults with B-cell lymphoblastic leukemia. N Engl J Med. 2018;378(5):439–448. doi: 10.1056/NEJMoa1709866. - DOI - PMC - PubMed
    1. Schuster SJ, et al. Tisagenlecleucel in adult relapsed or refractory diffuse large B-cell lymphoma. N Engl J Med. 2019;380(1):45–56. doi: 10.1056/NEJMoa1804980. - DOI - PubMed
    1. Abramson JS, et al. Lisocabtagene maraleucel for patients with relapsed or refractory large B-cell lymphomas (TRANSCEND NHL 001): a multicentre seamless design study. Lancet. 2020;396(10254):839–852. doi: 10.1016/S0140-6736(20)31366-0. - DOI - PubMed
    1. Berdeja JG, et al. Ciltacabtagene autoleucel, a B-cell maturation antigen-directed chimeric antigen receptor T-cell therapy in patients with relapsed or refractory multiple myeloma (CARTITUDE-1): a phase 1b/2 open-label study. Lancet. 2021;398(10297):314–324. doi: 10.1016/S0140-6736(21)00933-8. - DOI - PubMed
    1. Duca LM, et al. Diabetic ketoacidosis at diagnosis of type 1 diabetes predicts poor long-term glycemic control. Diabetes Care. 2017;40(9):1249–1255. doi: 10.2337/dc17-0558. - DOI - PubMed

Publication types