. 2024 May 6;221(5):e20221190.
doi: 10.1084/jem.20221190. Epub 2024 Mar 22.

A TBK1 variant causes autophagolysosomal and motoneuron pathology without neuroinflammation in mice

Affiliations

A TBK1 variant causes autophagolysosomal and motoneuron pathology without neuroinflammation in mice

David Brenner et al. J Exp Med. .

Abstract

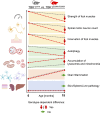
Heterozygous mutations in the TBK1 gene can cause amyotrophic lateral sclerosis (ALS) and frontotemporal dementia (FTD). The majority of TBK1-ALS/FTD patients carry deleterious loss-of-expression mutations, and it is still unclear which TBK1 function leads to neurodegeneration. We investigated the impact of the pathogenic TBK1 missense variant p.E696K, which does not abolish protein expression, but leads to a selective loss of TBK1 binding to the autophagy adaptor protein and TBK1 substrate optineurin. Using organelle-specific proteomics, we found that in a knock-in mouse model and human iPSC-derived motor neurons, the p.E696K mutation causes presymptomatic onset of autophagolysosomal dysfunction in neurons precipitating the accumulation of damaged lysosomes. This is followed by a progressive, age-dependent motor neuron disease. Contrary to the phenotype of mice with full Tbk1 knock-out, RIPK/TNF-α-dependent hepatic, neuronal necroptosis, and overt autoinflammation were not detected. Our in vivo results indicate autophagolysosomal dysfunction as a trigger for neurodegeneration and a promising therapeutic target in TBK1-ALS/FTD.


Conflict of interest statement

Disclosures: The authors declare no competing interests exist.

Figures
None
Graphical abstract
Figure 1.
Figure 1.
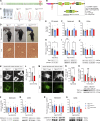
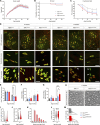
Characterization of the TBK1E696K variant. (A) Scheme of LuTHy-BRET assay to investigate binding of wt TBK1 and TBK1E696K to optineurin (OPTN) or the TRAF family member–associated NF-κB activator (TANK) in live HEK293 cells. (B and C) Binding of wt TBK1- and TBK1E696K-mCitrine-Protein A (-mCit-PA) to NanoLuc (NL)-tagged optineurin (B) or TANK (C) in LuTHy-BRET donor saturation assays. (D) Quantification of cBRET signals from TBK1 binding assays. PA-mCit-NL tandem construct shown as positive and cotransfection of single NL- and PA-mCit-tags as negative BRET controls. Relative BRET ratios were obtained by normalizing the BRET signal of optineurin or TANK with each TBK1 mutant to the interaction signals with wt TBK1, respectively. Mean ± SEM of n = 4 technical replicates per condition from three independent experiments; one-way ANOVA with Sidak’s post hoc test; **P < 0.01. (E) Comparison of wt TBK1- and TBK1E696K-mCit-PA fusion protein expression as measured from fluorescence intensities. Mean ± SEM of n = 7 technical replicates per condition from three independent experiments; Student’s t test. (F) Western blot showing expression of the TBK1 mutants in HEK293 cells after transfection. Source data are available for this figure: SourceData F1.
Figure 2.
Figure 2.
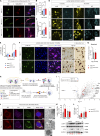
Generation and characterization of TBK1E696K knock-in mice. (A) Conservation of p.E696 in TBK1 between mouse and human. (B) Scheme showing the generation of mice with constitutive global knock-in of the TBK1E696K variant using the Cre/Lox system and a “mini-gene” approach. (C) PCR and sequencing of the wt and mutant bands of ear tissue from TBK1E696K knock-in and wt siblings. (D) Representative photomicrographs of 19-mo-old male mice and light microscopic images of HE-stained livers show no morphological differences between the three genotypes. Scale bar: 100 µm. (E–G) Quantification of Tbk1 RNA expression by qPCR in mouse primary cortical (PC) neurons, spinal cord, and cortex tissue. Mean ± SEM of n = 6 embryos of mixed sex per genotype form more than three independent experiments; one-way ANOVA with Tukey’s post hoc test in E. Mean ± SEM of n = 4–8 male mice per genotype; two-way ANOVA with Tukey’s post hoc test in F and G. (H–J) Western blot analysis of lysates of primary cortical neurons, spinal cord, and cortex tissue stained against TBK1 and GAPDH. Mean ± SEM of a pool of n = 9–10 embryos of mixed sex per genotype from more than three independent experiments; one-way ANOVA with Tukey’s post hoc test; *P < 0.05 in H. Mean ± SEM of n = 5–8 male mice per genotype from two independent experiments; two-way ANOVA with Tukey’s post hoc test in I and J; *P < 0.05; ***P < 0.001. The right GAPDH column from I is reused in Fig. S3, A and F. (K) Representative photomicrographs of LSC motor neurons of 17-mo-old TBK1E696K knock-in and wt mice stained against Nissl and TBK1. Scale bar: 10 µm. (L) Quantification of the MFI of TBK1 fluorescence shows reduced expression in motor neurons of TBK1E696K/E696K knock-in mice. Mean ± SEM of pool of n > 19 motor neurons from n = 5–6 male mice per genotype from two independent experiments; Student’s t test; ****P < 0.0001. (M) Representative photomicrographs of D20 hiPSC-derived motor neurons stained against ChAT and TBK1. Scale bar: 10 µm. (N) Quantification of MFI of TBK1 fluorescence shows reduced expression of TBK1 in TBK1E696K/E696K mutant hiPSC-derived motor neurons. Mean ± SEM of pool of n > 35 motor neurons per genotype from two independent experiments; Mann–Whitney test; ****P < 0.0001. (O) Western blot analysis of HEK293 cells overexpressing myc-tagged wt TBK1 and TBK1E696K after treatment with CHX. Mean ± SEM of n = 4 biological replicates from four independent experiments two-way ANOVA with post hoc Šídák’s multiple comparisons test; ***P < 0.001. (P and Q) Western blot analysis of lysates of spinal cord and cortex tissue stained against optineurin and GAPDH. Mean ± SEM of n = 6–8 male mice per genotype from two independent experiments; two-way ANOVA with Tukey’s post hoc test. (R and S) Western blot analysis of lysates of spinal cord and cortex tissue stained against phospho-optineurin and GAPDH. Mean ± SEM of n = 4–6 male mice per genotype from two independent experiments; two-way ANOVA with Tukey’s post hoc test. Source data are available for this figure: SourceData FS2.
Figure S1.
Figure S1.
Analysis of skin morphology, liver and spleen weight, and microglia count, morphology, and activation in the lumbar spinal cord and motor cortex from TBK1E696K knock-in and wt siblings. (A) Representative light microscopic images of HE-stained skin tissue of 19-mo-old mice. Scale bar: 100 µm. (B) Quantification of dermal cellular density between 19-mo-old TBK1E696K knock-in mice and wt siblings. Mean ± SEM of n = 4 male mice per genotype; one-way ANOVA with Tukey’s post hoc test. (C and D) Comparison of liver (C) and spleen (D) weights between 19-mo-old TBK1E696K knock-in mice and wt siblings. Mean ± SEM of n = 13–15 male mice per genotype; one-way ANOVA with Tukey’s post hoc test. (E) Representative photomicrographs of LSC and motor cortex slices from 6- and 19-mo-old TBK1E696K knock-in and wt mice stained against the microglial markers IBA1 and PU-1. Scale bars: 100 µm, 50 µm, 25 µm. (F–K) Analysis of abundances and mean and maximal sizes of microglia in LSC and motor cortex. Mean ± SEM of n = 6–8 male mice per genotype from two independent experiments; two-way ANOVA with post hoc Tukey’s multiple comparisons test; *P < 0.05. (L) Representative microscopic images of LSC anterior slices of 19-mo-old mice stained against IBA1 and TNF-α. Scale bar: 50 µm. (M) Quantification of the MFI of TNF-α in IBA1+ microglia. Mean ± SEM of n = 5 male mice per genotype from two independent experiments; Student’s t test. (N) Quantification of the abundance of IBA+/CLEC7A+ microglia from E. Mean ± SEM of n = 5–7 male mice per genotype from two independent experiments; one-way ANOVA with Tukey’s post hoc test. (O) qPCR of RNA transcripts of cultured primary microglia. Mean ± SEM of n = 8 pups of mixed sex from more than three independent experiments; two-way ANOVA with post hoc Tukey’s multiple comparisons test; *P < 0.05; **P < 0.01.
Figure S2.
Figure S2.
Analysis of astrocyte count and morphology in the lumbar spinal cord and motor cortex as well as proteomic analysis of glial markers in the lumbar spinal cord from TBK1E696K knock-in and wt siblings. (A) Representative photomicrographs of LSC and motor cortex slices from 6- and 19-mo-old TBK1E696K knock-in and wt mice stained against the astrocytic markers GFAP and SOX9. Scale bars: 100 µm, 50 µm, 25 µm. (B–F) Quantification of the abundances, mean and maximal sizes of astrocytic cells in the spinal cord, and the gray and white matter of the motor cortex. Mean ± SEM of n = 3–8 male mice per genotype from two independent experiments; two-way ANOVA with post hoc Tukey’s multiple comparisons test; *P < 0.05 in B. (G and H) Principal component and heatmap hierarchical clustering analysis of glial proteins in LSC lysates from 19-mo-old mice does not show separation of the three genotypes. N = 4 male mice per genotype. (I) Expression of selected glial markers in LSC at 19 mo. Mean ± SEM of n = 6 male mice per genotype; two-way ANOVA with post hoc Tukey’s multiple comparisons test.
Figure S3.
Figure S3.
Analysis of necroptosis, autophagy, and axon pathology as well as behavioral testing of TBK1E696K mutant and wt mice, MEFs, and primary neurons. (A and B) Western blot analysis of LSC and cortex lysates from 6 to 19 mo old TBK1E696K knock-in and wt mice stained against RIPK1. Mean ± SEM of n = 6 male mice per genotype from two independent experiments; two-way ANOVA with post hoc Tukey’s multiple comparisons test; *P < 0.05 in A. (C and D) Western blot analysis of LSC lysates from 6-mo-old TBK1E696K knock-in and wt mice stained against pRIPK1 and TAK1. Mean ± SEM of n = 5–6 male mice per genotype from two independent experiments; Student’s t test. (E) Representative microscopic images of LSC anterior slices of 19-mo-old male mice stained against pRIPK1 (DAB) and TAK1 (IF). Scale bars: 50 µm, 25 µm (insets). (F and G) Western blot analysis of LSC and cortex lysates from 6- and 19-mo-old TBK1E696K knock-in and wt mice stained against MLKL. Mean ± SEM of n = 6 male mice per genotype from two independent experiments; one-way ANOVA with Tukey’s multiple comparisons test in E; two-way ANOVA with post hoc Tukey’s multiple comparisons test in F. A (right column) and F use the same GAPDH blots used in Fig. 2 I (right column). B (left column) and G (left column) use the same GAPDH blots. B (right column) and G (right column) use the same GAPDH blots. (H) Inverted grid test in 18-mo-old female mice. Each time point represents mean ± SEM of n = 8–17 female mice per genotype; one-way ANOVA with Tukey’s post hoc test. (I) Scheme of three chamber social test. (J–O) Analysis of three chamber social test, open field test, Y-maze test, and tube dominance test. Each time point represents mean ± SEM of n = 13–15 male mice per genotype; mixed-effects analysis with post hoc Tukey’s multiple comparisons test; *P < 0.05; **P < 0.01. (P) Representative photomicrographs of hetero- and homozygous TBK1E696K knock-in and wt E15 primary cortical neurons 14 days in culture and stained against TUJ-1. (Q) Homozygous TBK1E696K knock-in primary cortical neurons show shortened axon lengths compared with the other genotypes. Mean ± SEM of pool of >160 motor neurons per genotype from n = 5–6 embryos of mixed sex from two independent experiments; Kruskal–Wallis test followed by Dunn’s multiple comparisons post hoc test; ***P < 0.001; ****P < 0.0001. (R) LSC section of a 19-mo-old TBK1E696K knock-in mouse stained against Nissl, p62, and GABARAPL1 shows colocalization of both autophagy markers. Scale bar: 25 µm. (S) Volcano plot visualizing autophagosome content profiling in TBK1E696K/E696K knock-in MEFs compared to wt. N = 4 technical replicates per condition from two independent experiments; multiple Student’s t tests without FDR correction; red/blue colors indicate significantly enriched proteins (uncorrected P < 0.05). (T and U) Analysis of abundance and maximal size of p62+ punctae in lumbar spinal motor neurons in 6- and 19-mo-old mice. Mean ± SEM of pool of n > 30 motor neurons from n = 4 male mice per genotype from two independent experiments; Mann–Whitney test; *P < 0.05; ***P < 0.001. Source data are available for this figure: SourceData FS3.
Figure 3.
Figure 3.
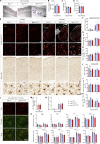
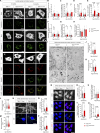
Homozygous TBK1E696K knock-in causes progressive motor neuron disease-like symptoms, muscle denervation, and spinal motor neuron loss in mice. (A) TBK1E696K knock-in and wt mice show similar weight kinetics. Each time point represents mean ± SEM of n = 13–15 male mice per genotype; mixed-effects analysis with post hoc Tukey’s multiple comparisons test. (B) Lifespan during the study period of 19 mo does not differ among the three genotypes. Each time point represents mean ± SEM of n = 13–15 male mice per genotype; log-rank (Mantel–Cox) test. (C) Compared to wt siblings, homozygous TBK1E696K knock-in mice (TBK1E696K/E696K) show a progressively reduced latency to fall in the inverted grid test starting at the age of 9 mo. Each time point represents mean ± SEM of n = 13–15 male mice per genotype; mixed-effects analysis with post hoc Tukey’s multiple comparisons test; *P < 0.05; **P < 0.01. (D) Representative photomicrographs of proximal and distal muscles and lumbar anterior horns of 6- and 19-mo-old TBK1E696K knock-in and wt mice stained against synaptophysin/α-bungarotoxin and ChAT/Nissl, respectively. Arrowhead indicates denervated NMJs. Scale bars: 100 µm (LSC) and 50 µm (muscles). (E) The anterior horn motor neuron count differs significantly between TBK1E696K/E696K knock-in and wt mice at the age of 19 mo. Mean ± SEM of n = 6–8 male mice per genotype from four independent experiments; two-way ANOVA with post hoc Tukey’s multiple comparisons test; *P < 0.05; **P < 0.01. (F and G) Quantification of NMJ innervation reveals progressive denervation of the foot (distal) but not quadriceps (proximal) muscles in TBK1E696K knock-in mice compared with wt siblings. Mean ± SEM of n = 6–8 male mice per genotype from two independent experiments; two-way ANOVA with post hoc Tukey’s multiple comparisons test; *P < 0.05; ***P < 0.001. (H) Representative TEM photomicrographs of axons in the ventrolateral LSC of 17-mo-old TBK1E696K knock-in and wt mice. Scale bar: 5 µm. (I–M) Quantification of number, mean diameter (distribution), and g-ratio of axons shows a higher axon diameter and thinner myelin sheath in TBK1E696K/E696K knock-in mice. Median ± quartiles of pool of n > 14,000 axons from n = 3 mice of mixed sex (2 males/1 female) per genotype from two independent experiments; Mann–Whitney test in each panel; ****P < 0.0001.
Figure 4.
Figure 4.
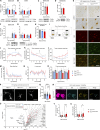
TBK1E696K/E696K knock-in impairs autophagy in cell models and mice. (A) Representative photomicrographs of TBK1E696K/E696K knock-in and wt primary cortical neurons stained against p62 and GABARAPL1. Scale bar: 10 µm. (B and C) Quantification of large p62+ and GABARAPL1+ inclusions in primary cortical neurons in A. Mean ± SEM of n = 9 embryos of mixed sex per genotype from more than three independent experiments; one-way ANOVA with post hoc Tukey’s multiple comparisons test; *P < 0.05; **P < 0.01. (D) Representative photomicrographs of LSC anterior horn motor neurons (MNs) of 6- and 19-mo-old TBK1E696K knock-in and wt mice stained against ChAT and p62. Scale bars: 50 µm, 10 µm. (E) Quantification of motor neurons with large cytosolic p62 inclusions in LSC in D. Mean ± SEM of n = 6 male mice per genotype from two independent experiments; two-way ANOVA with post hoc Tukey’s multiple comparisons test; **P < 0.01. (F) Representative photomicrographs of LSC anterior horn motor neurons (MNs) and motor cortex layer five neurons 19-mo-old TBK1E696K knock-in and wt mice stained against/with (p)TDP-43, Nissl, and DAPI shows no evidence of (p)TDP-43 pathology in TBK1E696K knock-in mice. Scale bar: 50/50/10 µm. (G) The ratio of the pTDP-43 MFI nucleus/cytoplasm in LSC motor neurons is unaltered in TBK1E696K knock-in mice. Mean ± SEM of pool of n > 29 motor neurons from n = 3 male mice per genotype from two independent experiments; Mann–Whitney test; ****P < 0.0001. (H) Scheme of protease protection coupled APEX2 proximity proteomics of autophagosomes of MEFs. (I) Volcano plot visualizing autophagosome content profiling in TBK1E696K/E696K knock-in MEFs compared to wt. N = 4 technical replicates per condition from two independent experiments; multiple Student’s t tests with FDR correction for multiple testing; red/blue colors indicate significantly enriched proteins (P < 0.05). (J) Representative photomicrographs of TBK1E696K/E696K knock-in and wt MEFs stained against LAMP1, LC3 and p62. Scale bar: 10 µm. Last panel: TEM of knock-in and wt MEFs shows dysmorphic and enlarged lysosomes (arrowhead and magnification) in cells with homozygous TBK1E696K knock-in. Scale bar: 500 nm. (K and L) Western blot analysis of MEF lysates to validate the top candidates from I: LC3 and LAMP1. UT = untreated. Mean ± SEM of n = 6 replicates per condition from six independent experiments; two-way ANOVA with post hoc Šídák’s multiple comparisons test; *P < 0.05. Source data are available for this figure: SourceData F4.
Figure 5.
Figure 5.
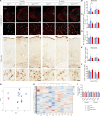
TBK1E696K/E696K knock-in causes (presymptomatic) lysosomal pathology in mice and hiPSC-derived human motor neurons. (A) Representative photomicrographs of lumbar anterior horn motor sections from 6- and 19-mo-old homozygous TBK1E696K knock-in and wt mice stained against LAMP1, GABARAPL1, cathepsin D, poly-ubiquitin, and Nissl. Scale bar: 10 µm. (B–G) Analysis of abundance and maximal size of GABARAPL1+, LAMP1+, and cathepsin-D+ punctae in lumbar spinal motor neurons in 6- and 19-mo-old TBK1E696K/E696K knock-in mice compared with wt siblings shows evidence of lysosomal impairment already at the presymptomatic stage. Mean ± SEM of the pool of n > 30 motor neurons from n = 4 male mice per genotype from two independent experiments; Mann–Whitney test; *P < 0.05; **P < 0.01; ****P < 0.0001. (H) Analysis of overlap between LAMP1 and poly-ubiquitin shows an age- but not genotype-dependent increase in ubiquitinylation of lysosomes. Mean ± SEM of pool of n > 28 motor neurons from n = 3–4 male mice per genotype from two independent experiments; Mann–Whitney test. (I) Representative photomicrographs of lumbar anterior horn motor sections from 17-mo-old homozygous TBK1E696K knock-in and wt mice recorded by TEM. Arrowheads indicate lysosomes; stars indicate mitochondria. Scale bars: 5 µm, 1 µm (insets). (J and K) The abundance of lysosomes and mitochondria in lumbar spinal motor neurons is increased in 17-mo-old TBK1E696K/E696K knock-in mice; Median ± quartiles of pool of n > 70 motor neurons from n = 3 mice of mixed sex (1 female/2 males) per genotype from two independent experiments; Mann–Whitney test; *P < 0.05; ****P < 0.0001. (L and M) The length and diameter of mitochondria in lumbar spinal motor neurons is slightly reduced in 17-mo-old TBK1E696K/E696K knock-in mice. Mean ± SEM of a pool of n > 13,000 mitochondria from n = 3 mice of mixed sex (1 female/2 males) per genotype from two independent experiments; Mann–Whitney test; ****P < 0.0001. (N) Representative photomicrographs of D35 hiPSC-derived motor neurons stained against ChAT and p62. Scale bar: 10 µm. (O and P) Analysis of abundance and maximal size of p62+ punctae shows an increased size and accumulation of autophagosomes in TBK1E696K/E696K-mutant D35 hiPSC-derived motor neurons. Mean ± SEM of pool of n > 90 motor neurons per genotype from three independent experiments; Mann–Whitney test; ****P < 0.0001. (Q) Representative photomicrographs of D35 hiPSC-derived motor neurons stained against MAP2, LAMP2, and galectin 8. Arrowheads indicate galectin 8+ lysosomes. Scale bar: 10 µm. (R and S) Analysis of abundance and maximal size of LAMP2+ punctae shows an accumulation of lysosomes in TBK1E696K/E696K-mutant D35 hiPSC-derived motor neurons. Mean ± SEM of pool of n > 120 motor neurons per genotype from three independent experiments; Mann–Whitney test; *P < 0.05. (T and U) Analysis of abundance and maximal size of galectin 8+ punctae shows an accumulation and increase of galectin 8+ organelles in TBK1E696K/E696K-mutant D35 hiPSC-derived motor neurons mostly colocalizing with LAMP2+ lysosomes. Mean ± SEM of a pool of n > 160 motor neurons per genotype from three independent experiments; Mann–Whitney test; ****P < 0.0001.

References

    1. Ahmad, L., Zhang S.-Y., Casanova J.-L., and Sancho-Shimizu V.. 2016. Human TBK1: A gatekeeper of neuroinflammation. Trends Mol. Med. 22:511–527. 10.1016/j.molmed.2016.04.006 - DOI - PMC - PubMed
    1. Arnold, E.S., Ling S.C., Huelga S.C., Lagier-Tourenne C., Polymenidou M., Ditsworth D., Kordasiewicz H.B., McAlonis-Downes M., Platoshyn O., Parone P.A., et al. . 2013. ALS-linked TDP-43 mutations produce aberrant RNA splicing and adult-onset motor neuron disease without aggregation or loss of nuclear TDP-43. Proc. Natl. Acad. Sci. USA. 110:E736–E745. 10.1073/pnas.1222809110 - DOI - PMC - PubMed
    1. Bell, S.L., Lopez K.L., Cox J.S., Patrick K.L., and Watson R.O.. 2021. Galectin-8 senses phagosomal damage and recruits selective autophagy adapter tax1bp1 to control mycobacterium tuberculosis infection in macrophages. MBio. 12:e0187120. 10.1128/mBio.01871-20 - DOI - PMC - PubMed
    1. Brenner, D. 2024. Raw data and statistical analysis [Data set]. In Journal of Experimental Medicine. Version 2. Zenodo. https://doi.org/10.5281/zenodo.10511341 - DOI
    1. Brenner, D., Sieverding K., Bruno C., Lüningschrör P., Buck E., Mungwa S., Fischer L., Brockmann S.J., Ulmer J., Bliederhäuser C., et al. . 2019. Heterozygous Tbk1 loss has opposing effects in early and late stages of ALS in mice. J. Exp. Med. 216:267–278. 10.1084/jem.20180729 - DOI - PMC - PubMed

Substances