. 2024 Mar 22;19(3):e0300806.
doi: 10.1371/journal.pone.0300806. eCollection 2024.

Monitoring the after-effects of ischemic stroke through EEG microstates

Affiliations

Monitoring the after-effects of ischemic stroke through EEG microstates

Fang Wang et al. PLoS One. .

Abstract

Background and purpose: Stroke may cause extensive after-effects such as motor function impairments and disorder of consciousness (DoC). Detecting these after-effects of stroke and monitoring their changes are challenging jobs currently undertaken via traditional clinical examinations. These behavioural examinations often take a great deal of manpower and time, thus consuming significant resources. Computer-aided examinations of the electroencephalogram (EEG) microstates derived from bedside EEG monitoring may provide an alternative way to assist medical practitioners in a quick assessment of the after-effects of stroke.

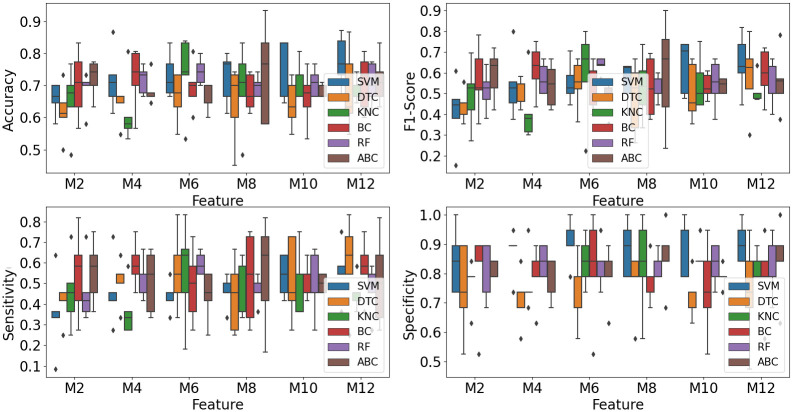
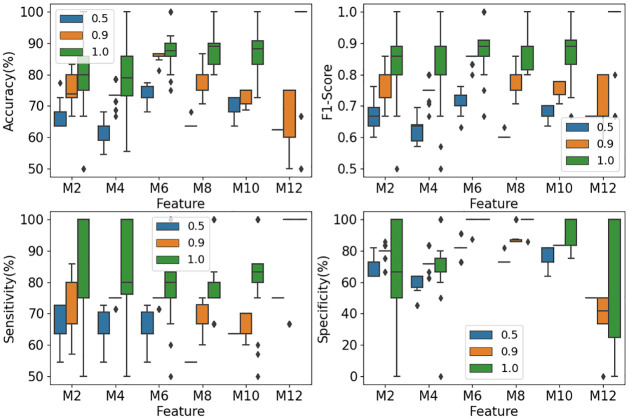
Methods: In this study, we designed a framework to extract microstate maps and calculate their statistical parameters to input to classifiers to identify DoC in ischemic stroke patients automatically. As the dataset is imbalanced with the minority of patients being DoC, an ensemble of support vector machines (EOSVM) is designed to solve the problem that classifiers always tend to be the majority classes in the classification on an imbalanced dataset.

Results: The experimental results show EOSVM get better performance (with accuracy and F1-Score both higher than 89%), improving sensitivity the most, from lower than 60% (SVM and AdaBoost) to higher than 80%. This highlighted the usefulness of the EOSVM-aided DoC detection based on microstates parameters.

Conclusion: Therefore, the classifier EOSVM classification based on features of EEG microstates is helpful to medical practitioners in DoC detection with saved resources that would otherwise be consumed in traditional clinic checks.


Conflict of interest statement

The authors have declared that no competing interests exist.

Figures

Fig 1
Fig 1. The procedure of the microstate analysis in this study.
Fig 2
Fig 2. The framework of our EOSVM classifier.
In the training phase, each of the SVMs in the EOSVM takes a different subset of data as its input as shown in the upper part of the figure. In the test phase, all SVMs take the same input for prediction, for which an example of 3 samples is shown in the lower part of the figure.
Fig 3
Fig 3. The figure shows the six microstate prototypes of A, B, C, D, E and F at the bottom of the figure.
In the top part of the figure, the line shows the mean and standard deviation of Global explained variance (GEV) for the six microstates (A, B, C, D, E and F). GEV is a measure of how similar each EEG sample is to the microstate prototype it has been assigned to [22]. In the correlation analysis and T-test in this study, we focused on these 6 cluster maps as in some previous studies.
Fig 4
Fig 4. Microstate prototypes of spatial clustering analysis using a modified K-means clustering method.
The clustering analysis of the maps was carried out at the GFP peaks of the EEG dataset aggregated from all EEG files of 152 subjects. The graph shows the cluster maps when EEG data were clustered to k microstates for k = 2, 3, ⋯, 8.
Fig 5
Fig 5. Correlation matrices visualized with coloured significance levels of correlations between EEG microstates and the level of consciousness in stroke subjects.
The colour ‘blue’ represents positive correlations and the color ‘red’ refers to negative correlations. In subfigure (a), correlations with p-value <0.05 are considered to be significant and the insignificant ones are marked with ‘×’. Subfigure (b) are correlations with p-value <0.01.
Fig 6
Fig 6. Classification results from SVM.
M+ number on the horizontal axis refers to how many microstates maps the features are derived from. For example, M2 refers to the features derived from 2 microstate maps.
Fig 7
Fig 7. Classification results from AdaBoost.
M+ number on the horizontal axis refers to how many microstates maps the features are derived from. For example, M4 refers to the features derived from 4 microstate maps.
Fig 8
Fig 8. Classification results from 6 classifiers.
M + number on the horizontal axis refers to how many microstate maps the features are derived from. For example, M4 refers to the features derived from 4 microstate maps.
Fig 9
Fig 9. Classification results from EOSVM.
M+ number on the horizontal axis refers to how many microstate maps the features are derived from. For example, M6 refers to the features derived from 6 microstate maps.
Fig 10
Fig 10. Evaluation results of TruePrediction, FalsePrediction, and NotSure under different numbers of microstate maps.
(a) represents the 100% majority voting results, (b) represents the 90% majority voting results, (c) represents the 50% majority voting results. The black area represents the proportion of patients that cannot be predicted (NotSure), giving no final prediction from the EOSVM. The red area stands for FalsePrediction from the EOSVM, i.e., either classifies a DoC patient to the wakefulness class or predicts an awake patient to the DoC class. The blue area refers to TruePredictionin percentage, i.e., classifies DoC and awake patients correctly to their respective classes.

References

    1. Sousa RM, Ferri CP, Acosta D, Albanese E, Guerra M, Huang Y, et al.. Contribution of chronic diseases to disability in elderly people in countries with low and middle incomes: a 10/66 Dementia Research Group population-based survey. The Lancet. 2009;374(9704):1821–1830. doi: 10.1016/S0140-6736(09)61829-8 - DOI - PMC - PubMed
    1. Reinkensmeyer DJ, Kahn LE, Averbuch M, McKenna-Cole A, Schmit BD, Rymer WZ. Understanding and treating arm movement impairment after chronic brain injury: progress with the ARM guide. Journal of Rehabilitation Research and Development. 2000;37(6):653–62. - PubMed
    1. Claassen J, Velazquez A, Meyers E, Witsch J, Falo MC, Park S, et al.. Bedside quantitative electroencephalography improves assessment of consciousness in comatose subarachnoid hemorrhage patients. Annals of neurology. 2016;80(4):541–553. doi: 10.1002/ana.24752 - DOI - PMC - PubMed
    1. Koganemaru Satoko, Kitatani Ryosuke, Fukushima-Maeda Ayaka, et al.. Gait-Synchronized Rhythmic Brain Stimulation Improves Poststroke Gait Disturbance: A Pilot Study. Stroke. 2019;50(11):3205–3212. doi: 10.1161/STROKEAHA.119.025354 - DOI - PubMed
    1. González B, Rodríguez M, Ramirez C, Sabaté M. Disturbance of motor imagery after cerebellar stroke. Behavioral Neuroscience. 2005;119(2):622–626. doi: 10.1037/0735-7044.119.2.622 - DOI - PubMed