. 2024 Apr 23;43(4):113953.
doi: 10.1016/j.celrep.2024.113953. Epub 2024 Mar 21.

Peripheral neuronal activation shapes the microbiome and alters gut physiology

Affiliations

Peripheral neuronal activation shapes the microbiome and alters gut physiology

Jessica A Griffiths et al. Cell Rep. .

Abstract

The gastrointestinal (GI) tract is innervated by intrinsic neurons of the enteric nervous system (ENS) and extrinsic neurons of the central nervous system and peripheral ganglia. The GI tract also harbors a diverse microbiome, but interactions between the ENS and the microbiome remain poorly understood. Here, we activate choline acetyltransferase (ChAT)-expressing or tyrosine hydroxylase (TH)-expressing gut-associated neurons in mice to determine effects on intestinal microbial communities and their metabolites as well as on host physiology. The resulting multi-omics datasets support broad roles for discrete peripheral neuronal subtypes in shaping microbiome structure, including modulating bile acid profiles and fungal colonization. Physiologically, activation of either ChAT+ or TH+ neurons increases fecal output, while only ChAT+ activation results in increased colonic contractility and diarrhea-like fluid secretion. These findings suggest that specific subsets of peripherally activated neurons differentially regulate the gut microbiome and GI physiology in mice without involvement of signals from the brain.

Keywords: Akkermansia muciniphila; CP: Microbiology; CP: Neuroscience; cholinergic; dopaminergic; enteric nervous system; gut microbiome; gut motility; noradrenergic; peripheral nervous system.


Conflict of interest statement

Declaration of interests B.B.Y. declares financial interests in Nuanced Health, which is not related to the present study. S.K.M. declares financial interests in Axial Therapeutics and Nuanced Health, which is not related to the present study. P.C.D. is an advisor and holds equity in Cybele and Sirenas and is a scientific co-founder and advisor and holds equity to Ometa, Enveda, and Arome with prior approval by University of California, San Diego. He also consulted for DSM animal health in 2023. R.K. is a scientific advisory board member and consultant for BiomeSense, Inc.; has equity, and receives income. He is a scientific advisory board member of and has equity in GenCirq. He is a consultant and scientific advisory board member for DayTwo and receives income. He has equity in and acts as a consultant for Cybele. He is a co-founder of Biota, Inc. and has equity. He is a cofounder of Micronoma, has equity, and is a scientific advisory board member. The terms of these arrangements have been reviewed and approved by the University of California, San Diego in accordance with its conflict of interest policies.

Figures

Figure 1.
Figure 1.. ChAT+ versus TH+ neuronal distribution in the ENS
(A) Representative images of SI and colon from mice infected with AAV-PHP.S-hSYN1-tdTomato and immunolabeled with the pan-neuronal antibody PGP9.5. Inset: quantification of the ratio of tdTomato+ cells/PGP9.5+ cells (n = 3 mice; each data point represents the average of 3 representative fields). (B) Representative images of proximal and distal regions of the SI and colon from AAV-PHP.S-hSYN1-XFP-infected mice. Dotted lines demarcate the rugae (folds) in the proximal colon. (C) Representative images of cross-sections and myenteric and submucosal plexuses in ChAT-Cre and TH-Cre mice infected with AAV-PHP.S-hSYN1-DIO-XFP. (D and E) Density of neurons in the myenteric plexus and submucosal plexus of ChAT-Cre and TH-Cre mice normalized to the number of crypts (n = 3 mice; each data point represents the average of 3 representative fields). ChAT-Cre vs. TH-Cre mice were compared using two-way ANOVA with Sidak’s correction for multiple comparisons for the SI and LI independently. Comparison of different regions in the SI of ChAT-Cre or TH-Cre mice was analyzed using one-way ANOVAs with Tukey’s correction for multiple comparisons. See also Figures S1–S5 and Video S1. Source data can be found at https://github.com/mazmanianlab/Griffiths_Yoo_et_al/tree/main/ENS%20quantification.
Figure 2.
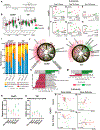
Figure 2.. Gut-associated ChAT+ and TH+ neuronal activation alters the gut microbiome
(A) Experimental paradigm. Cre-dependent hM3Dq was virally administered to either ChAT-Cre or TH-Cre mice. After 3–4 weeks of expression, C21 was injected daily for 10 days to induce specific neuronal activation. Feces was sampled the day prior to the first C21 injection and on days 2, 6, and 10 of C21 administration, and tissue and cecal contents were collected 1 h after the last injection. (B) Faith’s phylogenetic diversity of feces and cecal contents over 10 days of neuronal activation in ChAT+ and TH+ mice. Feces was collected pre-experiment (1 day before the first injection) and on days 2, 6, and 10. Cecal contents were collected at the experimental endpoint on day 10. **p < 0.01, ***p < 0.001, determined by Kruskal-Wallis one-way ANOVA. (C–H) Weighted UniFrac principal-coordinate analysis (PCoA) of activated vs. control in ChAT+ and TH+ mice. Statistics were performed in QIIME2 as in Bolyen et al. (I) Stacked bar graph showing phylum-level changes in relative abundance on day 6 and day 10 of injection for feces and day 10 for cecal contents. (J–M) Linear discriminant analysis effect size (LEfSe) of the cecal microbiome. Cladograms show differential phylogenetic clusters and family-level differences in activated and control (J and K) ChAT+ and (L and M) TH+ mice. Cutoff: log10(LDA score) > 2 or < −2. (N and O) Changes in relative abundance of A. muciniphila in feces and cecal contents of (N) ChAT+ and (O) TH+ mice (n = 11–14 mice per group per time point). Red, control; green, hM3Dq-activated. *p < 0.05, **p < 0.01, determined by multiple t tests with Holm-Sidak correction for multiple comparisons. (P–S) Beta diversity of bacterial gene families and pathways in the (P and R) cecum and (Q and S) post-9 feces of control and activated mice. The direction and length of arrows indicate their influence in separating control and activated groups. Colors represent gene families and pathways (annotated in Figure S7). See also Figures S6 and S7. Source can be found at https://github.com/mazmanianlab/Griffiths_Yoo_et_al/tree/main/metagenomics.
Figure 3.
Figure 3.. Gut-associated ChAT+ or TH+ neuronal activation alters host and microbe-derived luminal metabolites
(A and B) Canberra PCoA of the cell-free, luminal metabolome of cecal contents from control (red) and activated (green) ChAT+ and TH+ mice. Statistical analyses were performed in QIIME2 as in Bolyen et al. (C and D) Metabolic networks constructed from identified cecal metabolites in TH+ and ChAT+ mice. Each node is colored by its upregulation (green) or downregulation (red) in the activated group and is labeled with an ID number corresponding to annotation, mass-to-charge ratio, retention time, fold change, and significance value in Table S1. (E) Fold changes of specific bile acids identified as upregulated (green bars) or downregulated (red bars) in activated ChAT+ mice. (F) Annotations of bile acids highlighted in (E). Metabolite IDs are colored according to annotation as primary (blue) or secondary (orange) bile acids. Metabolite IDs are specific to each sample (n = 12–14 for each group analyzed). *p < 0.05, **p < 0.01, ***p < 0.001, ****p < 0.0001. See also Table S1.
Figure 4.
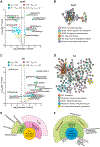
Figure 4.. Gut-associated ChAT+ or TH+ neuronal activation alters host and microbe-derived luminal proteins
(A) Volcano plot of differentially expressed host proteins identified in the cecal contents of ChAT+-activated (n = 8) vs. ChAT+ control (n = 9) mice 1 h after final C21 administration. (B) STRING network analysis of host proteins that were more abundant in ChAT+-activated mice (pnom. < 0.2). (C) Proteomics volcano plot of TH+-activated vs. TH+ control mice (n = 7 mice per group). (D) STRING network analysis of upregulated host proteins in TH+-activated mice (pnom. < 0.2). (E and F) Unipept metaproteomics analysis of upregulated microbial proteins (fold change > 2, pnom. < 0.2) in TH+-activated and ChAT+-activated mice (n = 7–9 mice per group). Source data for (A) can be found at https://github.com/mazmanianlab/Griffiths_Yoo_et_al/blob/main/proteomics/CHAT_proteomics_volcano.txt. Source data for (C) can be found at https://github.com/mazmanianlab/Griffiths_Yoo_et_al/blob/main/proteomics/TH_proteomics_volcano.txt. Source data for (E) and (F) can be found at https://github.com/mazmanianlab/Griffiths_Yoo_et_al/blob/main/proteomics/metaproteomics/Microbiome_associated_proteins.xlsx.
Figure 5.
Figure 5.. ChAT + and TH+ activation-mediated transcriptomic changes
(A–D) DEGs in DREADD-activated vs. control (A) ChAT + distal SI, (B) ChAT+ proximal colon, (C) TH+ distal SI, and (D) TH+ proximal colon. Dashed vertical lines, fold change (FC) ± 1.5; dashed horizontal lines, padj. < 0.05. Transcripts of IEGs are highlighted in green and annotated. (n = 10 mice per group). (E) FC of upregulated IEGs (padj. < 0.05) as defined previously. (F–I) GSEA of Gene Ontology (GO) terms for (F) ChAT+ distal SI, (G) ChAT+ proximal colon, (H) TH+ distal SI, and (I) TH+ proximal colon. See also Tables S2 and S3. Source Can be found at https://github.com/mazmanianlab/Griffiths_Yoo_et_al/tree/main/RNAseq.
Figure 6.
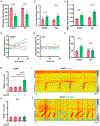
Figure 6.. GI physiology differences in ChAT+ vs. TH+ mice following activation
(A) Activation-mediated changes in whole-gut transit time in ChAT+ and TH+ mice. (B) Activation-mediated changes in fecal pellet output in ChAT+ and TH+ mice. (C) Activation-mediated changes in normalized cecal content mass in ChAT+ and TH+ mice. (D and E) Fecal pellet water content in (D) ChAT+ and (E) TH+ mice over 2 h following C21 activation, with a least-squares nonlinear regression displaying a 95% confidence interval. (F) Average fecal pellet water content in ChAT+ and TH+ mice following activation. (A–F) (n = 10–11 mice per group). *p < 0.05, ***p < 0.001, ****p < 0.0001, determined by 2-way ANOVA with Sidak′s method for multiple comparisons. (G and H) Frequency of ex vivo CMMCs from (G) ChAT+ and (H) TH+ mice over 30 min following activation (n = 3–6 mice per group). **p < 0.01, ***p < 0.001, determined by 2-way ANOVA with Sidak′s method for multiple comparisons. (I and J) Heatmaps showing frequency of CMMCs over 400 s following activation in ex vivo preparations from (I) ChAT+ control and (J) ChAT+ DREADD-administered mice. See also Figure S6 and Table S4.

References

    1. Furness JB (2008). The Enteric Nervous System (Wiley; ). https://books.google.com/books?id=pvkpdNHhI6cC.
    1. Rao M, and Gershon MD (2016). The bowel and beyond: the enteric nervous system in neurological disorders. Nat. Rev. Gastroenterol. Hepatol 13, 517–528. 10.1038/nrgastro.2016.107. - DOI - PMC - PubMed
    1. Grundy D, and Brookes S (2011). Neural Control of Gastrointestinal Function (Morgan & Claypool Life Science Publishers; ). https://books.google.com/books?id=NV2BMJk6XHwC.
    1. Furness JB, Callaghan BP, Rivera LR, and Cho HJ (2014). The enteric nervous system and gastrointestinal innervation: integrated local and central control. Adv. Exp. Med. Biol 817, 39–71. 10.1007/978-1-4939-0897-4_3. - DOI - PubMed
    1. Schneider S, Wright CM, and Heuckeroth RO (2019). Unexpected Roles for the Second Brain: Enteric Nervous System as Master Regulator of Bowel Function. Annu. Rev. Physiol 81, 235–259. 10.1146/annurev-physiol-021317-121515. - DOI - PubMed

Publication types

Substances