. 2024 Mar 22;9(93):eadi8150.
doi: 10.1126/sciimmunol.adi8150. Epub 2024 Mar 22.

Invasion of spontaneous germinal centers by naive B cells is rapid and persistent

Affiliations

Invasion of spontaneous germinal centers by naive B cells is rapid and persistent

Theo van den Broek et al. Sci Immunol. .

Abstract

In autoreactive germinal centers (GC) initiated by a single rogue B cell clone, wild-type B cells expand and give rise to clones that target other autoantigens, known as epitope spreading. The chronic, progressive nature of epitope spreading calls for early interventions to limit autoimmune pathologies, but the kinetics and molecular requirements for wild-type B cell invasion and participation in GC remain largely unknown. With parabiosis and adoptive transfer approaches in a murine model of systemic lupus erythematosus, we demonstrate that wild-type B cells join existing GCs rapidly, clonally expand, persist, and contribute to autoantibody production and diversification. The invasion of autoreactive GCs by wild-type B cells required TLR7, B cell receptor specificity, antigen presentation, and type I interferon signaling. The adoptive transfer model provides a tool for identifying early events in the breaking of B cell tolerance in autoimmunity.


Conflict of interest statement

Competing interests:

The authors declare that they have no competing interests.

Figures
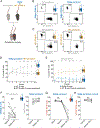
Figure 1.
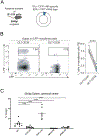
Figure 1.. TLR7-dependent wild-type B cell dominance in spontaneous GCs in 564Igi:WT parabionts.
A. Schematic depiction of the parabiosis model (WT = wild-type). B. Representative FACS dot plot of the proportion of WT or 564Igi B cells in the circulation of the WT and 564Igi parabionts, at 6 weeks parabiosis. C. Representative FACS dot plot of the proportion of WT (CD45.2) or WT (CD45.1) cells in the circulation of the WT and WT control parabiosis, at 8–9 weeks. D. Frequency of wild-type (WT) B cells in the circulation of 564Igi parabiosis partner (grey circles) or WT parabiosis partner (control parabiosis, black circles) over time. Week 1 (564Igi n=11 vs WT n=6), Week 2 (n=5 vs n=6), Week 3 (n=10 vs n6), Week 4 (n=8 vs n=4), Week 5 (n=10 vs n=6), Week 6 (n=10 v n=6), Week 7 (n=9 vs n=2), Week 8–9 (n=10 vs n=6). E. Frequency of 564Igi (blue circles) or WT (control parabiosis, yellow circles) B cells in the circulation of WT parabiosis partner mouse over time. As in Figure 1B, but week 2 (564Igi n=6 vs WT n=6), Week 6 (n=9 vs n=6). F. Frequency of 564Igi B cells in WT parabiosis partner (left column), and in the 564Igi partner, the proportion of WT B cells in the total splenic B cell population or within the germinal center (GC) B cell population within the spleen 8 weeks following surgery. G. Parabiosis pairing of Toll-Like receptor 7 knock-out (TLR KO) mouse with 564Igi mouse for 8 weeks, showing the proportion of TLR7 KO B cells within circulation (n=5), splenic B cell pool (n=6) and splenic GC B cell population (n=6) of the 564Igi parabiosis partner. H. Parabiosis pairing of Toll-Like receptor 7 knock-out (TLR KO) mouse with 564Igi mouse for 8 weeks, showing the proportion of TLR7 KO B cells within the mesenteric lymph node (mesLN) B cell pool (n=6) and mesLN GC B cell population (n=6) of the 564Igi parabiosis partner. Significance is indicated as ***P<0.001, **P<0.01, *P<0.05, and P>0.05 (not significant (NS)) by Mann-Whitney test for Fig 1D, 1E and by Wilcoxon paired test for Fig 1F, 1G, 1H.
Figure 2.
Figure 2.. Temporary parabiosis highlights WT B cell persistence in the spontaneous germinal center
A. Schematic representation of parabiosis surgery followed by surgical separation at 2 weeks of parabiosis and subsequent follow-up. B. The proportion of 564Igi (blue circles) or WT (Control parabiosis, yellow circles) B cells in the circulation of WT parabiosis partner mouse over time. Week 1 (564Igi n=8 vs WT n=5), Week 2 (n=19 vs n=5), Week 3 (n=12 vs n=4), Week 4 (n=11 vs n=4), Week 5 (n=11 vs n=4), Week 6 (n=9 v n=4), Week 7 (n=7 vs n=4), Week 8–9 (n=8 vs n=3). C. The proportion of wild-type (WT) B cells in the circulation of 564Igi (grey circles) or WT (control parabiosis, black circles) parabiosis partner mouse over time. Number of mice as in Figure 2B. D. The proportion of 564Igi B cells in the WT parabiosis partner (left graph, n=9), and in the 564Igi parabiosis partner (right graph, n=10), the proportion of WT B cells in the circulation, splenic B cell population or splenic germinal center B cell population, after 2 weeks of parabiosis and subsequent 6 weeks of separation. Significance is indicated as ***P<0.001, **P<0.01, *P<0.05, and P>0.05 (not significant (NS) by Mann-Whitney test for Fig 2B, 2C and Wilcoxon paired test for Fig 2D (blood vs spleen, spleen vs spleen GC).
Figure 3.
Figure 3.. Temporary parabiosis highlights WT B cell persistence and clonal expansion in autoreactive 564Igi GCs.
A. Schematic depiction of parabiosis and separation surgery of AID-Creert2 Confetti mouse with 564Igi mouse to assess clonal evolution of WT B cells in 564Igi partner at day +4, +15, and +31 post-separation surgery. B. Representative multi-photon images of the splenic GC of the 564Igi parabiosis mouse partner for quantification of color dominance. The scale bars indicate 100 μm. C. Frequency of most frequent color (1st), second-most frequent color (2nd), and their sum observed in individual splenic GC at Day 3, 15, and 31 post-tamoxifen induction of Confetti recombination in 564Igi parabiont. Day 3 (2 mice, 10 GC), day 15 (3 mice, 30 GC) and day 30 (4 mice, 18 GC). D. The divergence index for the GC represented in (C). E. The number of fate-mapped WT B cells for the GC represented in (C). Significance is indicated as ***P<0.001, **P<0.01, *P<0.05, and P>0.05 (not significant (NS)) by Mann-Whitney test for Fig 3C,3D (compared to day 3) and ANOVA with posthoc test (Dunn) for Fig 3E.
Figure 4.
Figure 4.. Wild-type B cells rapidly enter the pre-existing autoreactive germinal center.
A. Schematic depiction of WT B cell adoptive transfer model and follow-up time points. B. Representative FACs dot plot of WT B cells in the splenic B cell compartment and within the splenic germinal center B cell compartment, at day 7. Day 1 (n=1), day 2 (n=1), day 3 (n=7), day 4 (n=7), day 5 (n=7), day 6 (n=7), day 7 (n=11), day 10 (n=6), day 14 (n=9), day 21 (n=7), day 56 (n=5). C. The proportion of WT B cells within the splenic B cell pool (grey line, open circle) and splenic germinal center B cell pool (black line, closed circle) over time. D. Bar charts indicating the frequency (left) and absolute number (right) of GCs populated by WT and 564Igi, 564Igi only, or WT only B cells (left). Each symbol indicates a mouse. E. Pie charts demonstrating the frequency of GCs populated by both WT and 564Igi, 564Igi only or WT only B cells as a frequency of white pulp areas (WPAs) in individual mice. No GCs with only B6.2 B cells were identified. F. Representative confocal immunofluorescence microscopy image showing GC composition in a splenic section; GCs were identified by GL7 (green) staining and confirmed by the overlapping CD21bright staining of FDC networks in a consecutive slice. Anti-CD45.1 (blue) and anti-CD45.2 (red) staining was used to identify 564Igi- and WT-derived cells, respectively. Arrows indicate GCs with different patterns of WT residency. GCs contained within boxes with roman numerals are magnified in the smaller panels to the right. G. Bar chart showing the area of GCs with WT and 564Igi and 564Igi only residents. Each symbol indicates a GC. Wilcoxon paired test: Fig 4B. Fig 4C: One-way ANOVA with Bonferroni’s multiple comparison test. Fig 4F: Mann-Whitney test. Values are mean+/− SD. Significance is indicated as ***P<0.001, **P<0.01, *P<0.05, and P>0.05 (not significant (NS)).
Figure 5.
Figure 5.. Molecular requirements for wild-type B cell entry and participation in spontaneous germinal centers.
A. Schematic representation of B1–8 B cell adoptive transfer. B. Representative FACSplot and gating for identifying NP-specific B cells (left panel). The proportion of Lambda-positive (NP-specific) B cells within the splenic B cell compartment, splenic GC B cells in the 564Igi mouse, 7 days post-transfer (n=6) (right panel). C. The proportion of germinal B cells derived from WT, MHC2 KO, TLR7 KO, SLE1-Yaa, and IFNAR KO transferred B cells within the splenic GC B cell compartment, 7 days post-transfer. (WT transfer n=10, MHC2 KO transfer n=8, TLR7 KO transfer n=11, SLE1-Yaa n=7, IFNAR KO transfer n=8.) Significance is indicated as ***P<0.001, **P<0.01, *P<0.05, and P>0.05 (not significant (NS)). The statistical test used is the Mann-Whitney test for Fig 5B, C (compared to WT).

Update of

References

    1. Lipsky PE, Systemic lupus erythematosus: an autoimmune disease of B cell hyperactivity. Nat. Immunol. 2, 764–766 (2001). - PubMed
    1. Arbuckle MR, McClain MT, Rubertone MV, Scofield RH, Dennis GJ, James JA, Harley JB, Development of Autoantibodies before the Clinical Onset of Systemic Lupus Erythematosus. N. Engl. J. Med. 349, 1526–1533 (2003). - PubMed
    1. Wardemann H, Yurasov S, Schaefer A, Young JW, Meffre E, Nussenzweig MC, Predominant Autoantibody Production by Early Human B Cell Precursors. Science. 301, 1374–1377 (2003). - PubMed
    1. Koelsch K, Zheng N-Y, Zhang Q, Duty A, Helms C, Mathias MD, Jared M, Smith K, Capra JD, Wilson PC, Mature B cells class switched to IgD are autoreactive in healthy individuals. J. Clin. Invest. 117, 1558–1565 (2007). - PMC - PubMed
    1. Deshmukh US, Gaskin F, Lewis JE, Kannapell CC, Fu SM, Mechanisms of Autoantibody Diversification to SLE-Related Autoantigens. Ann. N. Y. Acad. Sci. 987, 91–98 (2003). - PubMed