. 2024 Mar 22;10(12):eadl0788.
doi: 10.1126/sciadv.adl0788. Epub 2024 Mar 22.

FOXL2 interaction with different binding partners regulates the dynamics of ovarian development

Affiliations

FOXL2 interaction with different binding partners regulates the dynamics of ovarian development

Roberta Migale et al. Sci Adv. .

Abstract

The transcription factor FOXL2 is required in ovarian somatic cells for female fertility. Differential timing of Foxl2 deletion, in embryonic versus adult mouse ovary, leads to distinctive outcomes, suggesting different roles across development. Here, we comprehensively investigated FOXL2's role through a multi-omics approach to characterize gene expression dynamics and chromatin accessibility changes, coupled with genome-wide identification of FOXL2 targets and on-chromatin interacting partners in somatic cells across ovarian development. We found that FOXL2 regulates more targets postnatally, through interaction with factors regulating primordial follicle formation and steroidogenesis. Deletion of one interactor, ubiquitin-specific protease 7 (Usp7), results in impairment of somatic cell differentiation, germ cell nest breakdown, and ovarian development, leading to sterility. Our datasets constitute a comprehensive resource for exploration of the molecular mechanisms of ovarian development and causes of female infertility.


Figures
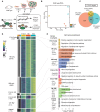
Fig. 1.
Fig. 1.. ChIP-SICAP time course reveals differential FOXL2 DNA binding across ovarian development.
(A) Experimental design of FOXL2 ChIP–SICAP performed on mouse ovaries collected at E14.5, 1W, and 8W, n = 2 biological replicates. A FOXL2-specific antibody was used to capture genomics fragments bound by FOXL2 as well as proteins colocalizing with FOXL2 on chromatin. (B) Principal components analysis (PCA) of FOXL2 ChIP-seq consensus peaks. (C) Venn diagram depicting the number of peaks identified at each time point and their overlap. (D) ChIP peak occupancy scores (gene level). Heatmap splitting is based on ChIP peak presence/absence as indicated by black/gray bars (left). Rows are scaled by z-score. The number of genes per cluster is shown below the cluster name. (E) Bar chart showing representative GO biological processes (BPs).
Fig. 2.
Fig. 2.. Identification of FOXL2 on-chromatin interactors by ChIP-SICAP.
(A) Venn diagram representing the FOXL2 interactors identified by FOXL2 ChIP-SICAP. The total number of proteins is reported between round brackets. (B) Bar chart showing the relative intensities calculated using iBAQ (intensity-based absolute quantification) of the proteins identified and classified as either nuclear or cytoplasmatic only (proteins shuttling between nucleus and cytoplasm are classified as nuclear). (C) GO BP enrichment analysis. (D to F) Volcano plot showing enrichment [Benjamini-Hochberg (BH) adjusted P < 0.1 and mean fold enrichment > 2] of FOXL2 immunoprecipitate versus no antibody control (n = 2 biological replicates/time point) of proteins colocalizing with FOXL2 on chromatin at E14.5 (D), 1W (E), and at 8W (F). Dotted lines separate significant proteins, also highlighted in yellow, orange, and blue. Black dots, selected FOXL2 interactors.
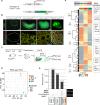
Fig. 3.
Fig. 3.. An integrative approach combining RNA-seq on Foxl2EGFP granulosa cells and ChIP-seq refines the GRNs controlled by FOXL2.
(A) CRISPR-Cas9 mediated enhanced green fluorescent protein (EGFP) insertion at the Foxl2 locus. 3′UTR, 3′ untranslated region. (B) Top row: Representative images of EGFP fluorescence in freshly collected gonads. Scale bars, 200 μm. Dotted lines outline the embryonic testis (left) and ovary (right). Lower row: colocalization of GFP and endogenous FOXL2 assessed by immunofluorescence, Scale bars, 100 μm. (C) Overview of sample collection and downstream analyses. (D) PCA plot of RNA-seq analysis of cells isolated from E14.5, 1W, and 8W gonads (n = 3 biological replicates). (E) Number of differentially expressed genes (DEGs) identified by RNA-seq, FOXL2 gene targets identified by ChIP-SICAP, and the overlap between the two datasets. DEGs identified by DESeq2’s Wald test, significant genes have an FDR < 0.01, a shrunken log2FC > 2 and a baseMean (i.e., mean abundance across all samples) > 2. (F) Hierarchical clustering of the 1100 genes bound by FOXL2 and differentially expressed across the time course. Gene examples are shown on the right. FDR < 0.05 (DESeq2 analysis of FOXL2 occupancy).
Fig. 4.
Fig. 4.. Granulosa cells have a dynamic chromatin landscape throughout development.
(A) PCA of ATAC-seq performed on Foxl2 EGFP/+ sorted somatic cells at E14.5, 1W, and 8W (n = 3 biological replicates, consensus peaks identified by DiffBind, FDR < 0.05, and assigned to the nearest gene by ChIPpeakAnno). (B) Venn diagram reporting the number of significant peaks. (C) Hierarchical clustering of peaks using Euclidean distance metric and complete linkage. (D) monaLisa analysis of TF motifs enrichment within the open chromatin regions. Top six motifs for each cluster are reported (data from table S6). (E) Heatmap displaying gene expression changes of representative TF, as assessed by RNA-seq (data from table S4). (F) Integrative Genomics Viewer (IGV) snapshots of representative regions and corresponding ATAC-seq and ChIP-SICAP peaks. *Sertoli H3K27Ac ChIP-seq was reanalyzed to match mm10 coordinates from (67). Gray bars and black arrowheads highlight significant peaks over input as assessed by ChIP-SICAP.
Fig. 5.
Fig. 5.. Deletion of Usp7 blocks somatic cell differentiation and impairs ovarian development.
Characterization of ovaries collected from Usp7fl/fl mice (control) and Usp7fl/fl;Sf1:Cretg/+ mice (mutants). Representative images of at least n = 3 biological replicates. Scale bars, 500 μm in all, unless otherwise specified. (A) Top row: Bright-field images showing morphology of control and mutant P0 ovaries. Bottom row: Immunofluorescence analysis of germ cell marker DDX4 (green) and granulosa cell marker FOXL2 (red) in ovary sections. Scale bars, 50 μm. (B) From the top: Bright-field images of 1W ovaries; hematoxylin and eosin staining; scale bars, 200 μm; higher magnification showing persistence of nest-like structures in mutants (arrowheads; scale bars, 50 μM) and absence of primary and secondary follicles; immunofluorescence staining for DDX4 and FOXL2 in 1W ovaries. (C) Reproductive tracts and ovaries from 8W control and mutant mice. Higher magnification; scale bars, 1 mm. Last row: High-resolution episcopic microscopy (HREM) three-dimensional (3D) rendering of reproductive tract from an 8W control ovary and a XX mutant. Asterisk indicates the area where an ovary should be. Arrow indicates infundibulum tip and lack of ovarian structure. Scale bars, 0.7 mm. Ovd, oviduct; Ov, ovary; U, uterus; B, bladder; Inf, infundibulum.

References

    1. Migale R., Neumann M., Lovell-Badge R., Long-range regulation of key sex determination genes. Sex. Dev. 15, 360–380 (2022). - PubMed
    1. Koopman P., Gubbay J., Vivian N., Goodfellow P., Lovell-Badge R., Male development of chromosomally female mice transgenic for Sry. Nature 351, 117–121 (1991). - PubMed
    1. Hacker A., Capel B., Goodfellow P., Lovell-Badge R., Expression of Sry, the mouse sex determining gene. Development 121, 1603–1614 (1995). - PubMed
    1. Bullejos M., Koopman P., Spatially dynamic expression of Sry in mouse genital ridges. Dev. Dyn. 221, 201–205 (2001). - PubMed
    1. Vidal V. P., Chaboissier M. C., de Rooij D. G., Schedl A., Sox9 induces testis development in XX transgenic mice. Nat. Genet. 28, 216–217 (2001). - PubMed

Publication types