. 2024 Mar 22;10(12):eadl1710.
doi: 10.1126/sciadv.adl1710. Epub 2024 Mar 22.

Peripheral priming induces plastic transcriptomic and proteomic responses in circulating neutrophils required for pathogen containment

Affiliations

Peripheral priming induces plastic transcriptomic and proteomic responses in circulating neutrophils required for pathogen containment

Rainer Kaiser et al. Sci Adv. .

Abstract

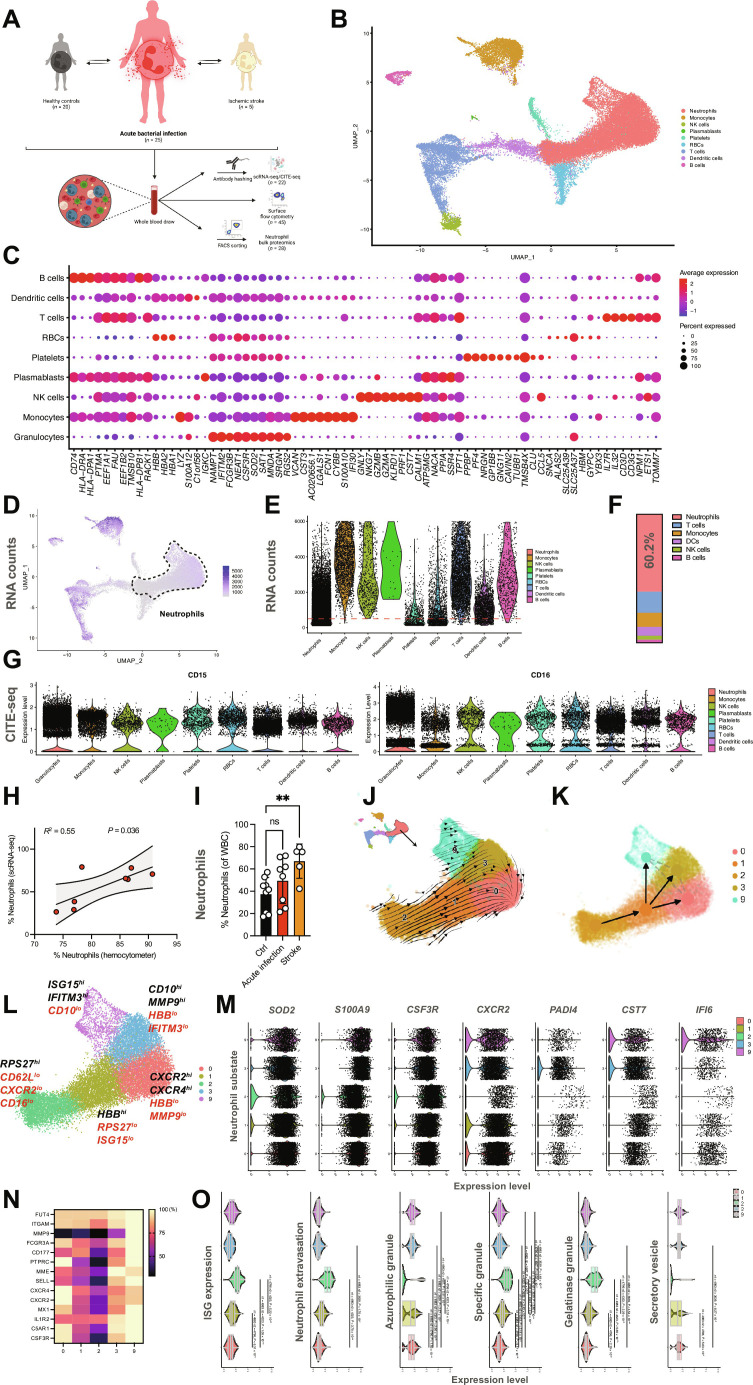
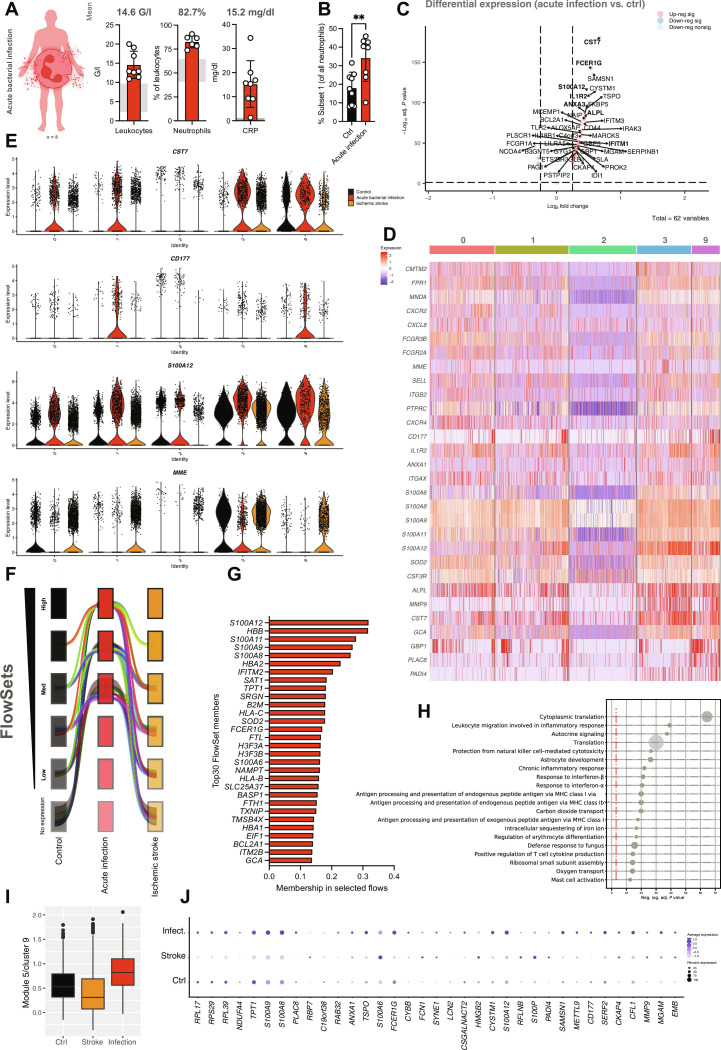
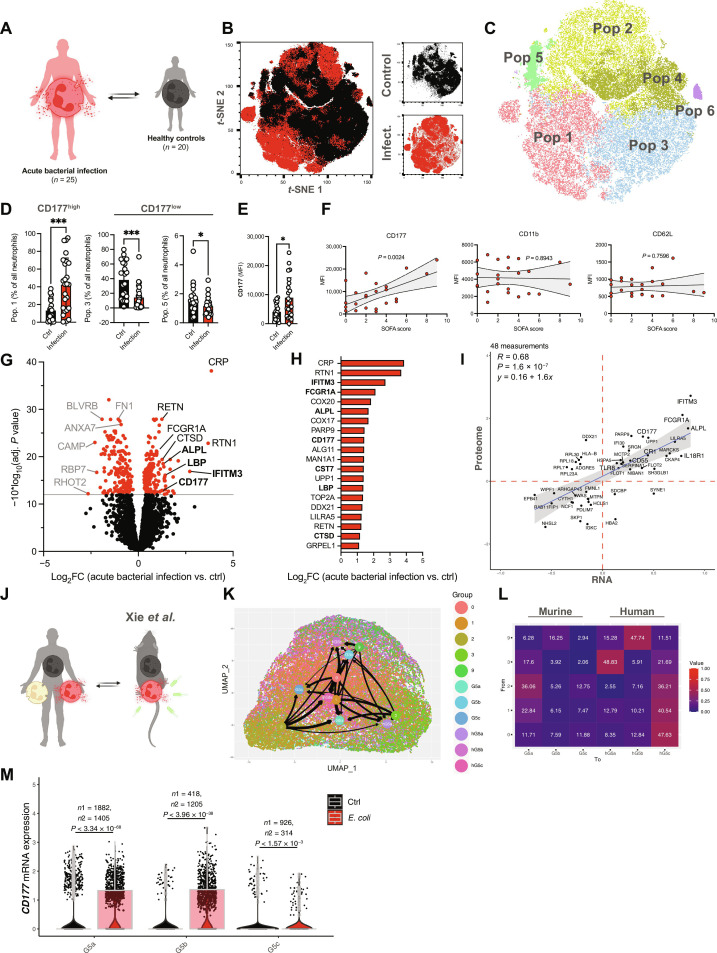
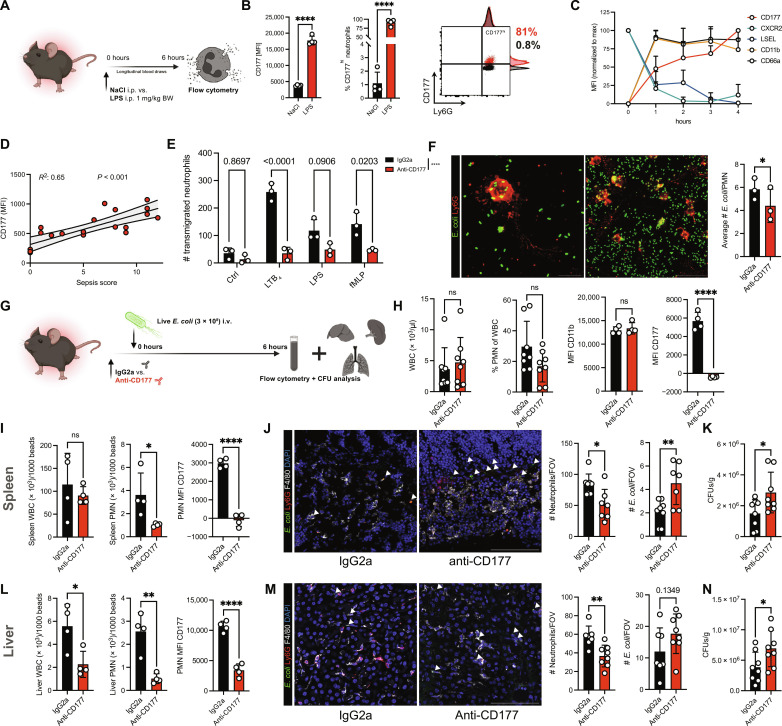
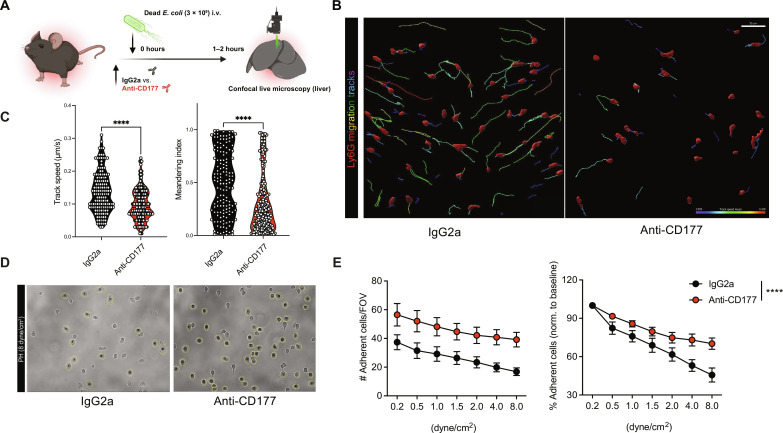
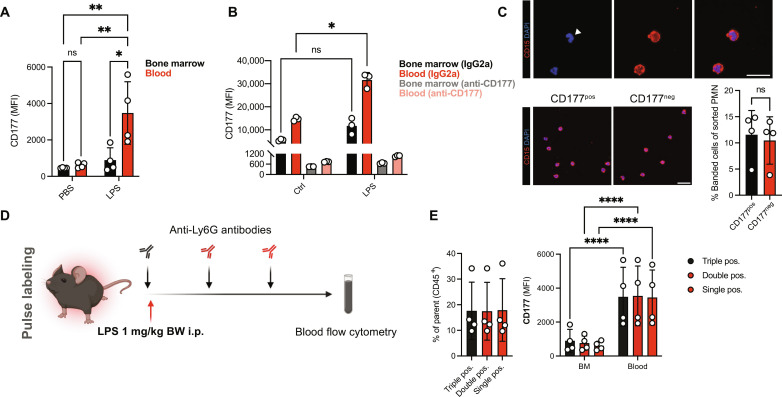
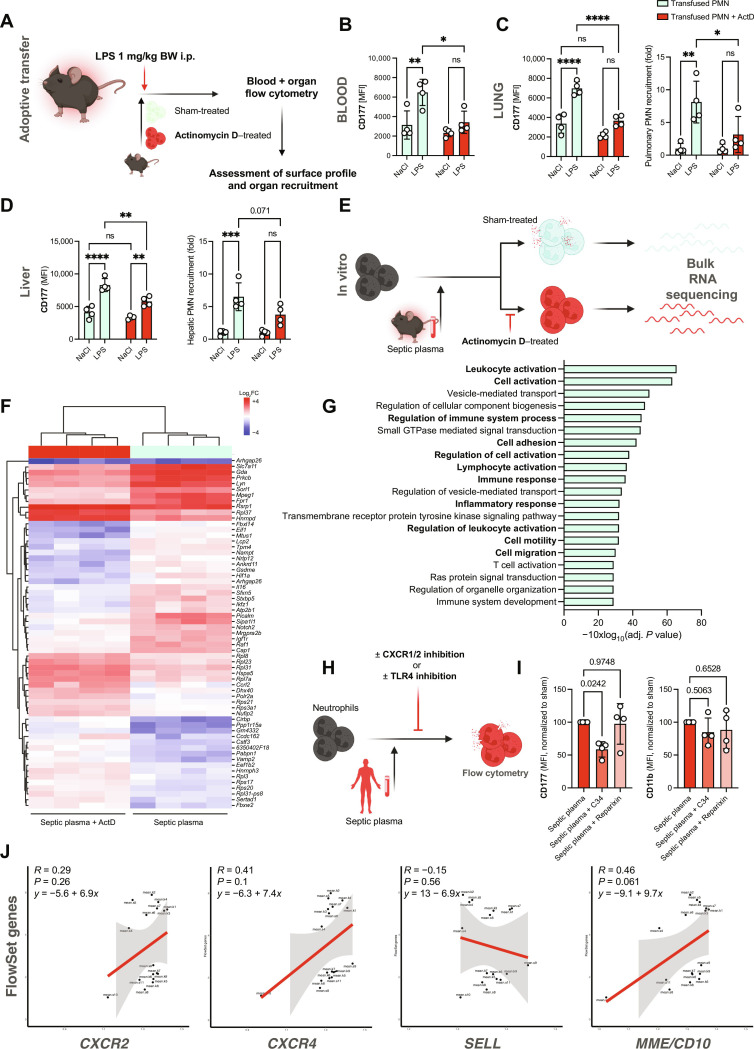
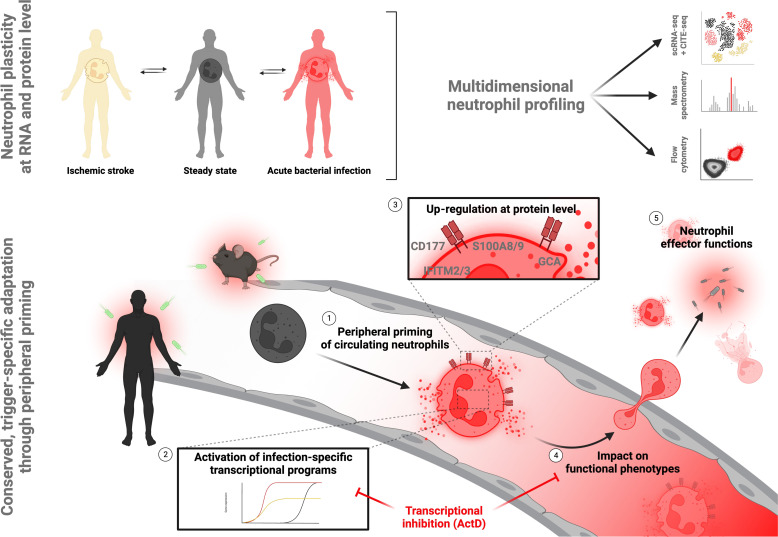
Neutrophils rapidly respond to inflammation and infection, but to which degree their functional trajectories after mobilization from the bone marrow are shaped within the circulation remains vague. Experimental limitations have so far hampered neutrophil research in human disease. Here, using innovative fixation and single-cell-based toolsets, we profile human and murine neutrophil transcriptomes and proteomes during steady state and bacterial infection. We find that peripheral priming of circulating neutrophils leads to dynamic shifts dominated by conserved up-regulation of antimicrobial genes across neutrophil substates, facilitating pathogen containment. We show the TLR4/NF-κB signaling-dependent up-regulation of canonical neutrophil activation markers like CD177/NB-1 during acute inflammation, resulting in functional shifts in vivo. Blocking de novo RNA synthesis in circulating neutrophils abrogates these plastic shifts and prevents the adaptation of antibacterial neutrophil programs by up-regulation of distinct effector molecules upon infection. These data underline transcriptional plasticity as a relevant mechanism of functional neutrophil reprogramming during acute infection to foster bacterial containment within the circulation.


Figures

Fig. 1.
Fig. 1.. Integrative single-cell RNA and epitope sequencing captures the neutrophil landscape in health and inflammation.
(A) Study design. (B) Integrative Uniform Manifold Approximation and Projection for Dimension Reduction (UMAP) of scRNA-seq data from human leukocytes (n = ∼35,000 cells and n = ∼20,000 neutrophils), with leukocyte populations clustered as indicated. NK, natural killer; RBCs, red blood cells. (C) Dot plot depicting expression of cell-type–defining genes. Compare fig. S1B for substate-defining genes of all 20 substates (0 to 19). (D) Feature plot of RNA content. (E) Violin plot depicting leukocyte RNA unique molecular identifier (UMI) counts. Red line indicates the UMI cutoff of 100 transcripts per cell. (F) Relative abundancy of leukocyte populations using scRNA-seq, as merged by leukocyte subset. DCs, dendritic cells. (G) Violin plots depicting the single-cell surface expression of CD15 and CD16 as assessed by CITE-seq, confirming substates 0, 1, 2, 3, and 9 as neutrophils. (H) Linear regression analysis of % of neutrophils as assessed by scRNA-seq versus the clinically detected relative amount of neutrophils of patients with acute infection included in the scRNA-seq part of this study. (I) Relative quantification of neutrophil subsets as detected by scRNA-seq. WBC, white blood cell; ns, not significant. One-way analysis of variance (ANOVA) with post hoc Kruskal-Wallis testing. (J and K) RNA velocity and partition-based graph abstraction analysis of neutrophil substates. (L) UMAP of neutrophil substates. Indicated genes reflect substate-defining genes differentially regulated in-between neutrophil substates (black, high expression; and red, low expression). (M) Expression of selected transcripts by substates 0, 1, 2, 3, and 9 depicted by violin plots. (N) Relative expression heatmap [normalized to maximum expression of respective transcript, (%)] of neutrophil surface markers. (O) Violin plots indicating module scores for indicated gene sets. Student’s t test, two-tailed, paired. Unless indicated with asterisks, post hoc testing revealed nonsignificant results (P ≥ 0.05). Unless indicated with asterisks, post hoc testing revealed nonsignificant results (P ≥ 0.05). P values corresponding to asterisks: **P < 0.01.
Fig. 2.
Fig. 2.. Substate-specific and global neutrophil transcriptomic responses to acute bacterial infection.
(A) Clinical laboratory markers (leukocyte count, relative number of neutrophils and C-reactive protein (CRP) levels) from n = 8 patients with acute bacterial infection. Gray boxes indicate normal range (NR) of the respective parameters, numbers indicate mean value. G/l, giga per liter. (B) Relative quantification of substate 1 neutrophils in controls versus patients with acute bacterial infection. Student’s t test, two-tailed, unpaired. (C) Volcano plot depicting significantly differentially regulated genes across neutrophils clusters (0, 1, 2, 3, and 9). (D) Heatmap depicting the differential gene expression in response to acute bacterial infection in patients with acute bacterial infection compared to controls. (E) Violin plots depicting gene expression levels for the indicated transcripts across conditions (control versus acute bacterial infection versus ischemic stroke). (F) Visualization of FlowSets gene flows showing increased (minimum medium level) expression in all neutrophil subsets between patients with bacterial infection (red) compared to both healthy controls (black) and patients with ischemic stroke (orange). The width of each flow relates to the sum of all gene memberships within the flow. (G) Bar graph depicting the 30 genes with highest membership within the selected flows shown in (F). (H) Dot plot depicting Gene Ontology (GO) term analysis of the gene memberships of the selected flows shown in (F). The size of the dot correlates with the pathway size. MHC, major histocompatibility complex. (I) Visualization of mean module score of module 5 (substate 9 neutrophils), showing up-regulation of a distinct gene set in response to acute bacterial infection. (J) Dot plot depicting differential expression of transcripts included in module 5 of substate 9 neutrophils across healthy controls and patients with infection and stroke. Unless indicated with asterisks, post hoc testing revealed nonsignificant results (P ≥ 0.05). P values corresponding to asterisks: **P < 0.01.
Fig. 3.
Fig. 3.. CD177 up-regulation at RNA and protein level following bacterial infection is conserved in mice and humans.
(A) Overview of individuals in the confirmation cohort. (B) t-Stochastic neighbor embedding (t-SNE) plot comprising n = 900,000 neutrophils from 45 individuals. (C) t-SNE plot depicting neutrophil populations identified by FlowSOM. Populations comprising less than 3500 cells (i.e., <4% of all clusters across individuals) were excluded from further analysis. (D) Relative abundancies of CD177high population 0 versus CD177low populations 3 and 5 in controls versus patients. Student’s t test, unpaired, two-tailed. (E) Quantification of CD177 MFI across neutrophil FC substates. Student’s t test, two-tailed, unpaired. (F) Correlation plot of SOFA scores and neutrophil surface markers. (G) Volcano plot depicting differentially expressed proteins as assessed by mass spectrometry (red, adj. P < 0.05). (H) Fold change of 20 most up-regulated proteins in infected patients. Bold font indicates that corresponding transcripts are also up-regulated at transcript level in response to acute bacterial infection. Log2FC, log2 fold change. (I) Linear regression analysis of differentially regulated gene products at both RNA and protein level. (J) Schematic overview of comparisons of the scRNA-seq data from this study with murine scRNA-seq study by Xie et al. (21). (K) Integrative scRNA-seq UMAP of mature murine (G5a, G5b, and G5c) and human neutrophil substates (hG5a, hG5b, and hG5c, from n = 3 healthy individuals) from Xie et al. (21) integrated with neutrophil substates 0, 1, 2, 3, and 9. Arrow thickness indicates similarity of neutrophil substates. (L) Heatmap indicating the overlap of substates 0, 1, 2, 3, and 9 with murine and human substates G5a-c by Xie et al. (21) (M) Violin plots of CD177 mRNA expression in response to acute bacterial infection in a mouse model of E. coli bacteremia. P values corresponding to asterisks: *P < 0.05, ***P < 0.005.
Fig. 4.
Fig. 4.. CD177 blockade increases bacterial dissemination through mitigating (trans)migratory capacity and phagocytic efficiency.
(A) Experimental scheme. (B) Quantification of CD177 MFI and % CD177hi neutrophils at 6 hours after LPS intraperitoneal (i.p.) injection. Right: Histograms of Ly6G and CD177 expression in neutrophils from NaCl- versus LPS-treated mice. (C) Longitudinal assessment of neutrophil surface markers relative to marker-specific maximal MFI. (D) Linear regression analysis of longitudinal sepsis scores and CD177 MFIs 0 to 4 hours after LPS intraperitoneal injection. (E) Quantification of transmigrated murine neutrophils in response to indicated stimuli. Two-way ANOVA with post hoc Dunnett’s testing. (F) Representative micrographs of neutrophils phagocytosing fluorescent E. coli. Scale bars, 10 μm (left) and 25 μm (right). Quantification of number of phagocytosed E. coli per neutrophils. Student’s t test, two-tailed, unpaired. See fig. S7F for FC-based quantification of phagocytosis. (G) Experimental scheme of murine bacteremia model through intravenous (i.v.) injection of live, green fluorescent protein–expressing E. coli. (H) Blood counts and neutrophil expression of select surface markers after 6 hours of incubation. Student’s t test, two-tailed, unpaired. PMN, Polymorphonuclear neutrophils. (I) Quantification of WBC, neutrophils/field of view (FOV) in the spleen, and CD177 MFI of splenic neutrophils as assessed by FC. (J) Representative confocal images of spleen sections. Scale bar, 100 μm. See fig. S8H for corresponding split channels. Quantification of neutrophils and E. coli per FOV. Student’s t test, two-tailed, unpaired. DAPI, 4′,6-diamidino-2-phenylindole. (K) Quantification of colony-forming units (CFUs) per gram of spleen. Student’s t test, two-tailed, unpaired. (L) Quantification of WBC, neutrophils/FOV in the liver, and CD177 MFI of hepatic neutrophils as assessed by FC. (M) Representative confocal images of liver sections. Scale bar, 100 μm. See fig. S8I for corresponding split channels. Quantification of neutrophils and E. coli per FOV. Student’s t test, two-tailed, unpaired. (N) Quantification of CFUs per gram of liver. Student’s t test, two-tailed, unpaired. P values corresponding to asterisks: *P < 0.05, **P < 0.01, ****P < 0.001.
Fig. 5.
Fig. 5.. CD177 blockade impairs neutrophil (trans)migration in vivo.
(A) Experimental scheme of confocal live microscopy following intravenous injection of E. coli bioparticles. (B) Representative rendered confocal images from in vivo microscopy as well as migration tracks (rainbow colors) for treatment groups. Scale bar, 50 μm. (C) Quantification of migration speed (μm/min) and meandering indices of neutrophils recruited to liver sinusoids. Student’s t test, two-tailed, unpaired. Cell-based analysis of 144 (IgG2a) and 202 (anti-CD177) individual neutrophils from n = 3 to 4 mice per group. (D) Representative bright-field (PH) images from detachment assays of IgG2a- or CD177-treated HoxB8-derived neutrophils treated with IgG2a (left) or anti-CD177 antibody (right) for 10 min before being perfused with increasing shear rates. (E) Quantification of attaching cells according to treatment and shear rate. Two-way ANOVA with post hoc Dunnett’s test. P values corresponding to asterisks: ****P < 0.001.
Fig. 6.
Fig. 6.. Peripheral priming in circulating neutrophils in vivo.
(A) Quantification of CD177 MFIs of peripheral blood or bone marrow neutrophils. (B) Analysis of CD177 MFIs on isolated BM (black, gray) or blood neutrophils (red, light red) following incubation with LPS (10 μg/ml) after treatment with IgG2a or anti-CD177 antibody (10 μg/ml). (C) Representative immunofluorescence images and relative quantification of banded cells after sorting human neutrophils according to their CD177 expression (CD177pos versus CD177neg). Top: Magnified example of banded cell. See fig. S11C for gating scheme. Scale bars, 20 μm. (D) Experimental scheme of neutrophil pulse labeling approach following LPS intraperitoneal injection. (E) Quantification of triple (FITC+, BV711+, and AF647+), double (BV711+ and AF647+), and single (AF647+) neutrophils of peripheral blood CD45+ cells. Right: Quantification of CD177 MFI of triple-, double-, and single-positive neutrophil isolated from peripheral blood or bone marrow (BM). Two-way ANOVA with Dunnett’s multiple comparisons test in (A), (B), and (E, right); one-way ANOVA Dunnett’s post hoc testing in (E, left); and Student’s t test, unpaired, two-tailed in (C). P values corresponding to asterisks: *P < 0.05, **P < 0.01, ****P < 0.001.
Fig. 7.
Fig. 7.. Peripheral priming of circulating neutrophils governs transcriptional changes and subsequent functional adaptations.
(A) Experimental scheme of adoptive transfer experiment: Isolated neutrophils (5 × 10⁶) from donor mice were fluorescently labeled, treated with either vehicle or actinomycin D (ActD; 1 μg/ml), and subsequently infused into acceptor mice treated with NaCl or LPS [1 mg/kg body weight (BW)]. (B) Quantification of CD177 MFI of circulating, sham- or ActD-treated neutrophils in NaCl- or LPS-treated animals. (C) Quantification of CD177 MFI of sham- or ActD-treated neutrophils in the lungs of NaCl- or LPS-treated animals. Right: Relative quantification of pulmonary neutrophil recruitment according to pretreatment. (D) Quantification of CD177 MFI of sham- or ActD-treated neutrophils in the livers of NaCl- or LPS-treated animals. Right: Relative quantification of hepatic neutrophil recruitment according to pretreatment. (E) Experimental scheme of in vitro incubation of murine neutrophils with septic plasma in the presence or absence of ActD and subsequent bulk RNA-seq. (F) Heatmap of top differentially expressed genes sorted by adjusted P value (<0.05). n = 4 independent biological replicates were incubated with plasma samples from n = 4 independent LPS-treated mice. (G) Gene set enrichment analysis showing Top 20 up-regulated biological processes in sham- versus ActD-exposed neutrophils in response to septic plasma. (H) Experimental scheme of in vitro stimulation of healthy neutrophils with patient plasma after indicated pretreatment. (I) Quantification of CD177 and CD11b MFI. MFIs were normalized to neutrophils treated with phosphate-buffered saline due to interindividual baseline variance of CD177 expression. (J) Linear regression analyses of inflammation-associated FlowSet genes (see Fig. 3, F to H) and neutrophil CXCR2, CXCR4, SELL, and MME gene expression. Two-way ANOVA with Dunnett’s multiple comparisons test in (B) to (E) and one-way ANOVA Dunnett’s post hoc testing in (I). P values corresponding to asterisks: *P < 0.05, **P < 0.01, ***P < 0.005, and ****P < 0.001.
Fig. 8.
Fig. 8.. Graphical summary.
Multidimensional profiling of human neutrophils in health and disease reveals neutrophil plasticity at transcript and protein level upon bacterial infection. This plasticity is induced through (1) TLR4/NF-κB–mediated peripheral priming of circulating neutrophils, leading to (2) differential transcript expression and subsequent (3) up-regulation of antimicrobial effector molecules at protein level. This altered gene and protein expression (4) affects functional phenotypes of circulating neutrophils and (5) contributes to neutrophil effector functions to limit bacterial dissemination. Figure created with Biorender.com.

References

    1. Ley K., Hoffman H. M., Kubes P., Cassatella M. A., Zychlinsky A., Hedrick C. C., Catz S. D., Neutrophils: New insights and open questions. Sci. Immunol. 3, eaat4579 (2018). - PubMed
    1. Margraf A., Lowell C. A., Zarbock A., Neutrophils in acute inflammation: Current concepts and translational implications. Blood 139, 2130–2144 (2022). - PMC - PubMed
    1. Kolaczkowska E., Kubes P., Neutrophil recruitment and function in health and inflammation. Nat. Rev. Immunol. 13, 159–175 (2013). - PubMed
    1. Silvestre-Roig C., Fridlender Z. G., Glogauer M., Scapini P., Neutrophil diversity in health and disease. Trends Immunol. 40, 565–583 (2019). - PMC - PubMed
    1. Skokowa J., Dale D. C., Touw I. P., Zeidler C., Welte K., Severe congenital neutropenias. Nat. Rev. Dis. Primers. 3, 17032 (2017). - PMC - PubMed

Publication types