. 2024 May 13;42(5):780-796.e6.
doi: 10.1016/j.ccell.2024.03.001. Epub 2024 Mar 21.

Clinical drug screening reveals clofazimine potentiates the efficacy while reducing the toxicity of anti-PD-1 and CTLA-4 immunotherapy

Affiliations

Clinical drug screening reveals clofazimine potentiates the efficacy while reducing the toxicity of anti-PD-1 and CTLA-4 immunotherapy

Gang Xue et al. Cancer Cell. .

Abstract

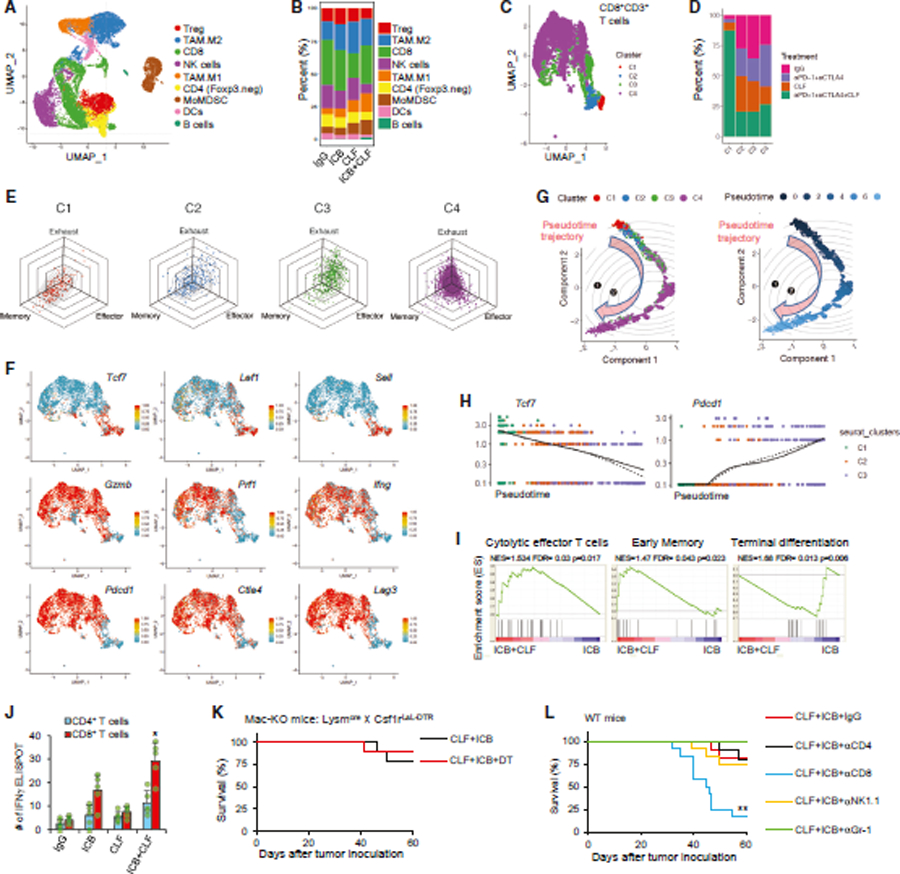
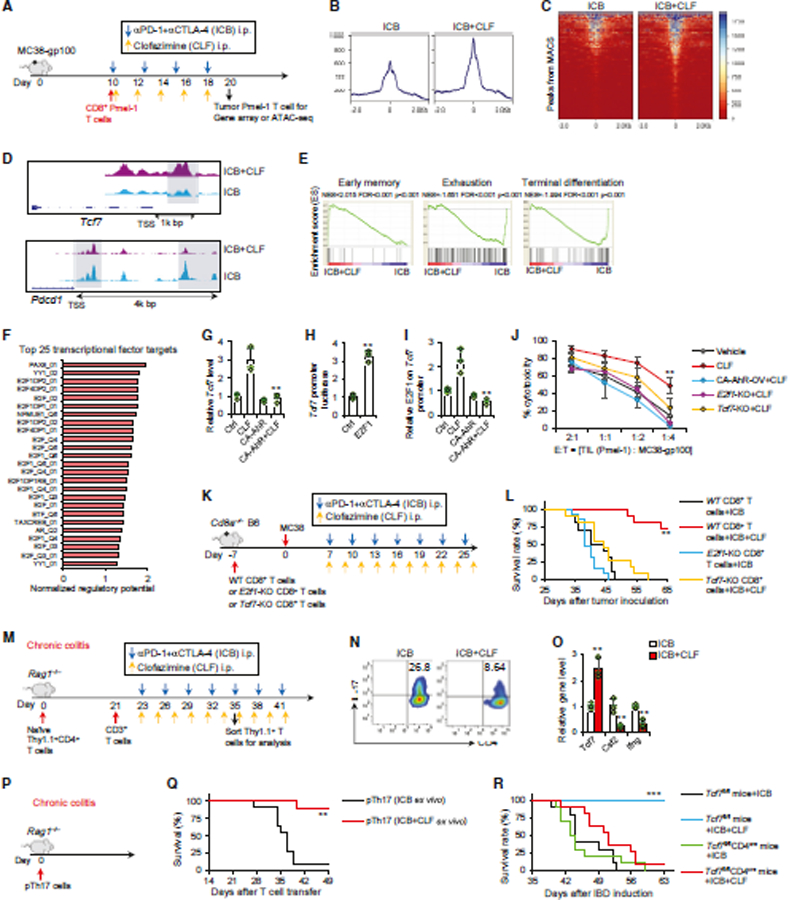
Emerging as the most potent and durable combinational immunotherapy, dual anti-PD-1 and CTLA-4 immune checkpoint blockade (ICB) therapy notoriously increases grade 3-5 immune-related adverse events (irAEs) in patients. Accordingly, attempts to improve the antitumor potency of anti-PD-1+CTLA-4 ICB by including additional therapeutics have been largely discouraged due to concerns of further increasing fatal toxicity. Here, we screened ∼3,000 Food and Drug Administration (FDA)-approved drugs and identified clofazimine as a potential third agent to optimize anti-PD-1+CTLA-4 ICB. Remarkably, clofazimine outperforms ICB dose reduction or steroid treatment in reversing lethality of irAEs, but unlike the detrimental effect of steroids on antitumor efficacy, clofazimine potentiates curative responses in anti-PD-1+CTLA-4 ICB. Mechanistically, clofazimine promotes E2F1 activation in CD8+ T cells to overcome resistance and counteracts pathogenic Th17 cells to abolish irAEs. Collectively, clofazimine potentiates the antitumor efficacy of anti-PD-1+CTLA-4 ICB, curbs intractable irAEs, and may fill a desperate clinical need to improve patient survival.


Conflict of interest statement

Declaration of interests The authors declare no competing financial interests.

Figures

Figure 1.
Figure 1.. Identification that clofazimine (CLF) sustains anti-PD-1+CTLA-4 ICB activity
(A) Diagram of the generation of organotypic tumor spheroids OTSs. (B) Plot of replicate Z scores from the screening of FDA-approved drugs capable of enhancing anti-PD-1+anti-CTLA-4 (hereon ICB) antitumor ability. Percentage of tumor killing was normalized and converted to Z scores. (C) Plot of replicate Z scores from the screening of FDA-approved anti-inflammatory drugs. (D) Luciferase total flux (p/s = photons/second) of OTSs was measured (n = 5–6). (E) Diagram of generating human OTS. (F and G) Human melanoma OTSs were treated ex vivo. ICB = Nivo+Ipi (Selleckchem, research grade, 10 μg/mL each); CLF 1 μM. Cell death was tested by ViaStain AOPI Staining Solution. Representative data (F) and summarized results (G) are shown. (H) Treatments diagram for MC38 model. Mice were s.c. inoculated with 1 × 10⁶ MC38 cells. Antibodies were injected at 100 μg each and CLF was injected at 8 mg/kg for each dose. Mice may receive a maximum of 8 doses of ICB or 12 doses of CLF as long as they are still alive. Red arrows indicate treatment initiation. (I and J) MC38 tumor growth curves (I, n = 5 mice/group) and survival (J, n = 9–12 mice/group from 2 independent experiments). (K) Treatment diagram for D4M.3A model. Mice were s.c. inoculated with 2×10⁵ D4M.3A cells. (L and M) D4M.3A tumor growth curves (L, n = 5 mice/group) and survival (M, n = 10–12 mice/group from 2 independent experiments). (N) Treatment diagram for A20 model. Mice were s.c. inoculated with 5 × 10⁶ A20 cells. (O and P) A20 tumor growth curves (O, n = 5 mice/group) and survival (P, n = 10–12 mice/group from 2 independent experiments). (Q) Treatment diagram for B6 mice inoculated with 0.5×10⁶ LL/2Luc+ lung cancer cells (orthotopic inoculation). (R) Tumor burden in lung was measured by in vivo bioluminescence imaging. Representative images are shown. (S) Summarized lung weights of mice on day 25 are shown (n = 5–6 mice/group). (T) Survival curves (n = 10–11 mice per group from 2 independent experiments). Data are mean ± SD. **p < 0.01, ***p < 0.001, compared with any other groups, one-way ANOVA with Tukey’s correction. **p < 0.01, compared with any other groups, survival analysis was conducted using log rank test with Holm test for multiple comparisons. See also Figure S1 and Table S1.
Figure 2.
Figure 2.. CLF decouples the efficacy from irAEs toxicities in anti-PD-1/CTLA-4 immunotherapy
(A–E) Acute colitis model in MC38 tumor-bearing mice. (A) Treatment diagram for MC38 tumor-bearing B6 mice induced with acute colitis. MC38 cells (1×10⁶) were s.c. injected into B6 mice. (B) Tumor growth curves (n = 5 mice/group). (C) Normalized follow-up of body weight (n = 5/group). (D and E) Representative images from H&E-stained sections of the colon on day 7 (D) and histological colon inflammation scores (E) are shown. (F–H) Chronic colitis model. (F) Treatment diagram for Rag1−/−mice induced with chronic colitis. Rag1−/− mice were transferred with 1×10⁶ naive CD4+CD45RBhi T cells and 2×10⁷ CD3+ T cells on days 0 and 21, respectively. (G) Normalized follow-up of body weight (n = 5/group). (H) Survival curves of treated mice (n = 10–12 mice/group summarized from 2 independent experiments). (I and J) Neurotoxicity model. (I) Diagram of the treatments for BALB/c mice induced with EAE by s.c. SCH/CFA. (J) Neurological clinical score curves are shown (n = 5/group). (K–M) Neurotoxicity model in mice bearing A20 tumors. (K) Treatment diagram for A20-bearing BALB/c mice induced with EAE. (L) Survival curves (n = 8–13 mice/group from 2 independent experiments). (M) Percentage of mortality types are shown for (L). Data are mean ± SD. **p < 0.01, ***p < 0.001, compared with IgG or ICB group, one-way ANOVA with Tukey’s correction. **p < 0.01, compared with IgG group or ICB group. Survival analysis was conducted using log rank test with Holm test for multiple comparisons. See also Figure S2 and Table S2.
Figure 3.
Figure 3.. CLF outperforms other commonly used strategies for irAEs reduction
(A–D) Neurotoxicity model for anti-CTLA4 dose-reduction strategy. (A) Treatment diagram for A20-bearing BALB/c mice induced with EAE by s.c. SCH/CFA. (B and C) Survival curves (n = 8–14 mice/group from 2 independent experiments). (D) Percentage of mortality types are shown for (C). (E–H) Neurotoxicity model for steroid strategy. (E) Diagram of the treatments for A20-bearing BALB/c mice induced with or without EAE. (F and G) Survival curves (n = 8–12 mice/group from 2 independent experiments). (H) Percentage of mortality types are shown for (G). **p < 0.01, ***p < 0.001, compared with other groups. Survival analysis was conducted using log rank test with Holm test for multiple comparisons. See also Tables S3 and S4.
Figure 4.
Figure 4.. CLF mitigates cardiac irAEs exacerbated by anti-PD-1+CTLA-4 ICB
(A–G) Myocarditis model in mice. (A) Treatment diagram for A/J mice induced with autoimmune myocarditis by s.c. cardiac Tnl peptide/CFA injection. (B) Survival curves (n = 11–13 mice per group from 2 independent experiments). (C and D) Representative images from H&E-stained sections of the heart (C) and cardiac pathology scores (D) are shown. (E) # of heat infiltrating immune cells are shown. (F) Representative echocardiograms (day 20). (G) Quantification of cardiac properties and output. LVEF, left ventricular ejection fraction; FS (%), percentage fractional shortening; LVPWd and LVPWs, Left ventricular posterior wall end diastole and end systole; LVAWd, left ventricular end-diastolic anterior wall thickness; LVAWs, left ventricular end-systolic anterior wall thickness. (H–K) Myocarditis model in mice with lung carcinoma. (H) Diagram of the treatments for lung carcinoma (transplantable spontaneous lung carcinoma)-bearing A/J mice induced with ICB-myocarditis. (I) Survival curves (n = 11–14 mice/group from 3 independent experiments). (J and K) # of immune cells on day 28 (n = 5–6). (L) Pdcd1−/−;Ctla4+/− mice were treated starting on day 21 with CLF (8 mg/kg; every 2 days) or MPred (40 mg/kg; every 2 days). Survival curves (n = 22–26 mice/group from 3 independent experiments). Data are mean ± SD. *p < 0.05, **p < 0.01, ***p < 0.001, compared with ICB group, one-way ANOVA with Tukey’s correction. *p < 0.05, **p < 0.01, compared with ICB group, survival analysis was conducted using log rank test with Holm test for multiple comparisons.
Figure 5.
Figure 5.. CLF promotes superior CD8+ CTL responses during anti-PD-1+anti-CTLA-4 immunotherapy
(A) MC38-bearing B6 mice were treated similarly to Figure 1H. UMAP plots of single-cell transcriptomic profiles of tumor-infiltrated immune cells isolated 9 days after in vivo treatment started. (B) The percentage of immune cells is shown. (C and D) UMAP plots of tumor-infiltrating CD8+ T cells (C) and the percentage of CD8+ T cell clusters (D) are shown. (E) Debratu analysis of 4 different clusters of tumor-infiltrating CD8+ T cells. (F) Single-cell expression of key marker genes over the UMAP representation of the map. (G) Branched pseudotime trajectory, each cell is colored by its cluster label (left panel) or its pseudotime value (right panel), as determined in (C). (H) Indicated key gene expression levels that changed over pseudotime trajectory are shown as dot plots representing C1, C2, and C3 clusters of tumor-infiltrating CD8+ T cells. (I) T cell feature signatures of C4_CD8+ T cells analyzed by GSEA. (J) # of IFN-γ ELISPOT of tumor-infiltrating T cells isolated from 200 mg tumor tissues of MC38-bearing B6 mice 9 days after treatment similar to Figure 1H. (K and L) MC38-bearing B6 mice were treated similarly to Figure 1H. Survival curves (n = 7–13 mice/group from 2 independent experiments). Mac-KO: macrophage-depleted mice. Data are mean ± SD. *p < 0.05, compared with other groups, one-way ANOVA with Tukey’s correction. **p < 0.01, compared with other groups, survival analysis was conducted using log rank test with Holm test for multiple comparisons.
Figure 6.
Figure 6.. CLF induces E2F1 pathway activation to potentiate CTL responses and diminish irAEs
(A–J) Effect of CLF on tumor-specific CD8+ T cells. (A) Treatment diagram for MC38-gp100 tumor-bearing B6 mice transferred with 2×10⁶ naive Thy1.1+CD8+ Pmel-1 T cells. (B–D) ATAC-seq analysis of tumor-infiltrating Thy1.1+CD8+ Pmel-1 T cells for global chromatin accessibility (B and C) or chromatin accessibility on the promoter of Tcf7 and Pdcd1 genes (D). (E) Gene signature of tumor-infiltrating Thy1.1+CD8+ Pmel-1 T cells by GSEA. (F) Top 25 enriched transcriptional factors in tumor-infiltrating Thy1.1+CD8+ Pmel-1 T cells. (G) 2×10⁶ control retrovirus or CA-AhR expression retrovirus-transduced Thy1.1+CD8+ Pmel-1 T cells were transferred to MC38-gp100 tumor-bearing B6 mice followed by ICB treatments as in Figure 6A. RT-PCR analysis of Tcf7 gene expression in tumor-infiltrating Thy1.1+CD8+ Pmel-1 T cells on day 20 (n = 3/group). (H) Luciferase reporter assay for the activation of Tcf7 promoter in 293 T cells (n = 3/group). (I) ChIP analysis of the binding of E2F1 at Tcf7 promoter in tumor-infiltrating Thy1.1+CD8+ Pmel-1 T cells treated as Figure 6A (n = 3/group). (J) Indicated modified Thy1.1+CD8+ Pmel-1 T cells were transferred into MC38-gp100 tumor-bearing B6 mice similar to Figure 6A. Tumor-infiltrating CD8+ Pmel-1 T cells were isolated on day 20 for ex vivo cytotoxicity. (K) Cd8a-KO mice (MC38 tumor) were reconstituted i.v. with 2×10⁷ indicated CD8+ T cells. (L) Survival is shown (n = 10–11 mice per group). (M) Treatment diagram for Rag1−/− mice induced with chronic colitis. (N) IL-17-producing Thy1.1+CD4+ T cells were analyzed by FACS. (O) Isolated Thy1.1+CD4+ T cells were further enriched for IL-17+ cells by a mouse IL-17 secretion cell enrichment kit, followed by RT-RCR analysis of gene expression in IL-17+CD4+ T cells (n = 3/group). (P) Diagram of the treatments for Rag1−/− mice induced with chronic colitis. (Q) Survival is shown (n = 10 mice/group from 2 independent experiments). (R) Mice were induced with chronic colitis as Figure 6M. Survival curves (n = 9–12 mice per group). Data are mean ± SD **p < 0.01, compared with control group (H), Student’s t tests. **p < 0.01, compared with CLF group (G–I); other groups (J), one-way ANOVA with Tukey’s correction. *p < 0.05, **p < 0.01, compared with other groups, survival analysis was conducted using log rank test with Holm test for multiple comparisons. See also Figures S3–S5.
Figure 7.
Figure 7.. CLF ameliorates toxicity of Nivo+Ipi in humanized NSG mice
(A–E) PBMC transfer-induced colitis in NSG mice. (A) Diagram of the treatments in tumor-free PBMC humanized NSG.A2 mice by i.v. injection with 1×10⁷ HLA-A2+ PBMC (health-donor). (B) Normalized follow-up of body weight (n = 5). (C) Colon length is shown on day 28 (n = 5). (D) # of colon-infiltrating immune cells (n = 5–6). (E) Survival curves (n = 9–12 mice per group from 2 independent studies). (F) Treatment diagram for autologous PBMC (1×10⁷) humanized DKO-NSG mice bearing s.c. melanoma PDX. 100 μg Nivo+100 μg Ipi; CLF 8 mg/kg. (G) Tumor growth curves (n = 5/group). (H) # of IFN-γ ELISPOT of PDX-infiltrating T cells isolated from 200 μg tumor tissues 32 days after treatment. (I) Treatment diagram for PDX-bearing NSG mice receiving autologous MART-1 T cells. (J) Survival serves (n = 5–6 mice per group). (K) Tumor-infiltrating CD8+ MART-1 T cells were isolated for ex vivo cytotoxicity. (L) DKO-NSG mice were intracranially inoculated with 1×10⁵ melanoma PDX cells, transfer with autologous 1×10⁷ PBMCs on day 1, and treated started on day 7 with 100 μg Nivo+100 μg Ipi; CLF 8 mg/kg similar to Figure 7I. Survival curves (n = 5–6 mice per group). Data are mean ± SD *p < 0.05, **p < 0.01, compared with ICB group (C, D, H); other groups (G, K), one-way ANOVA with Tukey’s correction. **p < 0.01, compared with ICB group, survival analysis was conducted using log rank test with Holm test for multiple comparisons. See also Figures S6.

References

    1. Gao X, and McDermott DF (2018). Ipilimumab in combination with nivolumab for the treatment of renal cell carcinoma. Expet Opin. Biol. Ther 18, 947–957. 10.1080/14712598.2018.1513485. - DOI - PMC - PubMed
    1. Rotte A (2019). Combination of CTLA-4 and PD-1 blockers for treatment of cancer. J. Exp. Clin. Cancer Res 38, 1–12. 10.1186/s13046-019-1259-z. - DOI - PMC - PubMed
    1. Hao C, Tian J, Liu H, Li F, Niu H, and Zhu B (2017). Efficacy and safety of anti-PD-1 and anti-PD-1 combined with anti-CTLA-4 immunotherapy to advanced melanoma. Medicine 96. 10.1097/md.0000000000007325. - DOI - PMC - PubMed
    1. Vellanki PJ, Mulkey F, Jaigirdar AA, Rodriguez L, Xu Y, Zhao H, Liu J, Howe G, Wang J, et al. (2021). FDA approval summary: Nivolumab with ipilimumab and chemotherapy for metastatic non–small cell lung cancer, A collaborative project orbis review. Clin. Cancer Res 27, 3522–3527. 10.1158/1078-0432.CCR-20-4338. - DOI - PMC - PubMed
    1. Saung MT, Pelosof L, Casak S, Donoghue M, Lemery S, Yuan M, Rodriguez L, Schotland P, Chuk M, Davis G, et al. (2021). FDA Approval Summary: Nivolumab Plus Ipilimumab for the Treatment of Patients with Hepatocellular Carcinoma Previously Treated with Sorafenib. Oncologist 26, 797–806. 10.1002/onco.13819. - DOI - PMC - PubMed

MeSH terms