. 2024 Apr 22;34(8):1646-1656.e4.
doi: 10.1016/j.cub.2024.02.074. Epub 2024 Mar 21.

A brainstem to hypothalamic arcuate nucleus GABAergic circuit drives feeding

Affiliations

A brainstem to hypothalamic arcuate nucleus GABAergic circuit drives feeding

Pablo B Martinez de Morentin et al. Curr Biol. .

Abstract

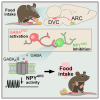
The obesity epidemic is principally driven by the consumption of more calories than the body requires. It is therefore essential that the mechanisms underpinning feeding behavior are defined. Neurons within the brainstem dorsal vagal complex (DVC) receive direct information from the digestive system and project to second-order regions in the brain to regulate food intake. Although γ-aminobutyric acid is expressed in the DVC (GABADVC), its function in this region has not been defined. In order to discover the unique gene expression signature of GABADVC cells, we used single-nucleus RNA sequencing (Nuc-seq), and this revealed 19 separate clusters. We next probed the function of GABADVC cells and discovered that the selective activation of GABADVC neurons significantly controls food intake and body weight. Optogenetic interrogation of GABADVC circuitry identified GABADVC → hypothalamic arcuate nucleus (ARC) projections as appetite suppressive without creating aversion. Electrophysiological analysis revealed that GABADVC → ARC stimulation inhibits hunger-promoting neuropeptide Y (NPY) neurons via GABA release. Adopting an intersectional genetics strategy, we clarify that the GABADVC → ARC circuit curbs food intake. These data identify GABADVC as a new modulator of feeding behavior and body weight and a controller of orexigenic NPY neuron activity, thereby providing insight into the neural underpinnings of obesity.

Keywords: body weight; dorsal vagal complex; food intake; gamma-aminobutyric acid; hunger; hypothalamus; neuropeptide Y; nucleus of the solitary tract; obesity.


Conflict of interest statement

Declaration of interests The authors declare no competing financial interests.

Figures
Graphical abstract
Graphical abstract
Figure 1
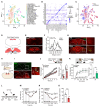
Figure 1. GABADVC activation reduces food intake and body weight
(A) tSNE plot of Slc32a1+ neurons in the DVC colored by cluster. (B) Dot plot showing scaled expression of marker genes for each of the 19 Slc32a1+ clusters. (C) tSNE plot of the Slc32a1+ nuclei colored by nutritional status. (D) Schematic of the DVC with diagram showing AP, NTS, and DMV subregions. (E) Representative photomicrograph (scale bars, 500 μm) of GABAergic cell distribution in the medial brainstem (top) and in the DVC (bottom) using VgatCre:tdTom mice. (F) Quantification of GABAergic cells expressing c-Fos following 16 h fasting and fasting + 2 h refeeding (n = 3, two-way ANOVA, bregma level: F(13,34) = 2.63; p = 0.012; nutritional state: F(1,4) = 8.69; p = 0.042). (G) Representative micrograph (scale bars, 200 μm) of VgattdTom cells (red) expressing c-Fos (green) in mice fasted 16 h (top) and re-fed for 2 h (bottom) and magnifications (scale bars, 100 μm). (H) Schematic of AAV-DIO-hM3Dq/hM4Di/mCherry (see STAR Methods viral vectors) infused into NTS of VgatCre mice. (I) Representative photomicrograph, right, (scale bars, 200 μm) of c-Fos (green) expression in GABADVC:hM3Dq-mCherry (red)-expressing cells in the NTS of VgatCre mice treated with clozapine-n-oxide (CNO, 1 mg/kg intraperitoneally [i.p.]) and magnification, left (scale bar, 100 μm). White arrows indicate double labelled cells. (J) 6 h cumulative (left) and 2 h and 6 h total (right) food intake (n = 6, t(11) = 2.663, and p =0.0238) in GABADVC:hM3Dq CNO-injected mice compared with GABADVC:mCherry. (K) 2 h cumulative and (J) 2 h total food intake (n = 5, t(8) = 3.205, and p = 0.0125) in GABADVC:hM4Di CNO-injected mice compared with GABADVC:mCherry mice. (L–O) (L) 10-day treatment protocol schematic. Twice-daily CNO treatment significantly reduced (M) food intake (RM two-way ANOVA F(1,11) = 20.57; p = 0.0008), (N) body weight (RM two-way ANOVA (F(1,11) = 21.96; p = 0.0007), and (O) body weight change in GABADVC:hM3Dq mice compared with control GABADVC:mCherry mice (t(11) = 5.252, p = 0.0003). (C and D) n = 4/group, (H–K) n = 6, (M–O) n = 6 GABADVC:mCherry and n = 7 GABADVC:hM3Dq. Data are represented as mean ± SEM. *p < 0.05, **p < 0.01, and ***p < 0.001. AP, area postrema; CC, center canal; DMV, dorsal motor nucleus of the vagus; NTS, nucleus of the solitary tract; tSNE, t-distributed stochastic neighbor embedding. See also Figure S1 and Data S1 and S2 for more information.
Figure 2
Figure 2. GABADVC projections to the ARC release GABA at NPYARC neurons
(A and B) (A) Illustration depicting DVC injection of AAV2-EF1a-DIO-ChR2(E123T/T159C)-mCherry (top) and representative photomicrograph (scale bars, 1 mm) of injection (bottom) in VgatCre mice and (B) ChR2-mCherry-containing fibers in the ARC (scale bars, 200 μm). (C and D) (C) Representative photomicrograph (scale bars, 100 μm) and magnifications (scale bars, 50 and 10 μm) of ChR2-mCherry fibers in the ARC close to NPYhrGFP-expressing cells but not (D) POMC-expressing cells in VgatCre mice bilaterally injected with AAV-DIO-ChR2-mCherry. (E–J) CRACM study in VgatCre::NpyhrGFP and VgatCre::PomcDsRed mice injected with AAV-DIO-ChR2-mCherry into the DVC. (E) Representative membrane potential response of NPYhrGFP and POMCDsRed cells after light stimulation (blue shading) of GABADVC → ARC mCherry-containing terminals. 4/27 NPYhrGFP cells and 0/19 cells POMCDsRed cells responded. (F) Representative membrane current in NPYhrGFP cell recorded during a voltage clamp experiment from –100 mV to –10 mV in 10-mV steps. (vertical line, light pulse; green cross, base line; red cross, peak value.) (G) Representative light-induced postsynaptic current during voltage clamp experiment showing peak conductance, Gs, and reversal potential, Erev. (H) Individual values and median of (H) Erev, (I) conductance, Gs and (J) latency of all responsive cells. (K) Diagram of outside-out patch technique in VgatCre:NpyhrGFP mice bilaterally injected with AAV-DIO-ChR2-mCherry into the DVC. (L) Representative channel opening recordings of control (left), gabazine (middle), and washout (right) recordings. (M) Quantification of receptor opening time (n = 4, RM two-way ANOVA F(2,6) = 16.14; p = 0.0039, Bonferroni adjusted p = 0.0051 control vs. gabazine and p = 0.0156 gabazine vs. washout. Data in (M) are expressed as mean ± SEM. *p < 0.05; **p < 0.01. See also Figure S2.
Figure 3
Figure 3. Activation of GABADVC → ARC projections reduce food intake without inducing aversion
(A) Schematic of DVC injection of AAV2-EF1a-DIO-ChR2(E123T/T159C)-mCherry in VgatCre mice and optic fiber placement for in vivo stimulation of GABANTS → ARC terminals. (B) Protocol of stimulation. (C–E) (C) Representative 1 min resolution time plot of 3 h food intake measurement. GABADVC → ARC stimulation significantly reduces (D) cumulative 3 h food intake and (E) 60 min food intake (n = 7, day 1 [OFF] vs. day 2 [ON] t test t(6) = 3.035, p = 0.0229 and day 2 [ON] vs. day 3 [OFF] t(6) = 3.283, p = 0.0168). (F–H) (F) Diagram illustrating real-time place preference (RTPP) task. GABADVC → ARC does not alter (G) time spent (representative heat map of time) or (H) distance traveled in stimulated and non-stimulated zones. (I) Diagram illustrating an object interaction task. (J) Interactions with novel, known nutritional, or novel palatable objects and a representative path track around each object (red circle). GABADVC → ARC stimulation reduced interaction with known nutritional item (n = 6, t(5) = 3.043, and p = 0.0287). Data are expressed as individual values and as mean ± SEM, n = 6 mice. *p < 0.05. See also Figure S3.
Figure 4
Figure 4. Selective chemogenetic activation of GABADVC → ARC neurons supresses feeding
(A) Diagram illustrating the two-virus intersectional strategy to express hM3Dq only in GABADVC neurons projecting to the ARC (GABADVC → ARC:hM3Dq mice). Representative photomicrograph (scale bars, 500 and 50 μm) depicting mCherry-expressing cells in the caudal NTS (red), c-Fos (green), and co-labeled (yellow) following treatment with clozapine-n-oxide (CNO, 1 mg/kg i.p.). (B and C) (B) CNO significantly reduced cumulative food intake over 6 h (0–6 h F(1,15) = 7.418, p = 0.0157), (C) 1 h (t(15) = 2.648, p = 0.0183), and 3 h (t(15) = 2.568, p = 0.0214) compared with saline in GABADVC → ARC:hM3Dq mice. (D–K) (D) CNO did not alter 12 h or (E) 1, 3, 6, or 12 h quantification of ambulation; (F) 12 h RER or (G) AUC quantification; (H) 12 h or (I) 1, 3, 6, and 12 h heat production per mouse compared with saline in GABADVC → ARC:hM3Dq mice. (J and K) CNO significantly reduced 3 h food intake following overnight fasting compared with control saline treatment (J, two-way ANOVA F(1.13) = 6.139, p = 0.0277; and K, t(13) = 2.320, p = 0.0372) in GABADVC → ARC:hM3Dq mice. (L and M) CNO attenuated ghrelin hyperphagia over 2 h (RM ANOVA F(3,16) = 11.12, p = 0.0003, Bonferroni adjusted p = 0.0042 control vs. ghrelin, p = 0.0003 CNO vs. ghrelin, and p = 0.002 ghrelin vs. ghrelin+CNO) in GABADVC → ARC:hM3Dq mice. (N–P) (N) CNO reduced meal size (t(14) = 2.256, p = 0.0406) and (O–P) decreased meal number (t(14) = 2.824, p = 0.0135) compared with control saline treatment. Data are expressed as individual values and as mean ± SEM. *p < 0.05; **p < 0.01, ***p < 0.001.

References

    1. Andermann ML, Lowell BB. Toward a Wiring Diagram Understanding of Appetite Control. Neuron. 2017;95:757–778. doi: 10.1016/j.neuron.2017.06.014. - DOI - PMC - PubMed
    1. Campos A, Port JD, Acosta A. MDPI; 2022. Integrative Hedonic and Homeostatic Food Intake Regulation by the Central Nervous System: Insights from Neuroimaging. Preprint at. - DOI - PMC - PubMed
    1. Hyun U, Sohn JW. Autonomic control of energy balance and glucose homeostasis. Exp Mol Med. 2022;54:370–376. doi: 10.1038/s12276-021-00705-9. - DOI - PMC - PubMed
    1. Dowsett GKC, Lam BYH, Tadross JA, Cimino I, Rimmington D, Coll AP, Polex-Wolf J, Knudsen LB, Pyke C, Yeo GSH. A survey of the mouse hindbrain in the fed and fasted states using single-nucleus RNA sequencing. Mol Metab. 2021;53:101240. doi: 10.1016/j.molmet.2021.101240. - DOI - PMC - PubMed
    1. Grill HJ, Hayes MR. Hindbrain Neurons as an Essential Hub in the Neuroanatomically Distributed Control of Energy Balance. Cell Metab. 2012;16:296–309. doi: 10.1016/j.cmet.2012.06.015. - DOI - PMC - PubMed

Publication types

Substances

LinkOut - more resources