. 2024 Mar 22;15(1):2216.
doi: 10.1038/s41467-024-46454-x.

Molecular basis promoting centriole triplet microtubule assembly

Affiliations

Molecular basis promoting centriole triplet microtubule assembly

Yutaka Takeda et al. Nat Commun. .

Abstract

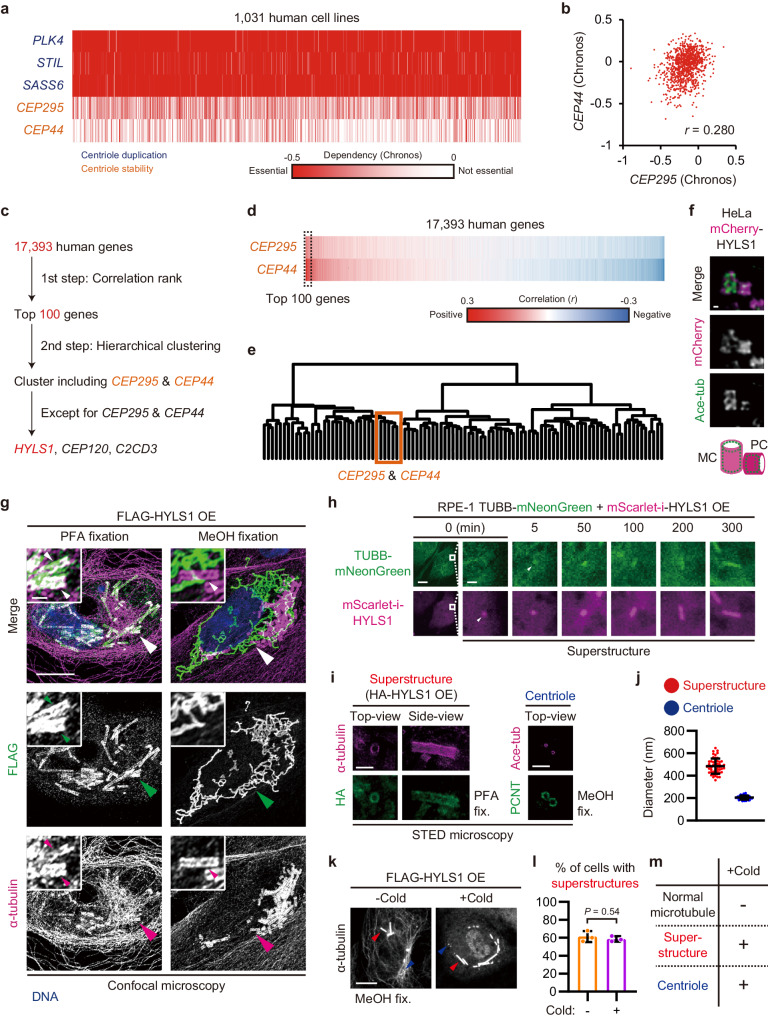
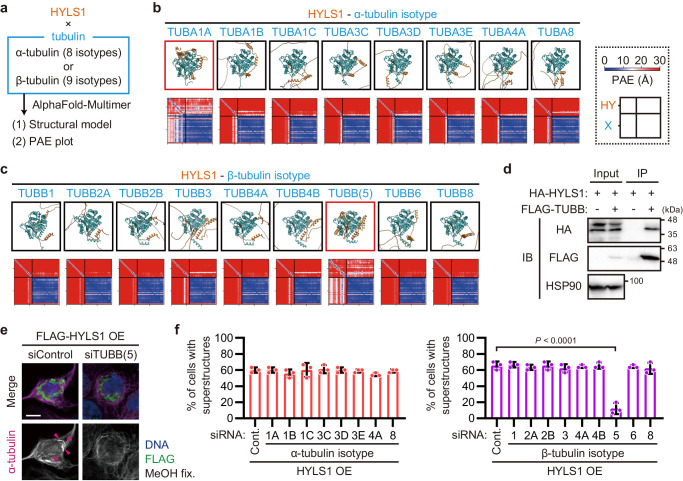
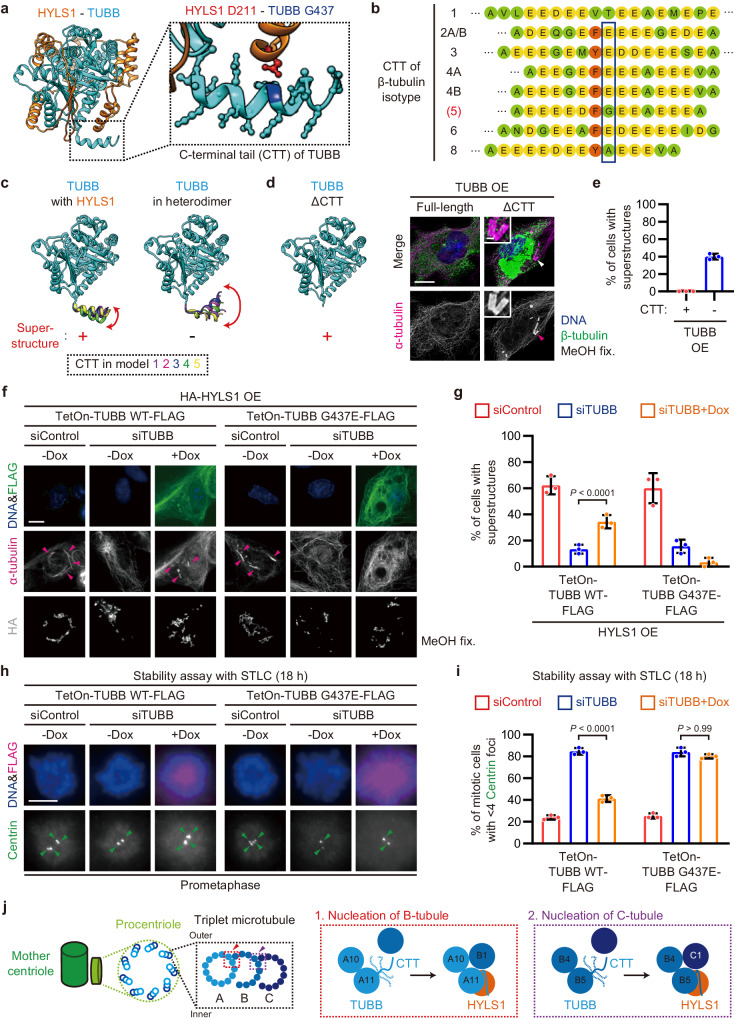
The triplet microtubule, a core structure of centrioles crucial for the organization of centrosomes, cilia, and flagella, consists of unclosed incomplete microtubules. The mechanisms of its assembly represent a fundamental open question in biology. Here, we discover that the ciliopathy protein HYLS1 and the β-tubulin isotype TUBB promote centriole triplet microtubule assembly. HYLS1 or a C-terminal tail truncated version of TUBB generates tubulin-based superstructures composed of centriole-like incomplete microtubule chains when overexpressed in human cells. AlphaFold-based structural models and mutagenesis analyses further suggest that the ciliopathy-related residue D211 of HYLS1 physically traps the wobbling C-terminal tail of TUBB, thereby suppressing its inhibitory role in the initiation of the incomplete microtubule assembly. Overall, our findings provide molecular insights into the biogenesis of atypical microtubule architectures conserved for over a billion years.


Conflict of interest statement

The authors declare no competing interests.

Figures

Fig. 1
Fig. 1. Overexpression of the ciliopathy protein HYLS1 leads to assembly of tubulin-based superstructures with high stability similar to that of centrioles.
a Heatmap of Chronos scores of the indicated genes for 1031 human cell lines. b Scatter plots of Chronos scores of CEP295 and CEP44. c Schematic of the two-step screening. d Heatmap of correlation coefficients between Chronos scores of the indicated genes and those of 17,393 human genes. The genes were sorted in order of mean values. e Hierarchical clustering analysis of the top 100 hits using their Chronos scores. The cluster enclosed by orange rectangle included CEP295, CEP44, CEP120, C2CD3, and HYLS1. f STED microscopy images of HeLa mCherry-HYLS1 knock-in cells. Scale bar: 100 nm. MC: mother centriole, PC: procentriole. Ace-tub: acetylated tubulin. g Confocal microscopy images of RPE-1 cells transfected with pCMV-FLAG-HYLS1 and fixed with the indicated methods. Scale bars: 10 μm and 1 μm. Large arrowheads: magnified areas, small arrowheads: superstructures. h Time-lapse images of RPE-1 cells stably expressing TUBB-mNeonGreen transfected with pCMV-mScarlet-i-HYLS1. Scale bars: 10 μm and 1 μm. Arrowheads: first confirmed accumulations. i STED microscopy images of the tubulin-based superstructures in RPE-1 cells transfected with pCMV-HA-HYLS1 and centrioles in RPE-1 cells. Scale bars: 1 μm. Ace-tub: acetylated tubulin. j Quantification of diameter of the tubulin-based superstructures and the centrioles in (i). n = 50 structures. k IF images of RPE-1 cells transfected with pCMV-FLAG-HYLS1 and then incubated on ice for 1 h before fixation. Scale bar: 10 μm. Red arrowheads: superstructures, blue arrowheads: centrioles. l Quantification of frequency of interphase cells with the tubulin-based superstructures in (k). n = 3 independent experiments, 50 cells each. m Schematic showing whether each structure remains at low temperature. Data are represented as mean ± s.d. P value was calculated by two-tailed unpaired Student’s t-test (l). Source data are provided as a Source Data file.
Fig. 2
Fig. 2. HYLS1 provides the structural integrity of centriole triplet microtubules to organize centrosomes and primary cilia.
a TEM images of vertically oriented superstructures in RPE-1 cells transfected with pCMV-mScarlet-i-HYLS1. Scale bars: 1 μm, 100 nm, and 10 nm. Large arrowheads (red & black): superstructures, small arrowheads (orange, blue, purple, and cyan): magnified areas in the wall of the superstructure highlighted in red. b TEM images of horizontal superstructures in RPE-1 cells transfected with pCMV-mScarlet-i-HYLS1 and singlet microtubules in RPE-1 cells. Scale bars: 100 nm and 10 nm. Large arrowheads: both sides of the lateral surface of the horizontal superstructure (red and yellow) or magnified areas (red and blue), small arrowheads (white): measured intervals. c Quantification of widths of the superstructure interlayer distances and those of the singlet microtubules in (b). n = 55 structures. d TEM images of younger centrioles in G1 phase RPE-1 cells transfected with siControl or siHYLS1. Scale bar: 100 nm. n = 7 (siControl) or 12 (siHYLS1) cells. e Representative IF images of RPE-1 cells subjected to centriole stability assay with STLC. Before the STLC treatment, the cells were transfected with siControl or siHYLS1. Scale bar: 5 μm. Arrowheads: Centrin foci (centrioles). f Quantification of frequency of mitotic cells with <4 Centrin foci in e. Only groups treated with STLC for 18 h are shown. n = 3 independent experiments, 50 cells each. g IF images of RPE-1 C-Nap1 KO cells subjected to microtubule regrowth assay (30°C, 5 seconds). The cells were transfected with siControl or siHYLS1 before cold-induced microtubule depolymerization. Scale bars: 10 μm and 1 μm. Arrowheads: magnified areas with older (white) or younger (orange) centrosomes. h Quantification of average EB1 intensity around younger centrosomes in (g). A.U.: arbitrary unit. n = 150 cells pooled from 3 independent experiments, 50 cells each. i IF images of mitotic RPE-1 cells treated with siControl or siHYLS1 for 72 h. Scale bar: 10 μm. Arrowheads: Centrin foci (centrioles). j Quantification of frequency of mitotic cells with abnormal mitotic spindles, such as monopolar spindles, asymmetric bipolar spindles with non-centrosomal poles, and bipolar spindles with precociously disengaged centrioles, in (i). n = 3 independent experiments, 31, 32, and 33 cells (siControl) or 31, 31, and 32 cells (siHYLS1). k IF images of RPE-1 cells transfected with siControl or siHYLS1 and then serum starved for 48 h. Scale bar: 5 μm. l Quantification of frequency of interphase cells with primary cilia in (k). n = 3 independent experiments, 50 cells each. m Quantification of length of primary cilia in (k). n = 50 (siControl) or 39 (siHYLS1) cells pooled from 3 independent experiments. n Schematic showing the phenotypes resulting from HYLS1 depletion in centrioles, centrosomes, and primary cilia. MT: microtubule. Data are represented as mean ± s.d. P values were calculated by Mann–Whitney U test (c, h, m), one-way ANOVA with Tukey’s multiple comparisons test (f), or two-tailed unpaired Student’s t-test (j, l). Source data are provided as a Source Data file.
Fig. 3
Fig. 3. The ciliopathy-related D211G mutant of HYLS1 fails to assemble incomplete microtubules and stable centrioles.
a Representative IF images of RPE-1 cells transfected with the indicated constructs. Scale bar: 10 μm. b Quantification of frequency of interphase cells with incomplete MT superstructures in (a). n = 3 independent experiments, 30 cells each. c Schematic showing a specific region of HYLS1 that is required for the assembly of incomplete MT superstructures (superstructure domain). d Schematic showing amino acid sequences of HYLS-1 Box in the indicated species. e IF images of RPE-1 cells transfected with pCMV-FLAG-HYLS1 WT or pCMV-FLAG-HYLS1 D211G. Scale bar: 10 μm. Arrowheads: incomplete MT superstructures. f Quantification of frequency of interphase cells with incomplete MT superstructures in (e). n = 3 independent experiments, 30 cells each. g Representative IF images of RPE-1 TetOn-mNeonGreen-X cells (X = HYLS1 WT or D211G) subjected to centriole stability assay with STLC. Before the STLC treatment, the cells were transfected with siControl or siHYLS1 and were treated with doxycycline. Scale bar: 5 μm. Arrowheads: Centrin foci (centrioles). h Quantification of frequency of mitotic cells with <4 Centrin foci in (g). Only groups treated with STLC for 18 h are shown. n = 3 independent experiments, 50 cells each. Data are represented as mean ± s.d. P values were calculated by one-way ANOVA with Tukey’s multiple comparisons test (h). Source data are provided as a Source Data file.
Fig. 4
Fig. 4. The β-tubulin isotype TUBB is specifically required for the HYLS1-dependent assembly of incomplete microtubules.
a Schematic of AlphaFold-based screening. PAE: predicted aligned error. b, c Structural model and PAE plot of the protein complex of HYLS1 and each α-tubulin (b) or β-tubulin (c) isotype generated by AlphaFold-Multimer. d Immunoblotting images of immunoprecipitated lysates from HEK293 cells transfected with the indicated constructs. Immunoprecipitation was performed using an antibody against FLAG-tag. IP: immunoprecipitation, IB: immunoblotting. e Representative IF images of RPE-1 cells transfected with pCMV-FLAG-HYLS1 and the indicated siRNAs. For each group, two distinct siRNAs were mixed and used, except for siTUBA3D. Scale bar: 10 μm. Arrowheads: incomplete MT superstructures. f Quantification of frequency of interphase cells with incomplete MT superstructures in (e). Cont.: Control. n = 3 independent experiments, 30 cells each. Data are represented as mean ± s.d. P value was calculated by one-way ANOVA with Dunnett’s multiple comparisons test (f). Source data are provided as a Source Data file.
Fig. 5
Fig. 5. TUBB provides the structural integrity of centriole triplet microtubules.
a Representative IF images of RPE-1 cells subjected to centriole stability assay with STLC. Before the STLC treatment, the cells were transfected with the indicated siRNAs. For each group, two distinct siRNAs were mixed and used, except for siTUBA3D. Scale bar: 5 μm. Arrowheads: Centrin foci (centrioles). b Quantification of frequency of mitotic cells with <4 Centrin foci in (a). Only groups treated with STLC for 18 h are shown. Cont.: Control. n = 3 independent experiments, 30 cells each. c TEM images of younger centrioles in G1 phase RPE-1 cells transfected with siControl or siTUBB. Scale bar: 100 nm. n = 7 (siControl) or 11 (siTUBB) cells. d IF images of RPE-1 cells transfected with siControl or siTUBB and then serum starved for 48 h. Scale bar: 5 μm. e Quantification of frequency of interphase cells with primary cilia in (d). n = 3 independent experiments, 50 cells each. f Quantification of length of primary cilia in (d). n = 50 cells pooled from 3 independent experiments. Data are represented as mean ± s.d. P values were calculated by one-way ANOVA with Dunnett’s multiple comparisons test (b), two-tailed unpaired Student’s t-test (e), or Mann–Whitney U test (f). Source data are provided as a Source Data file.
Fig. 6
Fig. 6. HYLS1 regulates the C-terminal tail of TUBB to promote the assembly of incomplete microtubules and stable centrioles.
a Structural model of HYLS1-TUBB complex generated by AlphaFold-Multimer. C-terminal tail (CTT) of TUBB is magnified. Orange: HYLS1, red: HYLS1 D211, cyan: TUBB, blue: TUBB G437. b Schematic of the CTT amino acid sequences of β-tubulin isotypes. Orange: aromatic, light green: uncharged, yellow: negatively charged. c Structural models of TUBB either in HYLS1-TUBB complex or TUBB-TUBA1B complex generated by AlphaFold-Multimer. For each complex, five models were overlaid. d Structural model of TUBB lacking the CTT generated by AlphaFold-Multimer and IF images of RPE-1 cells transfected with pCMV-TUBB with or without the CTT. Scale bars: 10 μm and 1 μm. Arrowheads: magnified area. e Quantification of frequency of interphase cells with tubulin-based superstructures similar to incomplete MT superstructures in (d). n = 3 independent experiments, 30 cells each. f Representative IF images of RPE-1 TetOn-X-FLAG cells (X = TUBB WT or G437E) transfected with pCMV-HA-HYLS1 and siControl or siTUBB, and treated with doxycycline. Scale bar: 10 μm. Arrowheads: incomplete MT superstructures. g Quantification of frequency of interphase cells with incomplete MT superstructures in (f). n = 3 independent experiments, 30 cells each. h Representative IF images of RPE-1 TetOn-X-FLAG cells (X = TUBB WT or G437E) subjected to centriole stability assay with STLC. Before the STLC treatment, the cells were transfected with siControl or siTUBB and were treated with doxycycline. Scale bar: 5 μm. Arrowheads: Centrin foci (centrioles). i Quantification of frequency of mitotic cells with <4 Centrin foci in (h). Only groups treated with STLC for 18 h are shown. n = 3 independent experiments, 50 cells each. j Schematic showing a speculative model of centriole triplet microtubule assembly promoted by HYLS1. Data are represented as mean ± s.d. P values were calculated by one-way ANOVA with Tukey’s multiple comparisons test (g, i). Source data are provided as a Source Data file.

References

    1. Azimzadeh J, Marshall WF. Building the centriole. Curr. Biol. 2010;20:R816–R825. doi: 10.1016/j.cub.2010.08.010. - DOI - PMC - PubMed
    1. Bornens M. The centrosome in cells and organisms. Science. 2012;335:422–426. doi: 10.1126/science.1209037. - DOI - PubMed
    1. Nigg EA, Holland AJ. Once and only once: mechanisms of centriole duplication and their deregulation in disease. Nat. Rev. Mol. Cell Biol. 2018;19:297–312. doi: 10.1038/nrm.2017.127. - DOI - PMC - PubMed
    1. Carvalho-Santos Z, Azimzadeh J, Pereira-Leal JB, Bettencourt-Dias M. Tracing the origins of centrioles, cilia, and flagella. J. Cell Biol. 2011;194:165–175. doi: 10.1083/jcb.201011152. - DOI - PMC - PubMed
    1. Li S, Fernandez JJ, Marshall WF, Agard DA. Three-dimensional structure of basal body triplet revealed by electron cryo-tomography. EMBO J. 2012;31:552–562. doi: 10.1038/emboj.2011.460. - DOI - PMC - PubMed