. 2024 Mar 22;15(1):2598.
doi: 10.1038/s41467-024-46441-2.

Rab4A-directed endosome traffic shapes pro-inflammatory mitochondrial metabolism in T cells via mitophagy, CD98 expression, and kynurenine-sensitive mTOR activation

Affiliations

Rab4A-directed endosome traffic shapes pro-inflammatory mitochondrial metabolism in T cells via mitophagy, CD98 expression, and kynurenine-sensitive mTOR activation

Nick Huang et al. Nat Commun. .

Abstract

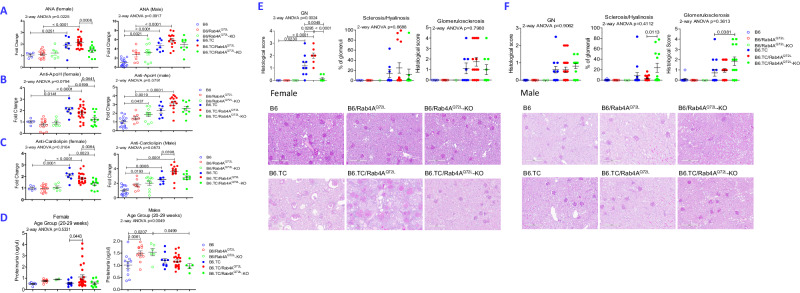
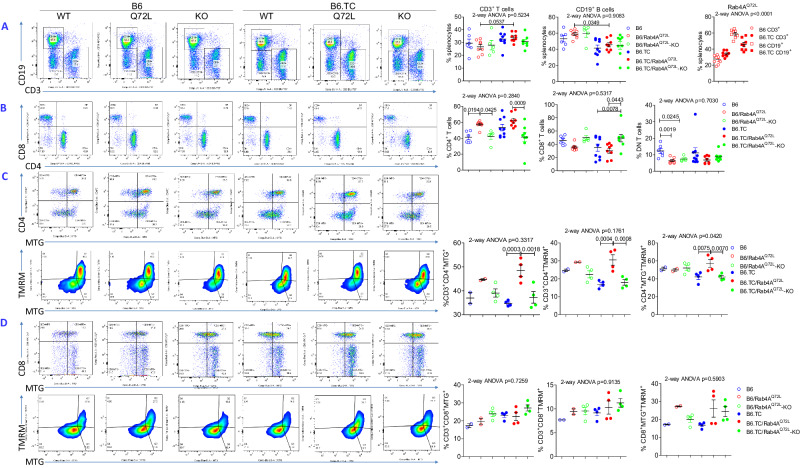
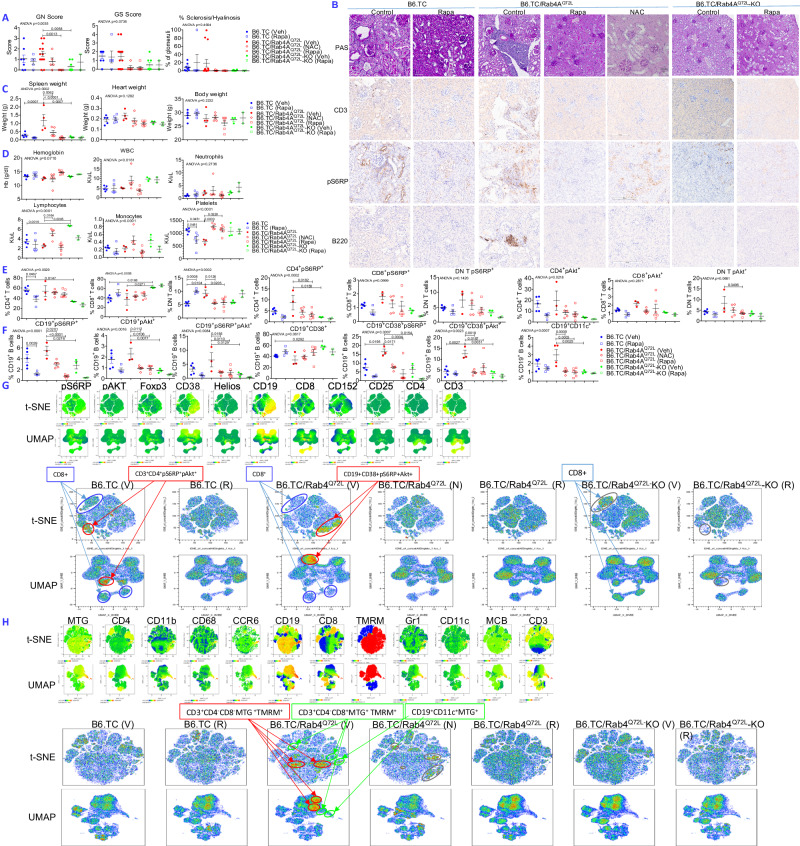
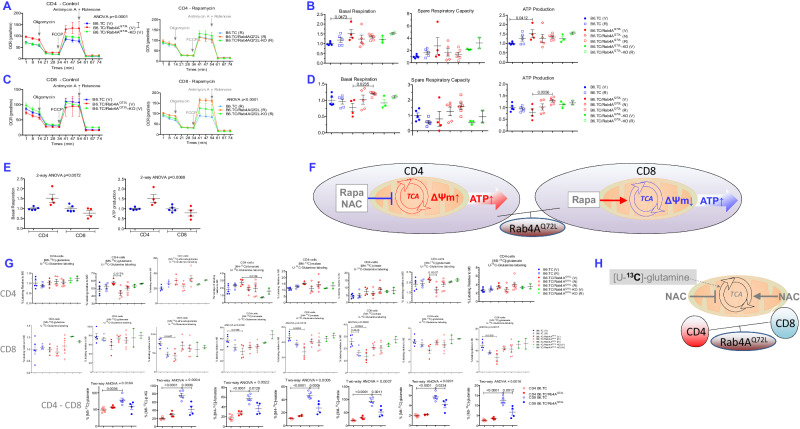
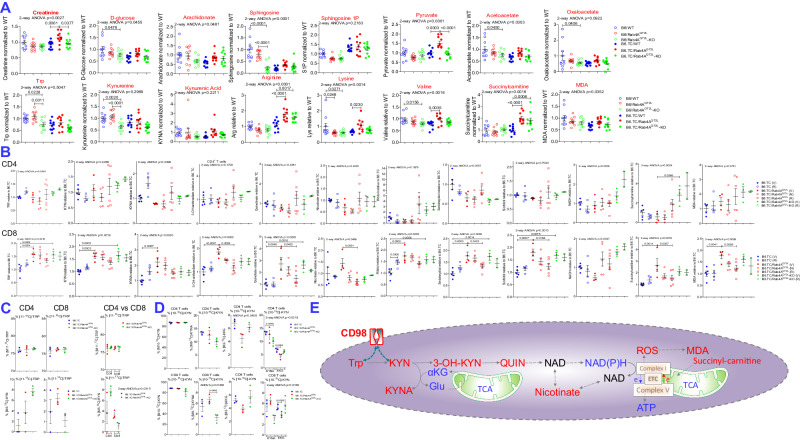
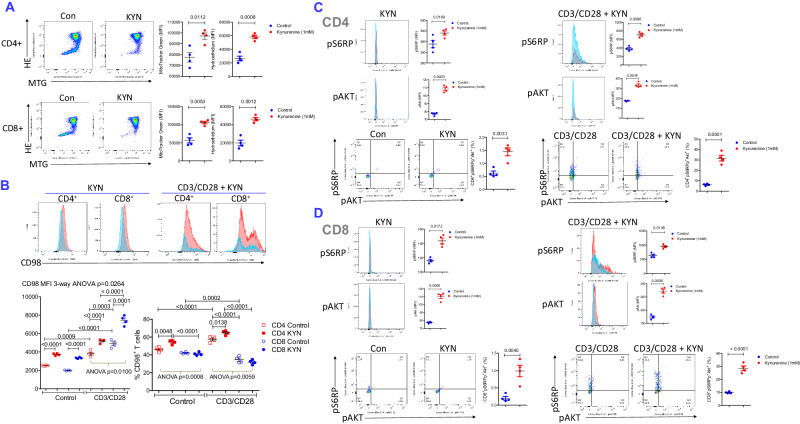
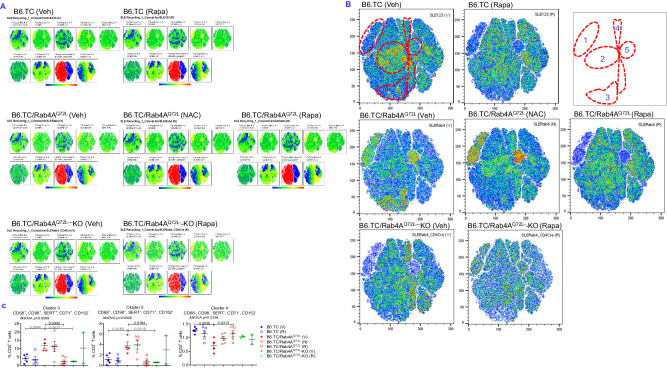
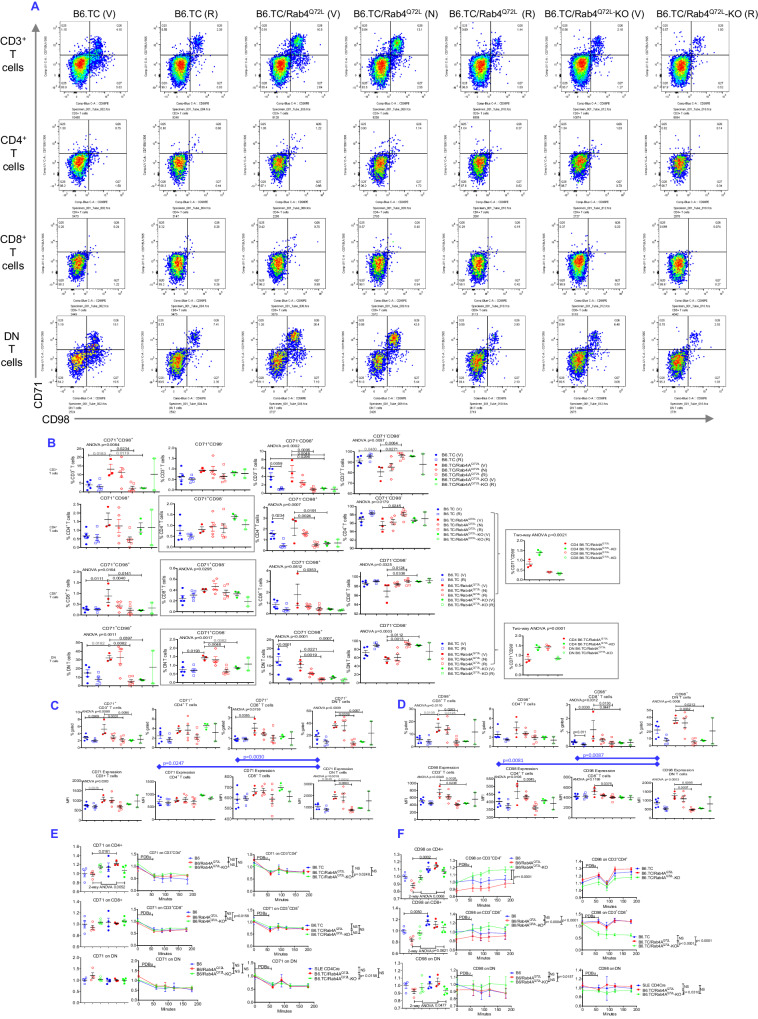
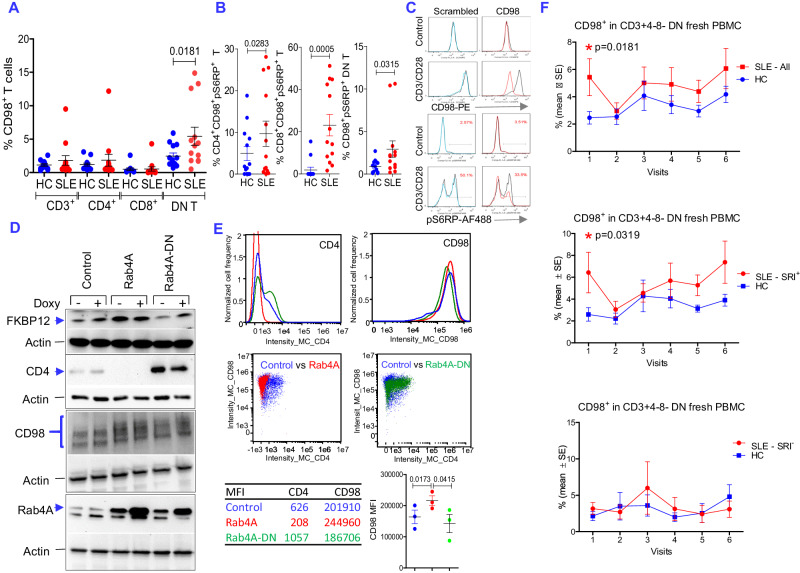
Activation of the mechanistic target of rapamycin (mTOR) is a key metabolic checkpoint of pro-inflammatory T-cell development that contributes to the pathogenesis of autoimmune diseases, such as systemic lupus erythematosus (SLE), however, the underlying mechanisms remain poorly understood. Here, we identify a functional role for Rab4A-directed endosome traffic in CD98 receptor recycling, mTOR activation, and accumulation of mitochondria that connect metabolic pathways with immune cell lineage development and lupus pathogenesis. Based on integrated analyses of gene expression, receptor traffic, and stable isotope tracing of metabolic pathways, constitutively active Rab4AQ72L exerts cell type-specific control over metabolic networks, dominantly impacting CD98-dependent kynurenine production, mTOR activation, mitochondrial electron transport and flux through the tricarboxylic acid cycle and thus expands CD4+ and CD3+CD4-CD8- double-negative T cells over CD8+ T cells, enhancing B cell activation, plasma cell development, antinuclear and antiphospholipid autoantibody production, and glomerulonephritis in lupus-prone mice. Rab4A deletion in T cells and pharmacological mTOR blockade restrain CD98 expression, mitochondrial metabolism and lineage skewing and attenuate glomerulonephritis. This study identifies Rab4A-directed endosome traffic as a multilevel regulator of T cell lineage specification during lupus pathogenesis.


Conflict of interest statement

The authors declare no competing interests.

Figures

Fig. 1
Fig. 1. Rab4A activation promotes ANA, aPL, proteinuria, and GN in female B6.TC mice.
Effect of Rab4A activation and T-cell-specific inactivation were examined on antinuclear autoantibody (ANA; A), β2-glycoprotein I or apolipoprotein H (Apo-H; B), and anti-cardiolipin autoantibody (ACLA; C) production and proteinuria (D) in age-matched, 20- to 29-week-old, male and female mice homozygous for constitutively active Rab4AQ72L or lacking Rab4A in T cells Rab4AQ72L-KO, respectively. E Effect of Rab4A on the development of GN, GS, and % hyalinosis in female mouse sets at ~50 weeks of age. Scale bars are embedded into each representative microscopic image. Dot plots present individual mice. F Effect of Rab4A on the development of GN, GS, and % hyalinosis in male mouse sets at ~50 weeks of age. Kidneys were scored by an experienced renal pathologist blinded to mouse genotypes. Scale bars are embedded into each representative microscopic image. Dot plots present individual mice. 2-way ANOVA and Sidak’s post-hoc test p values are displayed for multiple comparisons of Rab4 WT, Rab4AQ72L, and Rab4AQ72L-KO mice within B6 control and B6.TC SLE strains. Overall 2-way ANOVA p values are shown in the header of each figure panel, while Sidak’s post-hoc test p values < 0.05 over brackets reflect comparison between experimental groups.
Fig. 2
Fig. 2. Rab4A expands CD4+ T cells at the expense of CD8+ T cells both in B6 and B6.TC mice.
A Expansion of T cells at the expense of B cells in the spleens B6.TC/Rab4AQ72L mice over B6/Rab4AQ72L controls in 20-week-old female mice. The numbers (n) of mice in each experimental group were as follows: B6 (n = 6), B6/Rab4AQ72L (n = 8), B6/Rab4AQ72L-KO (n = 5), B6.TC (n = 9), B6.TC/Rab4AQ72L (n = 8), B6.TC/Rab4AQ72L-KO (n = 8); CD3+ T cells 2-way ANOVA p = 0.5234; Sidak’s post-hoc test p values corrected for multiple comparisons: B6/Rab4AQ72L vs B6.TC/Rab4AQ72L p = 0.0537. CD19+ B cells 2-way ANOVA p = 0.9083; Sidak’s post-hoc test p values corrected for multiple comparisons: B6/Rab4AQ72L vs B6.TC/Rab4AQ72L p = 0.0349. CD3+ vs CD19+ B cells in B6/Rab4AQ72L vs B6.TC/Rab4AQ72L mice comparison by 2-way ANOVA p < 0.0001. B Rab4A activation elicits the expansion of CD4+ T cells at the expense of CD8+ T cells within the T-cell compartment in B6/Rab4AQ72L and B6.TC/Rab4AQ72L mice. Left panel, representative flow cytometry dot plots; right panel, cumulative analysis of abundance of CD4+ and CD8+ T cells. The numbers (n) of mice in each experimental group were as follows: B6 (n = 6), B6/Rab4AQ72L (n = 8), B6/Rab4AQ72L-KO (n = 5), B6.TC (n = 9), B6.TC/Rab4AQ72L (n = 8), B6.TC/Rab4AQ72L-KO (n = 8); C Accumulation of mitochondrial mass and elevation of the mitochondrial transmembrane potential (ΔΨm) in CD4+ T cells of B6/Rab4AQ72L and B6.TC/Rab4AQ72L mice and their reversal upon Rab4A deletion in B6/Rab4AQ72L-KO and B6.TC/Rab4AQ72L-KO mice. Relative to the mitochondrial mass, ΔΨm was elevated in CD4+ T cells of B6.TC/Rab4AQ72L mice, indicating mitochondrial hyperpolarization (MHP). The numbers (n) of mice in each experimental group were as follows: B6 (n = 2), B6/Rab4AQ72L (n = 2), B6/Rab4AQ72L-KO (n = 4), B6.TC (n = 4), B6.TC/Rab4AQ72L (n = 4), B6.TC/Rab4AQ72L-KO (n = 4); D MHP in CD8+ T cells of B6/Rab4AQ72L mice is reversed upon Rab4A deletion in B6/Rab4AQ72L-KO mice. The numbers (n) of mice in each experimental group were as follows: B6 (n = 2), B6/Rab4AQ72L (n = 2), B6/Rab4AQ72L-KO (n = 4), B6.TC (n = 4), B6.TC/Rab4AQ72L (n = 4), B6.TC/Rab4AQ72L-KO (n = 4); Dot plots represent individual mice matched for genotype, age, and sex within each experimental group and processed in parallel. 2-way ANOVA p values are displayed for multiple comparisons of Rab4 WT, Rab4AQ72L, and Rab4AQ72L-KO mice within B6 control and B6.TC SLE strains. Overall 2-way ANOVA p values are shown in the header of each figure panel, while Tukey’s post-hoc test p values < 0.05 over connecting bars reflect comparison between experimental groups.
Fig. 3
Fig. 3. Rab4A-mediated pro-inflammatory T and B cell development during lupus pathogenesis is responsive to treatment by rapamycin and N-acetylcysteine (NAC) in vivo.
Treatment with rapamycin (Rapa) and NAC was implemented in female B6.TC/Rab4AQ72L mice beginning at 27 ± 1.4 weeks of age. 3 mg/kg rapamycin was dissolved in phosphate-buffered saline (PBS) with 0.2% carboxymethylcellulose (CMC) solvent vehicle (Veh) and administered intraperitoneally (ip) three times weekly, while 10 g/l of NAC was provided in drinking water for 12 weeks. Control mice were treated ip three times weekly with 0.2% CMC solvent control alone. Age-matched female B6.TC and B6.TC/Rab4AQ72L.CD4Cre-KO mice were also treated with rapamycin or solvent control. A Rapamycin, NAC, and inactivation of Rab4A block GN, GS, and glomerular hyalinosis. Kidneys were scored by an experienced renal pathologist blinded to mouse genotypes and treatments. Overall one-way ANOVA p values are shown in the header of each figure panel, while Sidak’s post-hoc test p values < 0.05 over brackets reflect comparison between experimental groups. The numbers (n) of mice in each experimental group were as follows: B6.TC Veh (n = 8), B6.TC Rapa (n = 5), B6.TC/Rab4AQ72L Veh (n = 15), B6.TC/Rab4AQ72L NAC (n = 5), B6.TC/Rab4AQ72L Rapa (n = 6), B6.TC/Rab4AQ72L-KO Veh (n = 8), B6.TC/Rab4AQ72L-KO Rapa (n = 2); B Effect of rapamycin and inactivation of Rab4A on renal infiltration by CD3+ T cells and B220+ B cells and expression of pS6RP were assessed by immunohistochemistry. C Rapamycin and NAC, and inactivation of Rab4A block splenomegaly and cardiomegaly in lupus-prone mice. Overall one-way ANOVA p values are shown in the header of each figure panel, while Sidak’s post-hoc test p values < 0.05 over brackets reflect comparison between experimental groups. The numbers (n) of mice in each experimental group were as follows: B6.TC (Veh) (n = 5), B6.TC Rapa (n = 5), B6.TC/Rab4AQ72L (Veh) (n = 4), B6.TC/Rab4AQ72L (NAC) (n = 5), B6.TC/Rab4AQ72L (Rapa) (n = 6), B6.TC/Rab4AQ72L-KO (Veh) (n = 3), B6.TC/Rab4AQ72L-KO (Rapa) (n = 2). Spleen weights one-way ANOVA p = 0.0002, Sidak’s post-hoc test p values corrected for multiple comparisons: B6.TC (Veh) vs B6.TC/Rab4AQ72L (Veh) p = 0.0007, B6.TC/Rab4AQ72L (Veh) vs B6.TC/Rab4AQ72L-KO (Veh) p = 0.0007, B6.TC/Rab4AQ72L (Veh) vs B6.TC/Rab4AQ72L (NAC) p = 0.0062, B6.TC/Rab4AQ72L (Veh) vs B6.TC/Rab4AQ72L (Rapa) p < 0.0001; heart weights one-way ANOVA p = 0.1282, body weights one-way ANOVA p = 0.2232. D Effect of rapamycin and NAC and inactivation of Rab4A on anemia, leukopenia, and thrombocytopenia of lupus-prone mice. Overall one-way ANOVA p values are shown in the header of each figure panel, while Sidak’s post-hoc test p values < 0.05 over brackets reflect comparison between experimental groups. The numbers (n) of mice in each experimental group were as follows: B6.TC Veh (n = 5), B6.TC Rapa (n = 5), B6.TC/Rab4AQ72L Veh (n = 3), B6.TC/Rab4AQ72L NAC (n = 5), B6.TC/Rab4AQ72L Rapa (n = 6), B6.TC/Rab4AQ72L-KO Veh (n = 3), B6.TC/Rab4AQ72L-KO Rapa (n = 2); E Effect of rapamycin and NAC, and inactivation of Rab4A on the abundance and mTOR activation of CD4+, CD8+, and DN T cells of lupus-prone mice. Overall one-way ANOVA p values are shown in the header of each figure panel, while Sidak’s post-hoc test p values < 0.05 over brackets reflect comparison between experimental groups. The numbers (n) of mice in each experimental group were as follows: B6.TC Veh (n = 5), B6.TC Rapa (n = 4), B6.TC/Rab4AQ72L Veh (n = 3), B6.TC/Rab4AQ72L NAC (n = 5), B6.TC/Rab4AQ72L Rapa (n = 6), B6.TC/Rab4AQ72L-KO Veh (n = 3), B6.TC/Rab4AQ72L-KO Rapa (n = 2); F Effect of rapamycin and NAC, and inactivation of Rab4A on the activation of mTORC1 and mTORC2 in CD19+ and CD19+CD38+ B cells and abundance of CD19+CD11c+ B cells. Overall one-way ANOVA p values are shown in the header of each figure panel, while Sidak’s post-hoc test p values < 0.05 over brackets reflect comparison between experimental groups.
Fig. 4
Fig. 4. Rab4A exerts cell type-specific control over mitochondrial metabolism between CD4+ and CD8+ T cells.
A Measurement of mitochondrial O2 consumption rate (OCR) in CD4+ T cells. OCR curves of B6.TC, B6.TC/Rab4AQ72L and B6.TC/Rab4AQ72L-KO mice were compared upon treatment with 0.2% CMC (Vehicle panel) or rapamycin dissolved in 0.2% CMC (Rapamycin panel). Exact p values are displayed for analyses by repeated measures ANOVA. The numbers (n) of mice in each experimental group were as follows: B6.TC Veh (n = 5), B6.TC Rapa (n = 5), B6.TC/Rab4AQ72L Veh (n = 4), B6.TC/Rab4AQ72L NAC (n = 5), B6.TC/Rab4AQ72L Rapa (n = 6), B6.TC/Rab4AQ72L-KO Veh (n = 3), B6.TC/Rab4AQ72L-KO Rapa (n = 2). B Cumulative analysis of individual mitochondrial functional checkpoints, basal respiration and mitochondrial ATP production. Dot plot charts reflect mean ± SE of each experimental group normalized to vehicle-treated control B6.TC (V) mice. The numbers (n) of mice in each experimental group were as follows: B6.TC Veh (n = 5), B6.TC Rapa (n = 5), B6.TC/Rab4AQ72L Veh (n = 4), B6.TC/Rab4AQ72L NAC (n = 5), B6.TC/Rab4AQ72L Rapa (n = 6), B6.TC/Rab4AQ72L-KO Veh (n = 3), B6.TC/Rab4AQ72L-KO Rapa (n = 2). One-way ANOVA Sidak’s post-hoc test p values corrected for multiple comparisons; basal respiration B6.TC (Veh) vs B6.TC/Rab4AQ72L (Veh) p = 0.0473; ATP production B6.TC (Veh) vs B6.TC/Rab4AQ72L (Veh) p = 0.0412. C Mitochondrial OCR in CD8+ T cells. The numbers (n) of mice in each experimental group were as follows: B6.TC Veh (n = 5), B6.TC Rapa (n = 5), B6.TC/Rab4AQ72L Veh (n = 4), B6.TC/Rab4AQ72L NAC (n = 5), B6.TC/Rab4AQ72L Rapa (n = 6), B6.TC/Rab4AQ72L-KO Veh (n = 3), B6.TC/Rab4AQ72L-KO Rapa (n = 2); B6.TC Veh vs B6.TC/Rab4AQ72L Veh vs B6.TC/Rab4AQ72L-KO Veh two-way repeated-measures ANOVA p = 0.9997, B6.TC Rapa vs B6.TC/Rab4AQ72L Rapa vs B6.TC/Rab4AQ72L-KO Rapa two-way repeated-measures ANOVA p < 0.0001. D Cumulative analysis of individual mitochondrial functional checkpoints, basal respiration and mitochondrial ATP production, in CD8+ T cells. Measurements were carried out, as described in (B). The numbers (n) of mice in each experimental group were as follows: B6.TC Veh (n = 5), B6.TC Rapa (n = 5), B6.TC/Rab4AQ72L Veh (n = 4), B6.TC/Rab4AQ72L NAC (n = 5), B6.TC/Rab4AQ72L Rapa (n = 6), B6.TC/Rab4AQ72L-KO Veh (n = 3), B6.TC/Rab4AQ72L-KO Rapa (n = 2). One-way ANOVA Sidak’s post-hoc test p values corrected for multiple comparisons; basal respiration B6.TC/Rab4AQ72L (Veh) vs B6.TC/Rab4AQ72L (Rapa) p = 0.0235; ATP production B6.TC/Rab4AQ72L (Veh) vs B6.TC/Rab4AQ72L (Rapa) p = 0.0056. E Opposite effects of Rab4A activation on basal respiration and mitochondrial ATP production between CD4+ and CD8+ T cells. Normalized values in B6.TC mice were compared to those of B6.TC/Rab4AQ72L mice with two-way ANOVA. The numbers (n) of mice in each experimental group were as follows: B6.TC Veh (n = 5), B6.TC/Rab4AQ72L Veh (n = 4); F Schematic diagram of Rab4A-mediated cell type-specific changes in mitochondrial metabolism between CD4+ and CD8+ T cells. Rab4A increased mitochondrial respiration and ATP production in CD4+ T cells while it exerted an opposite effect in CD8+ T cells. NAC and rapamycin treatment in vivo reversed the changes in mitochondrial metabolism in CD4+ T cells, while rapamycin reversed these changes in CD8+ T cells. G Assessment of metabolic flux of [U-13C]-glutamine through the mitochondrial TCA cycle in CD4+ T (top row) and CD8+ T cells (middle row). Dot plot charts show mean ± SE of % enrichment of TCA substrates [M5-13C]-glutamate, [M5-13C]-α-ketoglutarate ([M5-13C]-αKG), [M4-13C]-fumarate, and [M4-13C]-malate. Overall one-way ANOVA p values are shown in the header of each figure panel, while Sidak’s post-hoc test p values < 0.05 over brackets reflect comparison between experimental groups. Effects of Rab4A activation and inactivation within CD4+ and CD8+ T cells were compared by two-way ANOVA. The numbers (n) of mice in each experimental group were as follows: B6.TC Veh (n = 5), B6.TC Rapa (n = 4), B6.TC/Rab4AQ72L Veh (n = 4), B6.TC/Rab4AQ72L NAC (n = 5), B6.TC/Rab4AQ72L Rapa (n = 6), B6.TC/Rab4AQ72L-KO Veh (n = 2), B6.TC/Rab4AQ72L-KO Rapa (n = 2). One-way ANOVA Sidak’s post-hoc test p values corrected for multiple comparisons; CD4+ T cells [M5-13C]-glutamate enrichment B6.TC/Rab4AQ72L (Veh) vs B6.TC/Rab4AQ72L (NAC) p = 0.0179; CD4+ T cells [M4-13C]-fumarate enrichment B6.TC/Rab4AQ72L (Veh) vs B6.TC/Rab4AQ72L–KO (Veh) p = 0.0136; CD4+ T cells [M4-13C]-glutamate enrichment B6.TC/Rab4AQ72L (Veh) vs B6.TC/Rab4AQ72L (NAC) p = 0.0307; CD8+ T cells [M5-13C]-α-ketoglutarate enrichment B6.TC (Veh) vs B6.TC/Rab4AQ72L (Veh) p = 0.0457; CD8+ T cells [M4-13C]-fumarate enrichment B6.TC (Veh) vs B6.TC/Rab4AQ72L (Veh) p = 0.0185; CD8+ T cells [M4-13C]-malate enrichment B6.TC (Veh) vs B6.TC/Rab4AQ72L (Veh) p = 0.0038; CD8+ T cells [M4-13C]-cirate enrichment B6.TC (Veh) vs B6.TC/Rab4AQ72L (Veh) p = 0.0042; CD8+ T cells [M4-13C]-citrate enrichment B6.TC (Veh) vs B6.TC (Rapa) p = 0.0348; CD8+ T cells [M3-13C]-glutamate enrichment B6.TC (Veh) vs B6.TC/Rab4AQ72L (Veh) p = 0.0215. Two-way ANOVA of CD4 vs CD8 and B6.TC vs B6.TC/Rab4AQ72L: [M5-13C]-glutamate enrichment two-way ANOVA p = 0.0164, CD4 B6.TC vs CD8 B6.TC Sidak’s post-hoc test p = 0.0036; [M5-13C]-αKG enrichment two-way ANOVA p = 0.0004, CD4 B6.TC vs CD8 B6.TC Sidak’s post-hoc test p < 0.0001, CD8 B6.TC vs CD8 B6.TC/Rab4AQ72L Sidak’s post-hoc test p = 0.0006; [M4-13C]-fumarate enrichment two-way ANOVA p = 0.0022, CD4 B6.TC vs CD8 B6.TC Sidak’s post-hoc test p < 0.0001, CD8 B6.TC vs CD8 B6.TC/Rab4AQ72L Sidak’s post-hoc test p = 0.0126; [M4-13C]-malate enrichment two-way ANOVA p = 0.0005, CD4 B6.TC vs CD8 B6.TC Sidak’s post-hoc test p < 0.0001, CD8 B6.TC vs CD8 B6.TC/Rab4AQ72L Sidak’s post-hoc test p = 0.0005; [M4-13C]-citrate enrichment two-way ANOVA p = 0.0007, CD4 B6.TC vs CD8 B6.TC Sidak’s post-hoc test p < 0.0001, CD8 B6.TC vs CD8 B6.TC/Rab4AQ72L Sidak’s post-hoc test p = 0.0011; [M4-13C]-glutamate enrichment two-way ANOVA p = 0.0201, CD4 B6.TC vs CD8 B6.TC Sidak’s post-hoc test p < 0.0001, CD8 B6.TC vs CD8 B6.TC/Rab4AQ72L Sidak’s post-hoc test p = 0.0234; [M3-13C]-glutamate enrichment two-way ANOVA p = 0.0016, CD4 B6.TC vs CD8 B6.TC Sidak’s post-hoc test p < 0.0001, CD8 B6.TC vs CD8 B6.TC/Rab4AQ72L Sidak’s post-hoc test p = 0.0012. H Schematic diagram of Rab4A-mediated cell type-specific changes in mitochondrial metabolism between CD4+ and CD8+ T cells. Rab4A increased mitochondrial respiration and ATP production in CD4+ T cells while it exerted an opposite effect in CD8+ T cells. Metabolic flux in the TCA cycle was increased in CD4+ T cells but reduced in CD8+ T cells; which were highlighted by red circular arrows and red TCA designation in CD4+ T cells and blue circular arrows and blue TCA designation in CD8+ T cells, respectively, within schematic mitochondria. NAC and rapamycin treatment in vivo reversed the changes in mitochondrial metabolism in CD4+ T cells, while rapamycin reversed these changes in CD8+ T cells.
Fig. 5
Fig. 5. Rab4A/mTOR axis promotes C5-C7 polyol and KYN accumulation in CD8+ T cells and sera of B6.TC/Rab4AQ72L mice.
A Effect of Rab4A activation on serum metabolite concentrations in female B6 and lupus-prone mice B6.TC mice. A total of 60 mice were analyzed, 10 mice per each of six genotypes: B6, B6/Rab4AQ72L, B6/Rab4AQ72L-KO, B6.TC, B6.TC/Rab4AQ72L, B6.TC/Rab4AQ72L-KO. The mice were 39.1 ± 1.1 weeks of age and matched for age amongst the genotypes. Overall two-way ANOVA p values are shown in the header of each figure panel, while Tukey’s post-hoc test p values < 0.05 over brackets reflect comparison between experimental groups. The numbers of mice was n = 10 in each experimental group. Charts show mean ± SEM for each experimental group. B Effect of Rab4A activation and treatment by rapamycin and NAC on TRP, KYN, pyridine nucleotide, and C5-C7 polyol concentrations in CD4+ and CD8+ T cells of B6.TC, B6.TC/Rab4AQ72L, and B6/Rab4AQ72L-KO mice described in Fig. 3. Data represent concentration values normalized to those of B6.TC control mice. The numbers (n) of mice in each experimental group were as follows: B6.TC Veh (n = 5), B6.TC Rapa (n = 4), B6.TC/Rab4AQ72L Veh (n = 4), B6.TC/Rab4AQ72L NAC (n = 5), B6.TC/Rab4AQ72L Rapa (n = 6), B6.TC/Rab4AQ72L-KO Veh (n = 3), B6.TC/Rab4AQ72L-KO Rapa (n = 2). Charts show mean ± SEM for each experimental group. C Inactivation of Rab4A distorted the accumulation of [M5-13C]-KYN into opposite directions in [11-13C]-TRP-labeled CD4+ and CD8+ T cells of 20-week-old B6.TC/Rab4AQ72L-KO mice over age-matched female B6.TC/Rab4AQ72L controls. The number of mice was n = 3 in each experimental group. Charts show mean ± SEM for each experimental group. D Rab4A promoted the accumulation of [M8-13C]-KYNA but reduced the enrichment of [M2-13C]-αKG in [10-13C]-KYN-labeled CD8+ T cells of B6.TC/Rab4AQ72L mice, which was reversed by the inactivation of Rab4A in B6.TC/Rab4AQ72L-KO mice. The number of mice was n = 3 in each experimental group. Charts show mean ± SEM for each experimental group. E Mechanistic diagram of metabolic pathways underlying increased production of KYN in CD8+ T cells of B6.TC/Rab4AQ72L mice.
Fig. 6
Fig. 6. Contrasting effects of KYN on activation of mTORC1 and mTORC2, expression of CD98 and relative abundance of primary CD4+ and CD8 mouse T+ cells.
Splenocytes from four female B6 mice were stimulated with 1 mM KYN alone or together with CD3/CD28 for 72 h in vitro, as indicated for each panel. Phenotyping for expression of CD3, CD19, CD4, CD8, and CD98 was performed by flow cytometry. A Measurement of mitochondrial mass and ROS production by MTG and HE fluorescence, respectively. Left panels show representative flow cytometry dot plots, while right panels show GraphPad charts of cumulative analyses. Brackets represent p values < 0.05 by comparison using two-tailed paired t test. The number of mice was n = 4 in each experimental group. Charts show mean ± SEM for each experimental group. B Effect of KYN on the expression of CD98 and the prevalence of CD4+ and CD8+ T cells with and without concurrent CD3/CD28 co-stimulation. Representative flow cytometry histograms and dot plots and mean ± SE four independent experiments are shown. Brackets show p values < 0.05 using 3-way ANOVA and Sidak’s post-hoc tests to correct for multiple comparisons. CD98MFI three-way ANOVA p = 0.0264; Sidak’s post-hoc test p values corrected for multiple comparisons: KYN vs control unstimulated CD4+ T cells p < 0.0001, KYN vs control unstimulated CD8+ T cells p < 0.0001, KYN vs control CD3CD28-stimulated CD4+ T cells p < 0.0001, KYN vs control CD3CD28-stimulated CD8+ T cells p < 0.0001, CD3CD28-stimulated vs unstimulated CD4+ T cells p = 0.0009, CD3CD28-stimulated vs unstimulated CD8+ T cells p < 0.0001, control CD3CD28-stimulated CD4+ vs control CD3CD28-stimulated CD8+ T cells p = 0.0003, KYN-treated CD3CD28-stimulated CD4+ vs KYN-treated CD3CD28-stimulated CD8+ T cells p < 0.0001. Two-way ANOVA of CD3CD28-stimulated control and KYN-treated CD4+ and CD8+ T cells p = 0.0100. %CD98+ cells three-way ANOVA p = 0.6602; Sidak’s post-hoc test p values corrected for multiple comparisons: KYN vs control unstimulated CD4+ T cells p = 0.0048, KYN-treated unstimulated CD4+ T cells vs KYN-treated unstimulated CD8+ T cells p < 0.0001,KYN vs control CD3CD28-stimulated CD4+ T cells p = 0.0138, CD3CD28-stimulated vs unstimulated CD4+ T cells p < 0.0001, CD3CD28-stimulated vs unstimulated CD8+ T cells p = 0.0002, control CD3CD28-stimulated CD4+ vs control CD3CD28-stimulated CD8+ T cells p < 0.0001, KYN-treated CD3CD28-stimulated CD4+ vs KYN-treated CD3CD28-stimulated CD8+ T cells p < 0.0001. Two-way ANOVA of unstimulated control and KYN-treated CD4+ and CD8+ T cells p = 0.0008. Two-way ANOVA of CD3CD28-stimulated control and KYN-treated CD4+ and CD8+ T cells p = 0.0059. C Effect of KYN on mTORC1 and mTORC2 activities in CD8+ T cells with and without concurrent CD3/CD28 co-stimulation. Following staining for surface expression of CD3, CD19, CD4, CD8, and CD98, cells were fixed and permeabilized and activities of mTORC1 and mTORC2 were measured by intracellular staining for pS6RP and pAkt, respectively. Representative flow cytometry histograms and dot plots and mean ± SE four independent experiments are shown. Brackets represent p values < 0.05 by comparison using two-tailed paired t-test: KYN-treated vs control unstimulated cells pS6RP MFI p = 0.0169, pAkt MFI p = 0.0003, CD4+pS6RP+pAkt+ (%) p = 0.0031, KYN-treated vs control CD3CD28-stimulated cells pS6RP MFI p = 0.0086, pAkt MFI p = 0.0018, CD4+pS6RP+pAkt+ (%) p = 0.0001. D Effect of KYN on mTORC1 and mTORC2 activities in CD8+ T cells with and without concurrent CD3/CD28 co-stimulation. Following staining for surface expression of CD3, CD19, CD4, CD8, and CD98, cells were fixed and permeabilized and activities of mTORC1 and mTORC2 were measured by intracellular staining for pS6RP and pAkt, respectively. Representative flow cytometry histograms and dot plots and mean ± SE four independent experiments are shown. Brackets represent p values < 0.05 by comparison using two-tailed paired t test: KYN-treated vs control unstimulated cells pS6RP MFI p = 0.0172, pAkt MFI p = 0.0005, CD8+pS6RP+pAkt+ (%) p = 0.0040, KYN-treated vs control CD3CD28-stimulated cells pS6RP MFI p = 0.0136, pAkt MFI p = 0.0006, CD8+pS6RP+pAkt+ (%) p < 0.0001.
Fig. 7
Fig. 7. Flow cytometry analysis of the impact of Rab4A and treatment by rapamycin and NAC on the surface expression of trafficked receptors in splenocyte subsets from lupus-prone mice.
B6.TC, B6.TC/Rab4AQ72L, and B6/Rab4AQ72L-KO mice were treated intraperitoneally (ip) three times weekly with 0.2% carboxymethylcellulose (CMC) vehicle solvent control (V), 3 mg/kg rapamycin (R), or 10 g/l of NAC (N) in drinking water. A Dimensionality reduction analyses of surface receptors by t-SNE in all mice combined. Color axis: blue (0) → red (max). Color scale from blue to red: −1622 to 262856. B Dimensionality reduction analyses by t-SNE delineated five cell clusters in response to altered expression of Rab4A and therapeutic intervention by rapamycin and NAC: cluster 1, CD71+CD98+CD152+ T cells; cluster 2, CD4+ T cells; cluster 3, CD71+CD98+SERT+ DN T cells; cluster 4, CD8+ T cells; cluster 5, CD71+CD98+CD152- T cells. C Statistical analysis of the impact of Rab4A and treatment with rapamycin and NAC on the abundance of clusters 3, 5, and 4. Overall one-way ANOVA p values are shown in the header of each figure panel, while Sidak’s post-hoc test p values < 0.05 over brackets reflect comparison between experimental groups. The numbers (n) of mice in each experimental group were as follows: B6.TC Veh (n = 5), B6.TC Rapa (n = 5), B6.TC/Rab4AQ72L Veh (n = 4), B6.TC/Rab4AQ72L NAC (n = 5), B6.TC/Rab4AQ72L Rapa (n = 6), B6.TC/Rab4AQ72L-KO Veh (n = 3), B6.TC/Rab4AQ72L-KO Rapa (n = 2). Charts show mean ± SEM for each experimental group.
Fig. 8
Fig. 8. The effect of Rab4A-directed endosome traffic and treatment by rapamycin and NAC on the surface expression of CD71 and CD98 in the CD3+, CD4+, CD8+, and DN T cell subsets of age-matched female lupus-prone mice.
A Representative flow cytometry dot plots show the effect of Rab4A and treatment by rapamycin and NAC on the surface expression of CD71 and CD98 in the CD3+, CD4+, CD8+, and DN T cell subsets of age-matched female lupus-prone mice. B Cumulative flow cytometry analyses represent the mean ± SE of the effect of Rab4A and treatment by rapamycin and NAC on concurrent surface expression of CD71 and CD98 in the CD3+, CD4+, CD8+, and DN T cell subsets of age-matched female lupus-prone mice. Overall one-way ANOVA p values are shown in the header of each figure panel, while Sidak’s post-hoc test p values < 0.05 over brackets reflect comparison between experimental groups. The effects of Rab4A deletion between CD4+ and CD8+ T and between CD4+ and DN T cells were compared by two-way ANOVA. The numbers (n) of mice in each experimental group were as follows: B6.TC Veh (n = 5), B6.TC Rapa (n = 5), B6.TC/Rab4AQ72L Veh (n = 3), B6.TC/Rab4AQ72L NAC (n = 5), B6.TC/Rab4AQ72L Rapa (n = 6), B6.TC/Rab4AQ72L-KO Veh (n = 3), B6.TC/Rab4AQ72L-KO Rapa (n = 2). Charts show mean ± SEM for each experimental group. C The impact of Rab4A and treatment by rapamycin and NAC on the surface expression of CD71 in age-matched female B6.TC, B6.TC/Rab4AQ72L, and B6/Rab4AQ72L-KO mice. Dot plot charts represent cumulative assessment of the percentage of receptor-positive cells (top panels) and MFI of CD71 expression in the CD3+, CD4+, CD8+, and DN T cell compartments (bottom panels). Overall one-way ANOVA p values are shown in the header of each figure panel, while Sidak’s post-hoc test p values < 0.05 over brackets reflect comparison between experimental groups. The numbers (n) of mice in each experimental group were as follows: B6.TC Veh (n = 5), B6.TC Rapa (n = 5), B6.TC/Rab4AQ72L Veh (n = 3), B6.TC/Rab4AQ72L NAC (n = 5), B6.TC/Rab4AQ72L Rapa (n = 6), B6.TC/Rab4AQ72L-KO Veh (n = 3), B6.TC/Rab4AQ72L-KO Rapa (n = 2). Charts show mean ± SEM for each experimental group. D The impact of Rab4A and treatment by rapamycin and NAC on the surface expression of CD98 in age-matched female B6.TC, B6.TC/Rab4AQ72L, and B6/Rab4AQ72L-KO mice. Dot plot charts represent cumulative assessment of the percentage of receptor-positive cells (top panels) and MFI of CD71 expression in the CD3+, CD4+, CD8+, and DN T cell compartments (bottom panels). Overall one-way ANOVA p values are shown in the header of each figure panel, while Sidak’s post-hoc test p values < 0.05 over brackets reflect comparison between experimental groups; p values in blue reflect comparison between CD4+ and DN T cells or CD8+ DN T cells in B6.TC control mice. The numbers (n) of mice in each experimental group were as follows: B6.TC Veh (n = 5), B6.TC Rapa (n = 5), B6.TC/Rab4AQ72L Veh (n = 3), B6.TC/Rab4AQ72L NAC (n = 5), B6.TC/Rab4AQ72L Rapa (n = 6), B6.TC/Rab4AQ72L-KO Veh (n = 3), B6.TC/Rab4AQ72L-KO Rapa (n = 2). Charts show mean ± SEM for each experimental group. E Effect of Rab4A on endocytic traffic of CD71 in CD4+, CD8+, and DN T cells in B6/Rab4AQ72L and B6.TC/Rab4AQ72L mice (carrying constitutively active Rab4AQ72L), B6/Rab4AQ72L-KO and B6.TC/Rab4AQ72L-KO mice (lacking Rab4A in T cells), and B6 and B6.TC controls. Left panel, baseline expression in all genotypes; middle panel, assessment of the effect of Rab4A on receptor recycling in B6 control mice; right panel, assessment of the effect of Rab4A in B6.TC SLE mice. 2-way ANOVA p values are shown within each figure panel, while Sidak’s post-hoc test p values < 0.05 over brackets reflect comparison between experimental groups. The numbers (n) of mice in each experimental group were as follows: B6 (n = 4), B6/Rab4AQ72L (n = 4), B6/Rab4AQ72L-KO (n = 4), B6.TC (n = 4), B6.TC/Rab4AQ72L (n = 3), B6.TC/Rab4AQ72L-KO (n = 4). Charts show mean ± SEM for each experimental group. F Effect of Rab4A on endocytic traffic of CD98 in CD4+, CD8+, and DN T cells in B6/Rab4AQ72L and B6.TC/Rab4AQ72L mice (carrying constitutively active Rab4AQ72L), B6/Rab4AQ72L-KO and B6.TC/Rab4AQ72L-KO mice (lacking Rab4A in T cells), and B6 and B6.TC controls. Left panel, baseline expression in all genotypes; middle panel, an assessment of the effect of Rab4A on receptor recycling in B6 control mice; right panel, assessment of the effect of Rab4A in B6.TC SLE mice. 2-way ANOVA p values are shown within each figure panel, while Sidak’s post-hoc test p values < 0.05 over brackets reflect comparison between experimental groups. CD98 on CD4+ T cells 2-way ANOVA p = 0.0068, B6/Rab4AQ72L vs B6.TC/Rab4AQ72L Sidak’s post-hoc test p = 0.0002, B6 vs B6/Rab4AQ72L-KO repeated-measures ANOVA p < 0.0001, B6/Rab4AQ72L vs B6/Rab4AQ72L-KO repeated-measures ANOVA p < 0.0001, CD98 on CD8+ T cells 2-way ANOVA p = 0.0477, B6/Rab4AQ72L vs B6.TC/Rab4AQ72L Sidak’s post-hoc test p = 0.0050, B6 vs B6/Rab4AQ72L-KO repeated-measures ANOVA p < 0.0001, B6/Rab4AQ72L vs B6/Rab4AQ72L-KO repeated-measures ANOVA p = 0.0004, B6.TC vs B6.TC/Rab4AQ72L-KO repeated-measures ANOVA p < 0.0001, B6.TC/Rab4AQ72L vs B6.TC/Rab4AQ72L-KO repeated-measures ANOVA p < 0.0001, CD98 on DN T cells 2-way ANOVA p = 0.0621, B6/Rab4AQ72L vs B6.TC/Rab4AQ72L Sidak’s post-hoc test p = 0.0050, B6 vs B6/Rab4AQ72L-KO repeated-measures ANOVA p = 0.0157, B6.TC/Rab4AQ72L vs B6.TC/Rab4AQ72L-KO repeated-measures ANOVA p = 0.0310. The numbers (n) of mice in each experimental group were as follows: B6 (n = 4), B6/Rab4AQ72L (n = 4), B6/Rab4AQ72L-KO (n = 4), B6.TC (n = 4), B6.TC/Rab4AQ72L (n = 3), B6.TC/Rab4AQ72L-KO (n = 4). Charts show mean ± SEM for each experimental group.
Fig. 9
Fig. 9. CD98 expression promotes mTOR activation and predicts clinical response to sirolimus in patients with SLE.
A Quantitation of CD98+ T cells in 12 paired SLE and healthy control (HC) participants; two-tailed t test p = 0.0181. Charts show mean ± SEM for each experimental group. B mTORC1 activation is increased within CD98+ T lymphocytes in 12 SLE patients relative to 12 HC participants. Charts show mean ± SEM for each experimental group. p values < 0.05 are shown as determined by 2-tailed paired t-test. C Knockdown by siRNA indicates CD98 involvement in TCR-induced mTOR activation. Alexa647-conjugated CD98 or scrambled control siRNA was electroporated into 2 × 106 HC peripheral blood lymphocytes (PBL), as earlier described,. CD98PE and pS6RP-AF488 histograms were gated on Alexa 647+/CD3-APC-Cy7+ dual-positive cells. mTORC1 activation was assessed by the bracketed pS6RP-AF488+ cells, as earlier described,. D Rab4A promotes the surface expression of CD98. The effect of Rab4A was examined by western blot on the expression of FKBP12 and CD98 in Jurkat cells carrying doxycycline-inducible adeno-associated virus (AAV) expression vectors. Western blots represent 5 or more similar experiments. Jurkat cells with construct 6678 overexpressed wild-type Rab4A while those with construct 9035 overexpressed dominant-negative Rab4AS26N (Rab4A-DN), as earlier described. Control cells carried “empty“ vector construct 4480. Rab4A, FKBP12, CD4, and actin were detected by antibodies described earlier. CD98 was detected with antibody sc-9160 from Santa Cruz Biotechnology (Santa Cruz, CA). E Effect of Rab4A on surface expression of CD98 was detected by flow cytometry. CD4 was detected as a control antigen that is targeted for lysosomal degradation by Rab4A, which is blocked by overexpression of Rab4A-DN. Of note, the expression vectors confer moderate overexpression of Rab4A and Rab4A-DN in the absence of doxycycline, which are sufficient to exert opposing changes on CD4 expression in Jurkat cells of primary CD4 T cells, as earlier described. Top and middle panels show histogram and dot plot overlays of CD4 and CD98 expression. Bottom panels show mean channel fluorescence intensity (MFI) of representative histograms of the top panel, while bar charts show mean ± SE of three independent experiments. P values represent comparison using two-tailed paired t test, connecting bars indicate P < 0.05, which reflect hypothesis testing and have not been corrected for multiple comparisons. F Effect of sirolimus (rapamycin) treatment on expression of CD98 in DN T cells in SLE patients during 12-month intervention. The prevalence of CD98+ DN cells was determined in thirteen freshly isolated PBL of SLE and HC participants matched for age within 10 years (top panel). Nine patients met criteria for SLE Responder Index (SRI+, middle panel), while 4 patients were SRI non-responders (SRI, lowest panel). CD98+ DN cells were assessed before treatment (visit 1) and after treatment for 1 month (visit 2), 3 months (visit 3), 6 months (visit 4), 9 months (visit 5), and 12 months (visit 6). Effects of sirolimus were also assessed by 2-tailed paired t test relative to HC participants tested in parallel; *, p < 0.05. Charts show mean ± SE of patients and controls for each time point.

Similar articles

Cited by

References

    1. Tsokos GC. Systemic Lupus Erythematosus. N. Engl. J. Med. 2011;365:2110–2121. doi: 10.1056/NEJMra1100359. - DOI - PubMed
    1. Mihara M, et al. Immunologic abnormality in NZB/NZW F1 mice. Thymus-independent occurrence of B cell abnormality and requirement for T cells in the development of autoimmune disease, as evidenced by an analysis of the athymic nude individuals. J. Immunol. 1988;141:85–90. doi: 10.4049/jimmunol.141.1.85. - DOI - PubMed
    1. Shlomchik MJ, Madaio MP, Ni D, Trounstein M, Huszar D. The role of B cells in LPR/LPR-induced autoimmunity. J. Exp. Med. 1994;180:1295–1306. doi: 10.1084/jem.180.4.1295. - DOI - PMC - PubMed
    1. Jacob N, et al. B Cell and BAFF dependence of IFN-a-exaggerated disease in systemic Lupus Erythematosus-prone NZM 2328 mice. J. Immunol. 2011;186:4984–4993. doi: 10.4049/jimmunol.1000466. - DOI - PMC - PubMed
    1. Fernandez D, Bonilla E, Mirza N, Niland B, Perl A. Rapamycin reduces disease activity and normalizes T-cell activation-induced calcium fluxing in patients with systemic lupus erythematosus. Arthritis Rheum. 2006;54:2983–2988. doi: 10.1002/art.22085. - DOI - PMC - PubMed