. 2024 Mar 22;15(1):2567.
doi: 10.1038/s41467-024-46778-8.

BET inhibitors drive Natural Killer activation in non-small cell lung cancer via BRD4 and SMAD3

Affiliations

BET inhibitors drive Natural Killer activation in non-small cell lung cancer via BRD4 and SMAD3

Francesca Reggiani et al. Nat Commun. .

Abstract

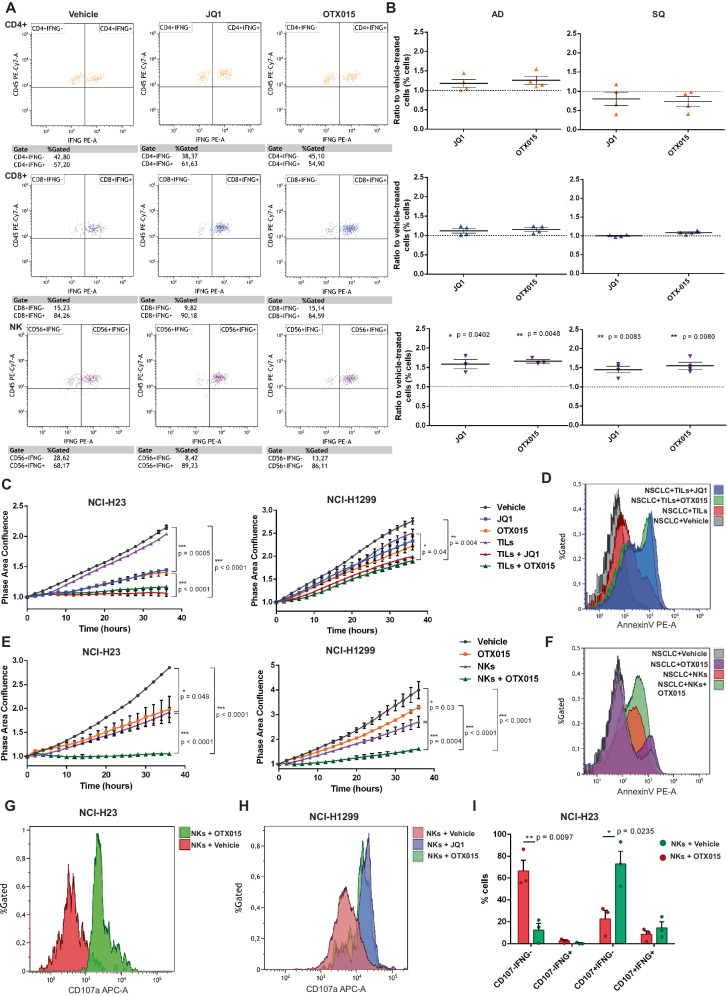
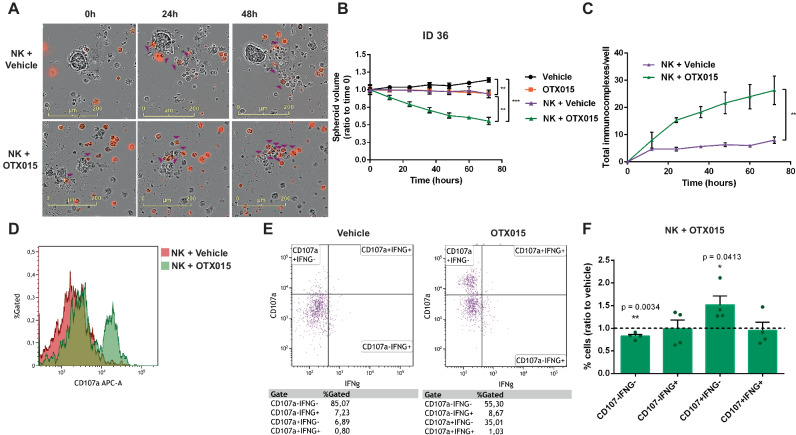
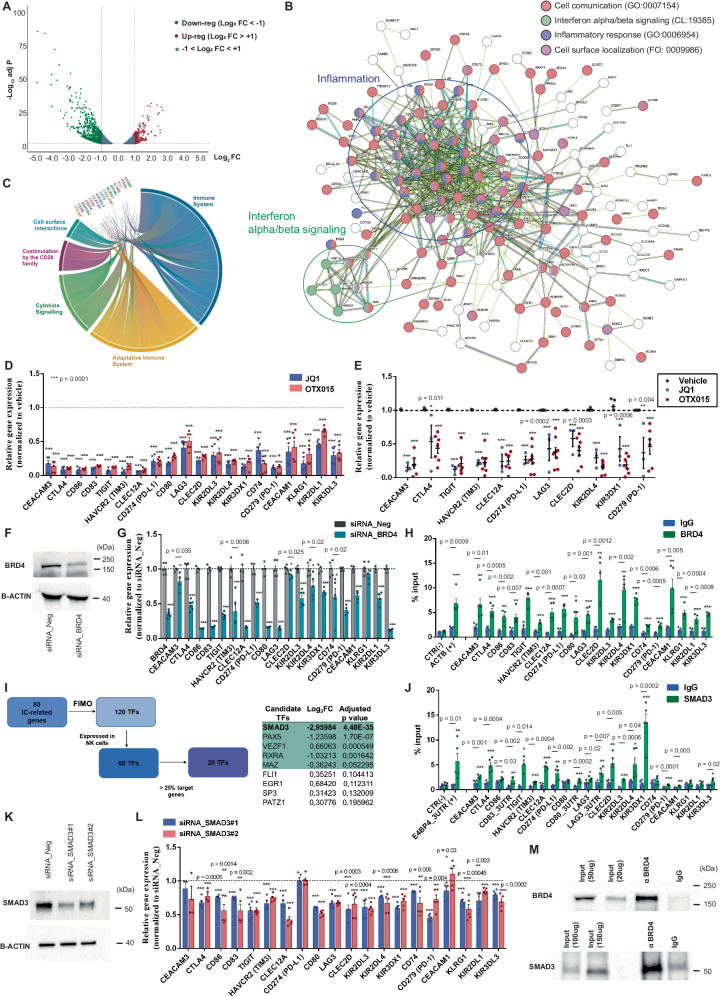
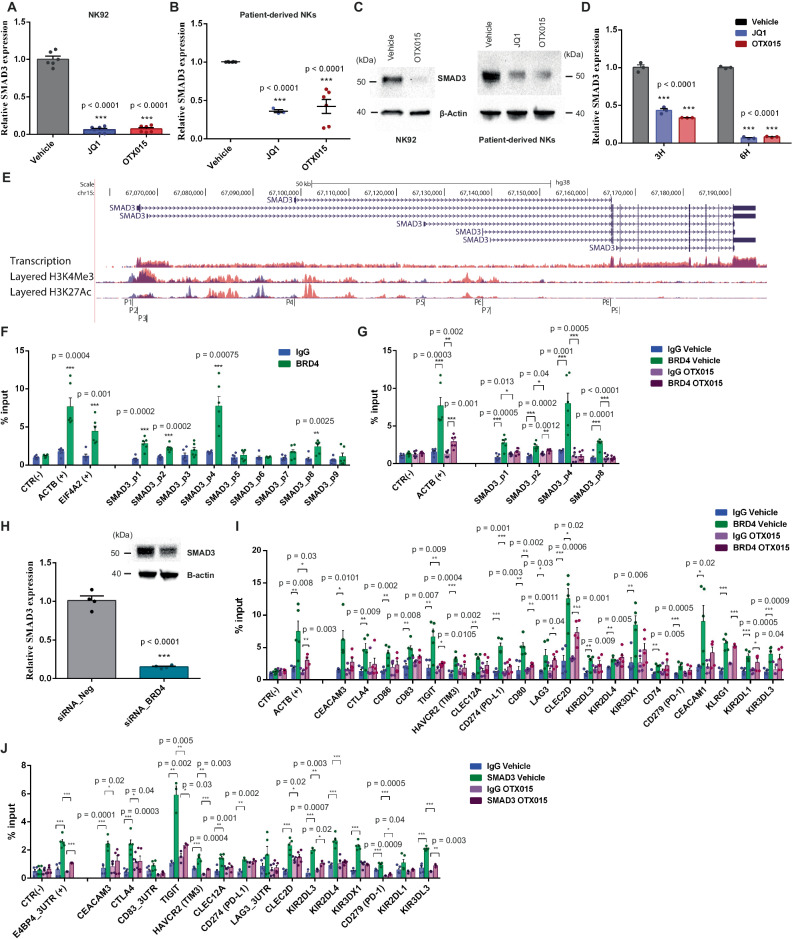
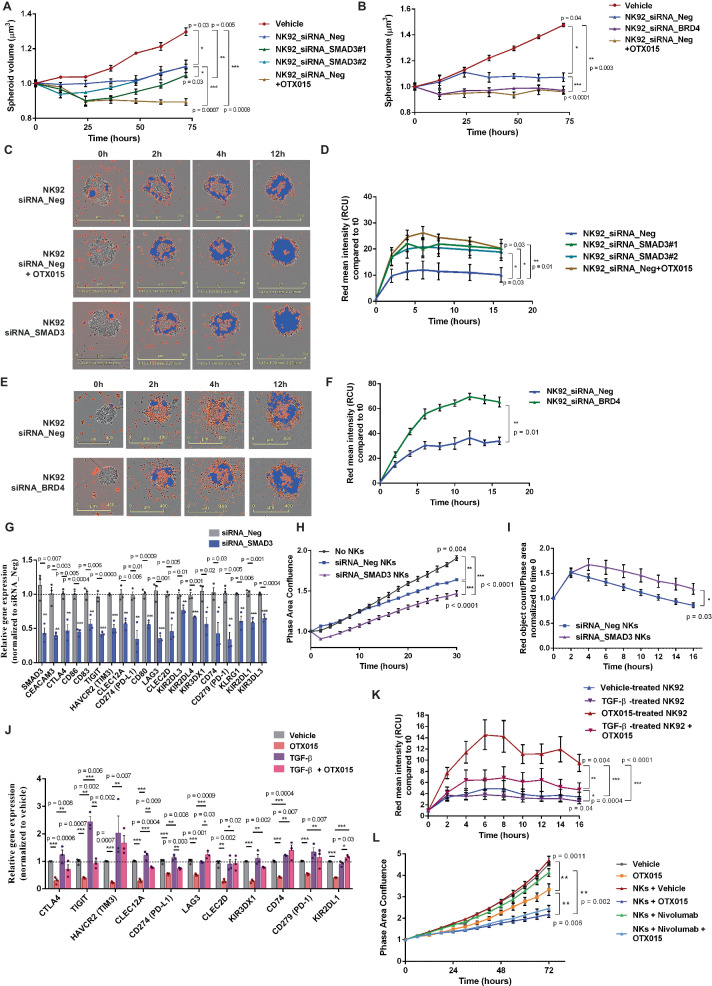
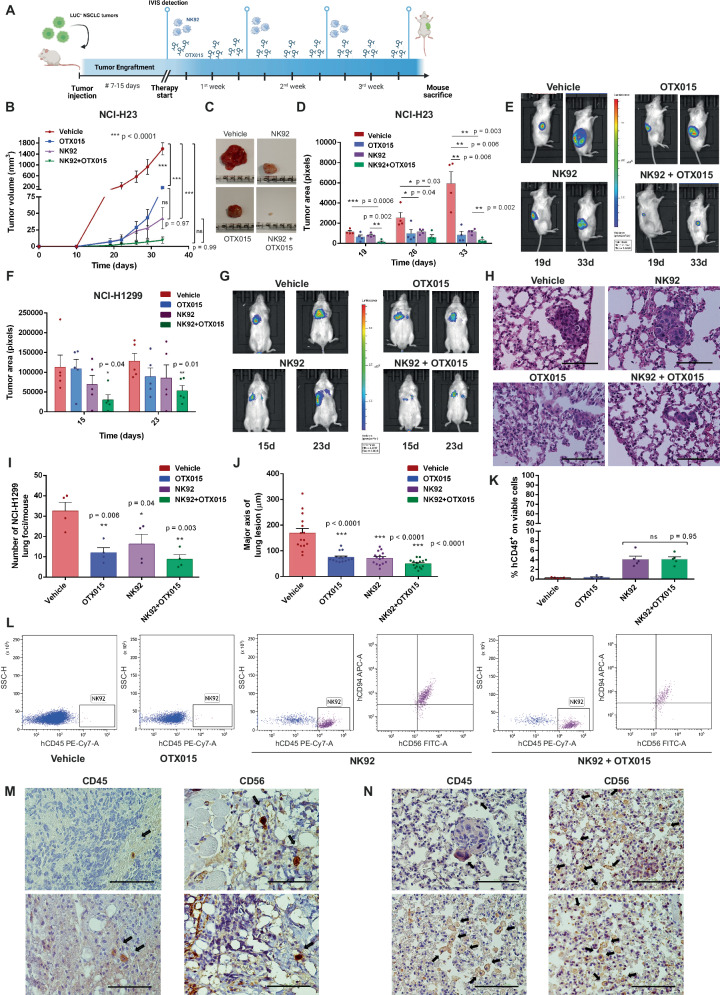
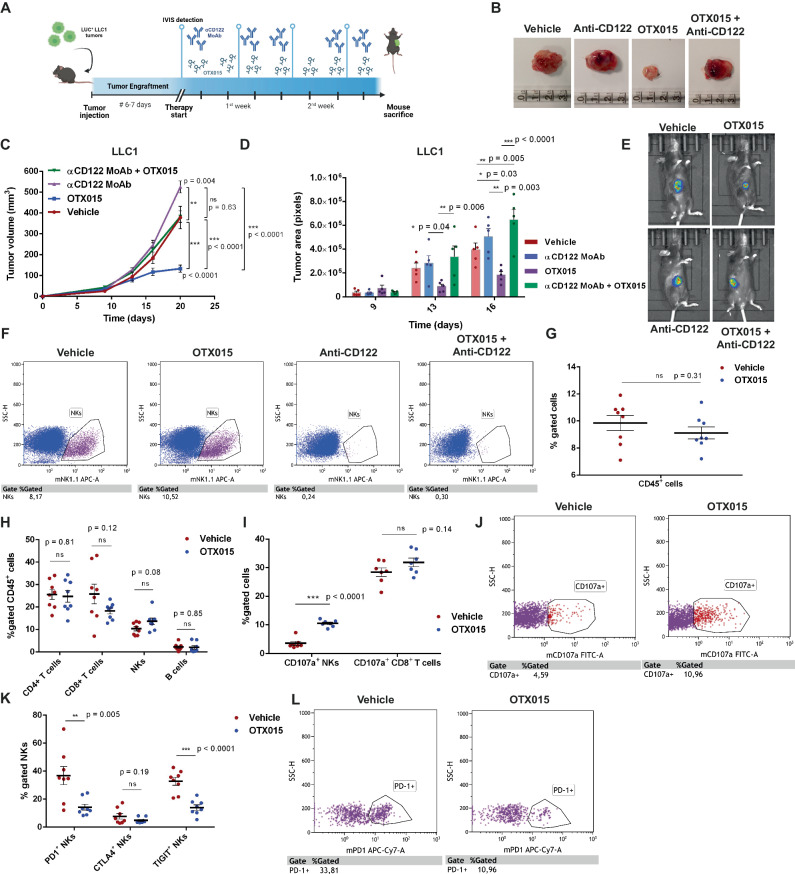
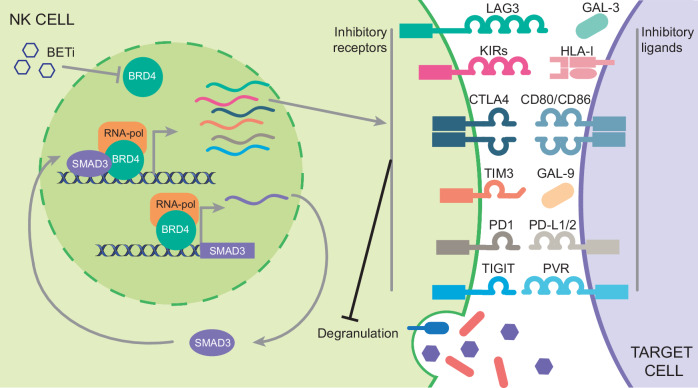
Non-small-cell lung carcinoma (NSCLC) is the most common lung cancer and one of the pioneer tumors in which immunotherapy has radically changed patients' outcomes. However, several issues are emerging and their implementation is required to optimize immunotherapy-based protocols. In this work, we investigate the ability of the Bromodomain and Extra-Terminal protein inhibitors (BETi) to stimulate a proficient anti-tumor immune response toward NSCLC. By using in vitro, ex-vivo, and in vivo models, we demonstrate that these epigenetic drugs specifically enhance Natural Killer (NK) cell cytotoxicity. BETi down-regulate a large set of NK inhibitory receptors, including several immune checkpoints (ICs), that are direct targets of the transcriptional cooperation between the BET protein BRD4 and the transcription factor SMAD3. Overall, BETi orchestrate an epigenetic reprogramming that leads to increased recognition of tumor cells and the killing ability of NK cells. Our results unveil the opportunity to exploit and repurpose these drugs in combination with immunotherapy.


Conflict of interest statement

The authors declare no competing interests.

Figures

Fig. 1
Fig. 1. BETi stimulate NK cytotoxicity toward NSCLC in vitro.
A, B Flow cytometry analysis of different immune cells isolated from NSCLC patient surgical samples after PMA/Ionomycin stimulation for 6h. Gating of IFN-γ+ helper (CD4+), cytotoxic (C8+) T cells or NK cells (CD56+) were analysed for IFN-γ production (A). Quantitation of IFN-γ+ immune cells (B) indicates that NK cells displayed a higher increase of IFN-γ+ cells when treated with BETi compared to vehicle, irrespectively of the tumor histopathological features from which they are isolated (AD n = 4 patients, SQ n = 4 patients, data are shown as mean ± SEM); C Proliferation assays on different NSCLC cell lines (NCI-H23, NCI-H1299) in co-culture with patient-derived total CD45+ cells (Tumor-infiltrating leukocytes, TILs) and BETi (1 µM JQ1 or OTX015). Tumor cell confluence area was measured by EssenBio Incucyte S3 cell-live imaging. BETi significantly improved immune response, by restraining tumor cell proliferation compared to single-agent treatments (n = 3 independent experiments, data are shown as mean ± SEM); D Apoptotic tumor cells (AnnexinV+) were assessed by flow cytometry after 24 h of co-cultures with TILs in presence or not of BETi. Tumor apoptosis (NCI-H1299) was higher in BETi-treated co-cultures. E Purified patient-derived NK cells were sufficient to inhibit tumor proliferation in co-cultures with NSCLC and their effect was enhanced by BETi (n = 6 biological independent samples, data are shown as mean ± SEM); F Tumor apoptosis enhancement by flow cytometry in co-cultures between purified NK cells and NCI-H1299 cells; GI Flow cytometry analysis of NK cell activation markers from co-cultures with NSCLC cells (NCI-H23, NCI-H1299). Surface expression of CD107A (degranulation marker) in NK cells was assessed 24 h after the starting of the co-cultures and was enhanced in presence of BETi (G, H). Combining the quantitation of IFN-γ and CD107A, BETi specifically enhanced the percentage of CD107A+IFN-γ- NK cells, whereas the increase of double positive IFN-γ+ CD107A+ was not significant in co-cultures with NCI-H23 (n = 3 patients, data are shown as mean ± SEM) (I). Two-side Student’s t-test was applied for all comparisons in this figure. Source data are provided as a Source Data file.
Fig. 2
Fig. 2. BETi reactivate autologous NK cytotoxicity toward patient-derived spheroids.
A Representative images of CTOS derived from NSCLC surgical specimens used in co-cultures with autologous red-stained NK cells (500 NK cells/well) acquired with Incucyte 2020B software (10x magnification, scale bar 200 µm). Purple arrows indicate NK cells that are forming immunological synapses with tumor cells; B Quantitation of CTOS 3D-growth in these co-cultures. Spheroid volume was calculated at each time point and normalized for T0 volume. Autologous NK cells were pre-treated with BETi (1 µM OTX015) or vehicle 24 h before the co-culture and during the co-culture. BETi-treated NK cells were significantly more efficient in dissolving CTOS integrity compared to untreated NK cells or BETi alone (n = 6 spheroids per group from a single AD patient, error bars indicate mean ± SEM. Vehicle vs. OTX015 ***p = 0.0008; Vehicle vs. NKs + Vehicle **p = 0.0012; Vehicle vs. NKs + OTX015 ***p = 0.0003; OTX015 vs. NKs + OTX015 **p = 0.0022; NKs + Vehicle vs. NKs + OTX015 **p = 0.0021); C Quantitation of immunological synapse formation in these autologous 3D co-cultures (n = 3 co-cultures per group from a single AD patient, data are shown as mean ± SEM. NKs + Vehicle vs. NKs + OTX015 **p = 0.0098); DF Flow cytometry analysis of NK cell activation after 24 h of co-cultures with autologous CTOS. Surface expression of CD107A showed that BETi enhanced NK degranulation as increased CD107A Mean Fluorescence Intensity (MFI) (D) or percentage of CD107A+ cells (E). Combining the quantitation of IFN-γ and CD107A (F), BETi enhanced the percentage of CD107A+IFN-γ- NK cells, whereas double negative IFN-γ- CD107a- cells were impaired (n = 4 AD patients, data are shown as mean ± SEM). Two-side Student’s t-test was applied for all comparisons in this figure. Source data are provided as a Source Data file.
Fig. 3
Fig. 3. BETi orchestrate the down-regulation of an NK exhaustion signature which is dependent on SMAD3.
A Volcano plot displaying significantly DEGs between OTX015- and vehicle-treated NK92 (3037 genes with adjusted p-value < 0.05; Green = Down-regulated genes with Log2FC < −1, Red = Up-regulated with Log2FC > 1, Blue = genes with |Log2FC | < 1); B STRING Network analysis of top-scoring down-regulated genes from RNA-seq (Log2FC ≤ − 1.0). Genes belonging to enriched GO pathways are highlighted; C Chord diagram illustrating top-scoring down-regulated genes belonging to immune pathways from enrichment analysis using Reactome (Immune system R-HSA-168256; Adaptive Immune system R-HSA-1280218; Cytokine Signaling R-HSA-1280215; Costimulation by CD28 family R-HSA-388841; Cell surface interactions R-HSA-202733). The arch size is proportional to gene deregulation; D IC/iKIR expression in BETi-treated NK92 by qPCR. Values were normalized for housekeeping gene expression and expressed as fold change (n = 6 biological independent samples); E The reduced expression of a selection of ICs/iKIRs was validated by qPCR in purified NKs from surgical samples (n = 7 patients); F Representative WB depicting BRD4KD (~200 kDa) 72 h after transfection with siRNAs. β-actin was used as loading control; G IC expression in NK92 carrying BRD4KD by qPCR (n = 6 biological independent samples); H ChIP of BRD4 identified its binding on IC/iKIR promoter regions in NK92. Actin B (ACTB) promoter was used as positive control, whereas an intergenic region was the negative control (CTR-). Values are expressed as % of input (n = 5 biological independent samples); I Prediction of candidate transcription factors (TFs) that regulate the 80-gene signature associated with NK exhaustion. TF ranking was obtained according to the adjusted p-value and log2FC from RNA-seq in NK92; J ChIP of SMAD3 on signature gene promoters or 3’UTRs in NK92. E4BP4 3’UTR was used as positive control (n = 5 biological independent samples); K Representative WB of SMAD3 (~52 kDa) in NK92 after siRNA-mediated SMAD3KD; L IC/iKIR expression in SMAD3KD NK92 by qPCR (n = 5 biological independent samples); M Representative images of co-immunoprecipitation (Co-IP) of SMAD3 and BRD4 in NK92. All data are shown as mean ± SEM. Two-side Student’s t-test was applied for all comparisons in this figure. If not specified, ***p ≤ 0.0001. Source data are provided as a Source Data file.
Fig. 4
Fig. 4. BRD4 regulates SMAD3 expression in NKs by direct transcriptional control.
A, B Reduction of SMAD3 expression in NK92 (A) or patient-purified NKs (B) after 24 h of BETi treatment detected by qPCR. Values are normalized for housekeeping gene expression and expressed as fold change (A n = 6 biological independent samples, B n = 6 patients, data are shown as mean ± SEM); C Representative WB of SMAD3 (52kDa) in NK92 or patient-purified NKs after BETi. β-actin was the loading control; D Time course of SMAD3 reduced expression assessed by qPCR in NK92 treated with BETi (n = 3 independent experiments, data are shown as mean ± SEM); E Illustration of the genomic region encoding for SMAD3. The layered transcription, H3K4Me3 and H3K27Ac tracks are relative to GM12878 (orange) and K562 (violet) cells. The highlighted promoter sequences (P1-P9) were analysed in NK92 by ChIP to detect BRD4 binding. Images were modified from Genome Browser; F ChIP identified BRD4 binding on promoter regions of SMAD3 in NK92. ACTB promoter was the positive control, whereas an intergenic region was used as negative control (CTR-). Values are expressed as % of input (n = 6 biological independent samples, data are shown as mean ± SEM); G Treatment with 1 µM OTX015 for 48 h induced BRD4 detachment from SMAD3 promoter regions (n = 6 biological independent samples, data are shown as mean ± SEM); H SMAD3 transcription was inhibited in BRD4KD NK92 as detected by qPCR (n = 4 independent experiments, data are shown as mean ± SEM) and by WB; I ChIP analysis of BRD4 in NK92 cells treated with OTX015 for 48 h identified its detaching from target regulatory regions (n = 5 biological independent samples, data are shown as mean ± SEM); J ChIP analysis of SMAD3 in NK92 treated with OTX015 for 48 h indicated the reduction of the TF occupancy on NK exhaustion gene promoters or 3’UTRs. E4BP4 3’UTR was the positive control (n = 5 biological independent samples, data are shown as mean ± SEM). Two-side Student’s t-test was applied for all comparisons in this figure. If not specified, ***p ≤ 0.0001. Source data are provided as a Source Data file.
Fig. 5
Fig. 5. SMAD3KD or BRD4KD increases NK immunological synapses toward NSCLC.
A 3D-growth assays on NCI-H23 spheroids in co-culture with red-stained SMAD3KD NK92. Spheroid volume was calculated at each time point. NKs were pre-treated with OTX015 or vehicle 24 h before and during co-culture. SMAD3KD increased NK92 anti-tumor efficiency but to a less extent than OTX015 (n = 6 spheroids per group); B 3D-growth assays on NCI-H23 spheroids in co-culture with red-stained BRD4KD NK92 (n = 6 spheroids per group); C, D Immunological synapse formation between red-stained NK92 and NCI-H23 spheroids was assessed by quantifying Red Fluorescence mean intensity (RCU) within the brightfield area of each spheroid (4 x magnification, scale bar 600 µm). Blue masks correspond to quantified areas. SMAD3KD increases NK92 ability to form immunological synapses, similarly to BETi (n = 4 spheroids per group); E, F Immunological synapse formation between red-stained BRD4KD NK92 and NCI-H23 spheroids (4x magnification, scale bar 400 µm). BRD4KD enhanced immunological synapse formation (n = 7 spheroids per group); G SMAD3KD obtained by siRNAs in patient-derived intratumor NKs down-regulated the expression of ICs/iKIRs (n = 3 patients); H, I Representative proliferation assay of co-cultures using SMAD3KD primary NKs and NCI-H23 cells (H, n = 4 co-cultures from a single patient; I n = 5 co-cultures from a single patient). NKs displayed an increased anti-tumor activity (H) and an improved ability to form immunological synapses (I); J qPCR analysis of SMAD3/BRD4 common target expression in NK92 after 6 h treatment with the SMAD3 inducer TGF-β (5ng/ml) or OTX015 (1 µM) or their combination (n = 3 independent experiments); K Pre-treatment with TGF-β (5 ng/ml) or OTX015 (1 µM) or both was administered to NK92 16 h prior the starting of the co-culture with NCI-H23. TGF-β impaired NK ability to recognize tumor cells and immunological synapse formation in the early phases of the co-cultures, drastically affecting OTX015 efficacy (n = 8 spheroids per group); L Representative proliferation assay of co-cultures using patient-derived intratumor NKs and NCI-H23 cells. NK anti-tumor activity was assessed in the presence of BETi (1 µM OTX015) and/or the anti-PD-1 inhibitor Nivolumab (15 µg/ml) (n = 3 co-cultures from a single patient). All data are shown as mean ± SEM. Two-side Student’s t-test was applied for all comparisons in this figure. If not specified, ***p ≤ 0.0001. Source data are provided as Source Data file.
Fig. 6
Fig. 6. BETi maximize the efficacy of an adoptive NK cell therapy in mice.
A Overview of xenograft experiments. Therapy was started when tumor growth was detected by bioluminescence signal (IVIS), 13 or 7 days after tumor injection for NCI-H23 or NCI-H1299, respectively. Mice were euthanized after 3 or 2 weeks from the start of the therapy for NCI-H23 or NCI-H1299, respectively. Image was created by Biorender.com; BE NCI-H23-LUC subcutaneous growth was monitored with digital calliper (B-C).Time is expressed as days from tumor injection (B, n = 5 mice per group, two-way ANOVA with multiple comparison (Tukey test) was applied). IVIS system monitored tumor spreading and invasion (DE). The combination of NK92 administration and OTX015 (5 mg/Kg) was more efficient in restraining tumor growth compared to single treatments or vehicle (D, n = 4 mice per group); F, G IVIS system was applied to monitor NCI-H1299-LUC orthotopic lung engraftment. Time is expressed as days from tumor injection. The combined treatment displayed a higher anti-tumor effect compared to other arms (n = 5 mice per group); HJ Tumor lung lesions were analysed by pathological assessment of H&E slides (40x magnification, scale bar 100 µm, H). NCI-H1299-LUC lung foci number (I, n = 4 mice per group) and the major axis of lesions (J, n = 15 lesions per group) were reduced in mice administered with NK92 and OTX015; K, L NK92 infiltration in tumors from NCI-H23 xenografts was quantified by flow cytometry (K). NK92 tumor recruitment was not affected by OTX015 (results are mean of % hCD45+ cells on total viable cells, n = 5 mice per group, L); M, N Representative IHC images of NCI-H23 tumors (M) or lungs collected from NCI-H1299 xenografts (N). For each specimen, two slides were stained with anti-hCD45 or anti-hCD56 to spatially identify NK92 infiltration (40 x magnification, scale bar 100 µm). Black arrows highlight NK92. IHC staining was performed on 5 mice per group. All data in this figure are shown as mean ± SEM. If not otherwise specified, two-side Student’s t-test was applied. If not specified, ***p ≤ 0.0001, ns: not significant. Source data are provided as a Source Data file.
Fig. 7
Fig. 7. NKs are required to maximize BETi anti-tumor activity in NSCLC syngenic models.
A Overview and timeline of the syngenic models developed using the murine LLC1-LUC1 cell line. After subcutaneous engraftment (1-week post tumor injection), mice were randomized in different experimental groups (n = 8 for each arm) and administered with vehicle, OTX015 (5 mg/Kg), anti-CD122 MoAb (300 µg/mouse) or their combination. Mice were euthanized 21 days after tumor injection. The image was created by Biorender.com; B Representative images of the different tumor growth at mouse sacrifice; CE Tumor growth was monitored with a digital caliper (C, n = 6 mice per group, two-way ANOVA with multiple comparison (Tukey test) was applied) and by quantifying the in vivo tumor bioluminescence with IVIS system (D, E, n = 5 mice per group, two-way ANOVA with multiple comparison (Tukey test) was applied). Time is expressed as days from tumor injection; F The efficiency of NK cell depletion induced by anti-CD122 MoAb was confirmed in tumor specimens by flow cytometry analysis of murine NKs (CD45+NK1.1+cells); G Immune infiltration (CD45+ cells) in mouse tumors was assessed by flow cytometry analysis. No differences were observed following OTX015 administration (n = 8 mice per group); H Quantitation of different TIL subsets comparing OTX015- to vehicle-treated mice by flow cytometry analysis. The main detected populations were T cells (CD4+ and CD8+ subsets) and NKs, whereas B cells (CD19+) were poorly represented in these tumors. BETi did not significantly affect the percentage of infiltration/recruitment of different cell types (n = 8 mice per group); I, J The degree of activation of cytotoxic populations, CD8 T lymphocytes and NKs, was measured by CD107a surface expression in mouse tumors by flow cytometry. OTX015 specifically increased NK cell degranulation (n = 7 mice per group); K, L IC expression was evaluated by flow cytometry on tumor-infiltrated NKs and detected down-regulated by OTX015 (n = 8 mice per group, data are shown as mean ± SEM). All data in the figure are shown as mean ± SEM. If not otherwise specified, two-side Student’s t-test was applied. ns: not significant. Source data are provided as a Source Data file.
Fig. 8
Fig. 8. Graphical Illustration of the multilayer regulation orchestrated by BRD4 on SMAD3 expression and activity in NK cells.
SMAD3 is a direct transcriptional target of BRD4 in NK cells. In addition, BRD4 interacts with SMAD3 and their concerted activity regulates the expression of NK inhibitory receptors. This limits NK cytotoxicity by restraining the recognition of target cells. BETi restrain the transcriptional activity of both BRD4 and SMAD3, inducing a down-regulation of NK inhibitory molecules, including several ICs and iKIRs. The graph illustrates the main inhibitory receptors that are repressed by BETi and that we found under the control of BRD4/SMAD3 cooperation, together with the counterpart interacting ligands expressed by tumor cells.

References

    1. Ho C, Tong KM, Ramsden K, Ionescu DN, Laskin J. Histologic classification of non-small-cell lung cancer over time: reducing the rates of not-otherwise-specified. Curr. Oncol. 2015;22:e164–e170. doi: 10.3747/co.22.2339. - DOI - PMC - PubMed
    1. Guo H, et al. Biomarker-targeted therapies in non-small cell lung cancer: current status and perspectives. Cells. 2022;11:3200. doi: 10.3390/cells11203200. - DOI - PMC - PubMed
    1. Low JL, Walsh RJ, Ang Y, Chan G, Soo RA. The evolving immuno-oncology landscape in advanced lung cancer: first-line treatment of non-small cell lung cancer. Ther. Adv. Med Oncol. 2019;11:1758835919870360. doi: 10.1177/1758835919870360. - DOI - PMC - PubMed
    1. Xiong W, Zhao Y, Du H, Guo X. Current status of immune checkpoint inhibitor immunotherapy for lung cancer. Front. Oncol. 2021;11:704336. doi: 10.3389/fonc.2021.704336. - DOI - PMC - PubMed
    1. Horvath L, Thienpont B, Zhao L, Wolf D, Pircher A. Overcoming immunotherapy resistance in non-small cell lung cancer (NSCLC) - novel approaches and future outlook. Mol. Cancer. 2020;19:141. doi: 10.1186/s12943-020-01260-z. - DOI - PMC - PubMed

MeSH terms