. 2024 Mar 22;15(1):2569.
doi: 10.1038/s41467-024-46763-1.

Defective mitochondria remodelling in B cells leads to an aged immune response

Affiliations

Defective mitochondria remodelling in B cells leads to an aged immune response

Marta Iborra-Pernichi et al. Nat Commun. .

Abstract

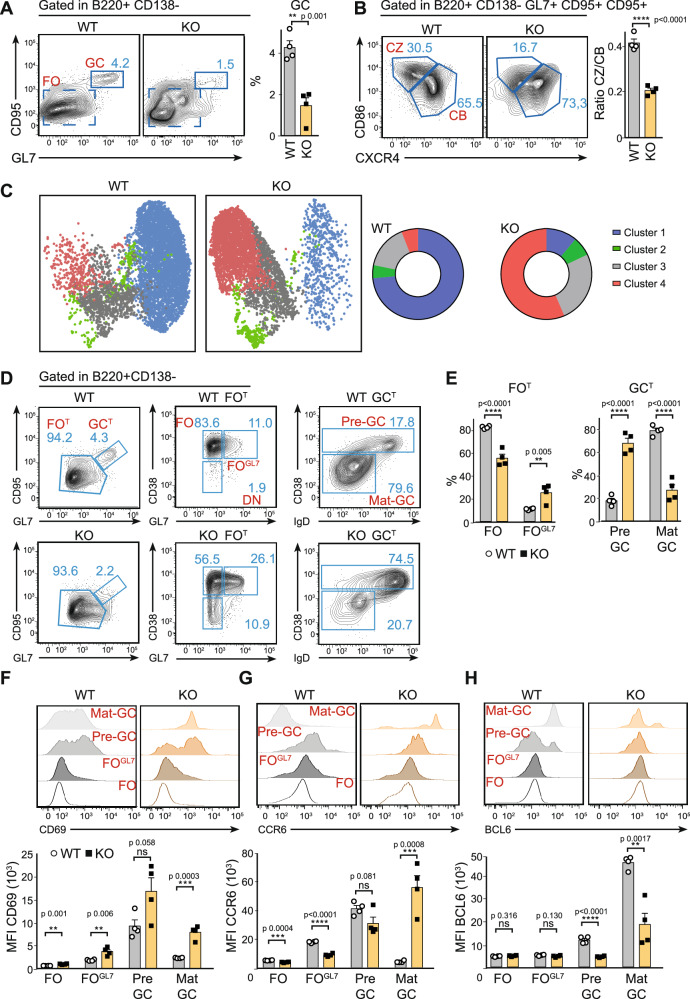
The B cell response in the germinal centre (GC) reaction requires a unique bioenergetic supply. Although mitochondria are remodelled upon antigen-mediated B cell receptor stimulation, mitochondrial function in B cells is still poorly understood. To gain a better understanding of the role of mitochondria in B cell function, here we generate mice with B cell-specific deficiency in Tfam, a transcription factor necessary for mitochondrial biogenesis. Tfam conditional knock-out (KO) mice display a blockage of the GC reaction and a bias of B cell differentiation towards memory B cells and aged-related B cells, hallmarks of an aged immune response. Unexpectedly, blocked GC reaction in Tfam KO mice is not caused by defects in the bioenergetic supply but is associated with a defect in the remodelling of the lysosomal compartment in B cells. Our results may thus describe a mitochondrial function for lysosome regulation and the downstream antigen presentation in B cells during the GC reaction, the dysruption of which is manifested as an aged immune response.


Conflict of interest statement

The authors declare no competing interests. R.J.A. discloses a potential conflict of interest as the developer and patent holder of SCENITHTM and clone R4743L-E8 adapted for SCENITH. Plans are underway to license these to GammaOmics, a company yet to be established, of which R.J.A. will be a partner. Currently, no commercial license exists, and the company is not formally established.

Figures

Fig. 1
Fig. 1. Tfam deletion in B cells leads to failure in mitochondrial remodelling.
A Left, flow cytometry plots showing marginal (MZ, IgMhigh,CD21high) and follicular (FO IgM+, CD21low) zone within the B2 cell population (B220+CD93) in WT and Tfam KO mice. Right, the percentage of total B cells (gated as B220+) and B2 cells (FO, MZ). B Relative Tfam mRNA levels determined by RT-PCR in sorted B220+, CD4+, and CD8+ T cells from WT and Tfam KO mice. C Mitochondrial status. From left to right: bar charts indicating mean fluorescence intensity (MFI) values of Mitotracker Green (MM), Mitogreen red CMXROS (MMP), and total cellular ROS (ROS) quantified by flow cytometry. WT and Tfam KO B cells were purified and unstimulated (NS) or 24 h stimulated with anti-CD40 and anti-IgM (STIM). D Left, representative electron microscopy fields of WT and Tfam KO B cells in pre- (NS) and post-stimulation (STIM) conditions. Right, a bar chart showing the percentage of mitochondria assigned to morphological classes I–III as described in Scorrano et al. Morphometric analysis was blinded and performed on randomly selected electron microscopy fields from three independent experiments. E Immunodetection of the indicated proteins after Blue Native page of dodecyl maltoside (DDM) -solubilized mitochondria from WT and Tfam KO cells pre- and post-stimulation with anti-CD40 and anti-IgM. Each sample is a pool of at least six mice per group (WT and KO non-stimulated and 24 h stimulated) and is a representative experiment from two independent experiments. F Quantification of ATP rate derived from Mitochondrial respiration and Glycolysis in non-stimulated (NS) or 24 h stimulated (STIM) purified B cells from WT and Tfam KO mice. G Left, a representative oxygen consumption rate (OCR) graph was obtained from extracellular flux assay in NS and STIM purified B cells. The OCR was measured before and after injection of oligomycin (O), FCCP (F), and rotenone plus antimycin A (R&A). Right, bar charts indicating levels of basal respiration, maximal respiration, and ATP production of NS and STIM purified B cells from WT and Tfam KO mice. H Bar charts indicating the relative amount of compounds found in the TCA cycle in cell lysates of 24 h-stimulated B cells from WT and Tfam KO mice. In panels 1AC, FH, bar charts show the quantification of one representative experiment out of three with at least three biological replicates, and error bars represent mean ± SEM (Additionally, in panel H, each dot represents one mouse and is the average of three technical replicates). Panel B and D two-way ANOVA, with additional Tukey’s multiple comparisons test, was conducted. For the rest of the panels, an unpaired two-tailed t-test was conducted. P values: *p < 0.05, **p < 0.01, ***p < 0.001 and ****p < 0,0001. See also Suppl. Figs. 2–8. Source data are provided as a Source Data file.
Fig. 2
Fig. 2. Failure in mitochondrial remodelling leads to a blockage at the pre-GC stage.
A Left, flow cytometry plots showing splenic germinal centre (GC, CD95+, GL7+) and FO (CD95, GL7) B cell populations 7 days post-immunisation (p.i). Right, corresponding bar charts indicate the proportion of GC B cells (gated in B220+CD138). B Left, flow cytometry analysis of the principal populations of GC indicated as centrocytes (CZ, CD86hi/CXCR4lo) and centroblasts (CB, CD86lo/CXCR4hi) of WT and Tfam KO mice. Right, a graph showing the CZ/CB ratio in GC 7 days p.i. C Unsupervised uniform manifold approximation and projection (UMAP) and FlowSOM algorithms were used in OMIQ, which yielded distinct clusters in WT and Tfam KO mice 7 days p.i. The left panel shows the UMAP distribution of up to 3.000 downsampled events based on CD38, IgD, Bcl6, CCR6 and CXCR4 markers and gated manually on total GC (B220+ CD138 GL7+ CD95+). The right panel shows charts of the proportion of clusters generated by FSOM analysis in WT and Tfam KO samples. D, E Flow cytometry plots showing (left to right) total FO (FOT) and total GC (GCT) gated in B220+CD138- cells. FO (CD38+, GL7), FOGL7 (CD38+, GL7+) and DN (CD38, GL7) gated in FOT. Pre-GC (CD38+) and Mat-GC (CD38IgD) gated on GCT. E Bar charts indicate the proportion of each cell population gated on panel (D). Data were analysed using two-way ANOVA and are representative of three independent experiments. FH Histograms and quantification of activation markers CD69 (F), CCR6 (G) and Bcl6 (H) in cell populations gated on panel (D) were analysed by flow cytometry. See Suppl. Fig. 1A for gating strategy. In all panels, bar charts show the quantification of one representative experiment out of three, with at least three biological replicates and error bars represent mean ± SEM. Each dot represents one mouse. For panel 2E two-way ANOVA, with additional Tukey’s multiple comparisons test. For the rest of the panels, unpaired two-tailed t-test: *p < 0.05, **p < 0.01, ***p < 0.001 and ****p < 0,0001 See also Suppl. Figs. 9–11. Source data are provided as a Source Data file.
Fig. 3
Fig. 3. Tfam deletion in B cells triggers metabolic plasticity to maintain bioenergetic homoeostasis.
A Graphs indicating the levels of total ATP upon incubation with quinacrine (left) and levels of pS6 protein (right) during GC maturation in WT and Tfam KO mice 7 days p.i. B Volcano plot represents the distribution of differentially expressed genes (DEGs) between Tfam KO and WT B cells 24 h post-stimulation using the Wald test. Adjusted p values (padj) were calculated using the Benjamin–Hochberg correction. The dotted lines bound the minimal absolute log fold-change (logFC) of 1 for the most differentially expressed genes. Red dots represent significantly upregulated DEGs with a padj value <0.05 and a logFC >1, totalling 438. Green dots represent significantly downregulated DEGs with a padj value <0.05 and a logFC <−1, totalling 178. Blue dots represent genes falling under the threshold. On the bottom, a table lists mitochondria-related, significantly depleted pathways defined by Gene Set Enrichment Analysis (GSEA) using the Mitocarta 3.0 database. Normalised enriched scores (NES) according to Kolmogorov–Smirnov GSEA statistics and adjusted p values (padj) with Benjamini–Hochberg correction are included. C Gene set enrichment analysis (GSEA) plots for Tfam KO B cells vs WT B cells compared to Tfam KO macrophages vs their WT counterparts. Diagrams depict the similarity in the enrichment subset of upregulated and downregulated genes between Tfam KO vs WT B cells and Tfam KO vs WT macrophages. D Table obtained from GSEA for Gene Ontology terms (GO) of the differential gene expression data from Tfam KO vs WT B cells using the biological processes (BP) and cellular components (CC) gene sets. Normalised enrichment scores (NES) according to Kolmogorov–Smirnov GSEA statistics and padj (corrected using the Benjamini–Hochberg method), are listed. E Metabolic profile of B cell populations along GC maturation (FO to mat-GC) obtained by SCENITH as a result of incubation with different inhibitors in WT and Tfam KO mice 7 days p.i. F Metflow profile of B cell populations along GC maturation (FO to mat-GC) obtained by the flow cytometry analysis of eight metabolic enzymes on WT and Tfam KO 7 days p.i. In panels 3A and E, bar charts show the quantification of one representative experiment out of three with at least three independent experiments, and error bars represent mean ± SEM. Each dot represents one mouse. Unpaired two-tailed t-test: *p < 0.05, **p < 0.01, ***p < 0.001 and ****p < 0,0001. See also Suppl. Figs. 12–14. Source data are provided as a Source Data file.
Fig. 4
Fig. 4. Mitochondria shapes antigen presentation by B cells.
A Left, representative flow cytometry plots showing T follicular helper cells (Tfh, CD4+, CD44+ CXCR5+, PD1+) and, right, percentage quantification in WT and Tfam KO 7 days p.i. See Suppl. Fig. 1A for gate strategy. B Representative histograms of Bcl6 protein levels on Tfh gated on panel (A). Bar charts show the quantification of MFI in WT and Tfam KO Tfh 7 days p.i. C Left, representative plots of CFSE and CTV dilutions of WT, Tfam KO B, and OTII CD4+ T cells after 3-days co-culture. Bar charts indicate the number of divisions of each population. See Suppl. Fig. 1B for gate strategy. D Representative histograms of Bcl6 protein levels of co-cultured OTII CD4 T cells of panel (C). Bar charts show the quantification of MFI. E Left, flow cytometry plot of iGB cells cultured with IL-4 for 4 days gated as CD95+, GL7+ within B220+ population. Right, bar charts indicate the percentage of iGB cells and Bcl6 protein levels of iGB of WT and Tfam KO. F Antigen internalisation was measured by FACS according to biotinylated anti-IgM (anti-lgM-biotin) on the B cell surface. Anti-lgM-biotin was detected using streptavidin (Strep) fluorescently labelled. Representative histogram (left) and bar chart (right) showing data of Strep MFI on WT and Tfam KO-purified B cells. GI Antigen polarisation and co-localisation with lysosomes. G Confocal images (100x magnification) of WT and Tfam KO B cells stimulated with AF647-conjugated anti-IgM for 30 min. The antigen is detected as green dots. MTOC (blue) was identified with α-tubulin and polarisation was determined by the proximity of the antigen to the MTOC. LAMP1 (red) indicates lysosomes. The multi-colour bar chart stated the degree of depolarised Ag (red), intermediate polarised Ag (yellow), and polarised antigen (green). H The lysosome number was determined using Fiji software from images of panel I. The co-localisation of antigen and lysosomes was determined by the Fiji JaCOP plug-in. PI indicates Pearson’s index, and M1-M2 shows Mander’s coefficient. J Antigen degradation (Degr band) was detected using streptavidin-HRP in non-stimulated purified B cells from WT and Tfam KO mice after incubation with biotinylated anti-IgM for 4 h. Vinculin was used as a loading control. IgM-Heavy chain: HC IgM-light chain: LC. The bar chart indicates the fold-change degradation normalised to Vinculin. K, L Bar charts indicate lysotracker and magic red levels measured by FACS along GC maturation (FO to mat-GC) in WT and Tfam KO mice 7 days p.i. M Scatter plot illustrating the most-enriched and most-depleted lysosome-related pathways obtained through GSEA for Gene Ontology terms and Reactome pathways. The vertical axis displays the enriched pathway categories, while the horizontal axis represents the normalised enriched score (NES) according to the Kolmogorov–Smirnov GSEA statistical test. The dot size represents the range of p-adjusted values obtained by the Benjamini–Hochberg correction. The colour coding of the dots indicates the number of related genes within each pathway, with darker, purple dots indicating bigger sizes. In panels 4AG, L, bar charts show the quantification of one representative experiment out of three, and error bars represent mean ± SEM, Each dot represents one mouse. In panel 2H and I, up to 100 cells were counted from WT and KO mice from three independent experiments. An unpaired two-tail t-test was conducted. For panel 4J, bar charts show the quantification of one representative experiment out of three with at least three biological replicates; and two-way ANOVA was conducted with Tukey’s multiple comparisons test. P values *p < 0.05, **p < 0.01 and ***p < 0.001. See also Suppl. Fig. 15. Source data are provided as a Source Data file.
Fig. 5
Fig. 5. Defects in mitochondria remodelling trigger ageing of the immune response.
A Flow cytometry analysis of splenic antibody-secreting cells (ASC, CD138+ IgD) and percentage quantification of total ASC 7 days p.i. B Representative flow cytometry plots showing memory B cells (MC, CD38+ IgD), FO cells (CD38+ IgD+) and double-negative cells (DN, IgD- CD38); bar charts indicate the percentage of FO, MC and DN cells from WT and Tfam KO mice 7 days after immunisation with SRBC. C Met-flow profile of Follicular (FO), total Germinal centre (GC), memory (MC) and double-negative (DN) B cell populations obtained by flow cytometry analysis of eight metabolic enzymes on WT and Tfam KO 7 days p.i. The bubble plot represents the mean value of three biological replicates. D Flow cytometry analysis of ABC features in DN population. Top representative histograms of CD23, CD21, CD11c and T-bet levels in WT FO and DN cells. The bottom bar chart indicates the fold increase of each value from FO. E Dot plot representation of Tbet and CD11c distribution in DN and MC (panel B) from immunised WT and KO mice. The bar chart indicates the proportion of single-positive Tbet, single-positive CD11c and double-positive cells. F Dot plot representation of Tbet+ population in isolated B cells cultured for 3 days with either IgM/CD40 or CpG, labelled with CTV. The bar chart indicates the percentage of total Tbet+ cells in B cells of WT and KO mice. In panels 5A, B, DF, bar charts show the quantification of one representative experiment out of three, and error bars represent mean ± SEM. Each dot represents one mouse. The bubble plot from panel C represents the mean of three biological replicates, normalised to FO WT B cell population to obtain the fold-change. In panel A, D and F unpaired two-tail t-test was conducted; for panel B and E two-way ANOVA was conducted with Tukey’s multiple comparisons test:*p < 0,05, ***p < 0.001 and ****p < 0,0001. See also Suppl. Figs. 16–19. Source data are provided as a Source Data file.

References

    1. Weisel F, Shlomchik M, Memory B. Cells of mice and humans. Annu. Rev. Immunol. 2015;35:1–30. - PubMed
    1. Nutt SL, Hodgkin PD, Tarlinton DM, Corcoran LM. The generation of antibody-secreting plasma cells. Nat. Rev. Immunol. 2015;15:160–171. doi: 10.1038/nri3795. - DOI - PubMed
    1. Cyster JG, Allen CDC. B cell responses: cell interaction dynamics and decisions. Cell. 2019;177:524–540. doi: 10.1016/j.cell.2019.03.016. - DOI - PMC - PubMed
    1. Akkaya M, Kwak K, Pierce SK. B cell memory: building two walls of protection against pathogens. Nat. Rev. Immunol. 2020;20:229–238. doi: 10.1038/s41577-019-0244-2. - DOI - PMC - PubMed
    1. Young C, Brink R. The unique biology of germinal center B cells. Immunity. 2021;54:1652–1664. doi: 10.1016/j.immuni.2021.07.015. - DOI - PubMed