. 2024 Mar 22;15(1):2581.
doi: 10.1038/s41467-024-46835-2.

Cancer cell genetics shaping of the tumor microenvironment reveals myeloid cell-centric exploitable vulnerabilities in hepatocellular carcinoma

Affiliations

Cancer cell genetics shaping of the tumor microenvironment reveals myeloid cell-centric exploitable vulnerabilities in hepatocellular carcinoma

Christel F A Ramirez et al. Nat Commun. .

Abstract

Myeloid cells are abundant and plastic immune cell subsets in the liver, to which pro-tumorigenic, inflammatory and immunosuppressive roles have been assigned in the course of tumorigenesis. Yet several aspects underlying their dynamic alterations in hepatocellular carcinoma (HCC) progression remain elusive, including the impact of distinct genetic mutations in shaping a cancer-permissive tumor microenvironment (TME). Here, in newly generated, clinically-relevant somatic female HCC mouse models, we identify cancer genetics' specific and stage-dependent alterations of the liver TME associated with distinct histopathological and malignant HCC features. Mitogen-activated protein kinase (MAPK)-activated, NrasG12D-driven tumors exhibit a mixed phenotype of prominent inflammation and immunosuppression in a T cell-excluded TME. Mechanistically, we report a NrasG12D cancer cell-driven, MEK-ERK1/2-SP1-dependent GM-CSF secretion enabling the accumulation of immunosuppressive and proinflammatory monocyte-derived Ly6Clow cells. GM-CSF blockade curbs the accumulation of these cells, reduces inflammation, induces cancer cell death and prolongs animal survival. Furthermore, GM-CSF neutralization synergizes with a vascular endothelial growth factor (VEGF) inhibitor to restrain HCC outgrowth. These findings underscore the profound alterations of the myeloid TME consequential to MAPK pathway activation intensity and the potential of GM-CSF inhibition as a myeloid-centric therapy tailored to subsets of HCC patients.


Conflict of interest statement

The authors declare no competing interests.

Figures

Fig. 1
Fig. 1. Genetically-distinct murine HCCs display distinct transcriptomic and histopathological features.
a Schematic diagram of experimental design: Hydrodynamic tail vein injection (HDTVi) method used to deliver the Sleeping beauty (SB) transposon and CrispR-Cas9 constructs that enforce expression of the depicted oncogenic drivers in hepatocytes in order to generate genetically-distinct HCCs. b Kaplan–Meier survival curves of HCC-bearing mice HDTV injected with the indicated combinations of oncogenic drivers (MycOE/Trp53KO n = 19, median survival of 23 days; MycOE/PtenKO n = 14, median survival of 29.5 days; NrasG12D/PtenKO n = 15, median survival of 62 days; NrasG12V/PtenKO n = 14, median survival of 118 days). NrasG12V/PtenKO vs NrasG12D/PtenKO p < 0.001; NrasG12V/PtenKO vs MycOE/Trp53KO p < 0.001; NrasG12V/PtenKO vs MycOE/PtenKO p < 0.001; NrasG12D/PtenKO vs MycOE/Trp53KO p < 0.001; NrasG12D/PtenKO vs MycOE/PtenKO p < 0.001; MycOE/Trp53KO vs MycOE/PtenKO n.s. (non-significant). ****p < 0.0001 c Longitudinal HCC volumes of individual tumor-bearing mice (MycOE/Trp53KO n = 9, MycOE/PtenKO n = 6, NrasG12D/PtenKO n = 15, NrasG12V/PtenKO n = 9) determined from weekly/bi-weekly magnetic resonance imaging (MRI), and represented relative to each animal initial tumor volume. d Representative images of H&E, Masson Trichrome, and Oil Red staining performed on sectioned livers collected from end-stage HCC-bearing mice. (Scale bars = 100 µm; representative of n = 4 mice). e Principal Component Analysis (PCA) plot depicting the transcriptome differences between genetically-distinct HCC bulk tumors (MycOE/Trp53KO n = 3, MycOE/PtenKO n = 3, NrasG12D/PtenKO n = 4, NrasG12V/PtenKO n = 3) and control livers injected with empty vectors, hereafter referred to as control (n = 3), following RNA-seq analyses (Supplementary Data 1). f Heatmap of unsupervised hierarchical clustering depicting the geneset enrichment of the MAPK, PI3K, and MYC signaling pathways in genetically-distinct HCCs (MycOE/Trp53KO n = 3, MycOE/PtenKO n = 3, NrasG12D/PtenKO n = 4, NrasG12V/PtenKO n = 3) compared to control (n = 3). The color scale represents the significance of the enrichment in –log10(FDR). FDR False Discovery Rate. Statistical significance was determined by log-rank (mantel-cox) test (b), two-sided hypergeometric test with multiple testing correction using Benjamini-Hochberg (f). Source data are provided as a Source Data file.
Fig. 2
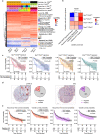
Fig. 2. Transcriptional gene signatures derived from genetically-distinct HCC models recapitulate human HCC heterogeneity and predict patient prognosis.
a Heatmap of unsupervised hierarchical clustering depicting the global gene expression level as TPMs of genetically-distinct HCCs (MycOE/Trp53KO n = 3, MycOE/PtenKO n = 3, NrasG12D/PtenKO n = 4, NrasG12V/PtenKO n = 3). Top annotations represent the classification of HCC mouse models’ transcriptomic profiles based on the human molecular HCC subtypes. *FDR < 0.01. b Heatmap of unsupervised hierarchical clustering depicting the link between the MAPK, PI3K, and MYC signaling pathway enrichment (Supplementary Fig. 2c) and patients correlating to genetically-distinct HCC-derived transcriptional signatures across TCGA: Liver Hepatocellular Cancer (LIHC) patients (n = 423) (Supplementary Data 2). c Kaplan–Meier survival curves displaying TCGA:LIHC patients segregated according to their high/low correlation with the transcriptional signatures of each genetically-distinct HCC relative to control. Lines at survival probability = 0.5 depict median survival. Risk tables show the number of patients at the indicated time points (in months). d Representative IHC image for p-ERK1/2 and MYC performed on human HCC TMA sections from the Wu et al. dataset. Pie charts depict the percentage of patients positive for p-ERK1/2 and MYC. (Scale bars = 100 µm; representative of n = 99 p-ERK1/2 positive patients and n = 78 MYC positive patients). e Kaplan–Meier curves displaying the overall survival (OS) and recurrence-free survival (RFS) of HCC patients (from the Wu et al. dataset) segregated according to p-ERK1/2 negative (n = 368) or positive (n = 99) and c-MYC negative (n = 389) or positive (n = 78) staining in cancer cells. Risk tables show the number of patients at the indicated time points (in months) (see Supplementary Data 4 for median OS and RFS time). Statistical significance was determined by one-sided Fisher’s test using Bonferroni multiple testing correction (a), log-rank test (c, e). The shading represent 95% confidence interval (c, e). TPMs Transcripts per Million. Source data are provided as a Source Data file.
Fig. 3
Fig. 3. Distinct oncogenic drivers’ activation impact HCC immune landscape.
a Myeloid and lymphoid cell contents relative to total CD45+ leukocytes in end-stage HCC and age-matched control livers Control-4-weeks n = 5, MycOE/Trp53KO n = 6, MycOE/PtenKO n = 5, NrasG12D/PtenKO n = 4, Control-15-weeks n = 5, and NrasG12V/PtenKO n = 4). b Quantification of circulating myeloid cells relative to total CD45+ leukocytes at the indicated timepoints for each of the HCC models (Control n = 10, MycOE/Trp53KO n = 20, MycOE/PtenKO n = 18, NrasG12D/PtenKO n = 30, NrasG12V/PtenKO n = 16). Arrows indicate timepoints when tumors were detectable. Statistical significance: final analyzed blood samples of tumor-bearing mice versus aged-matched controls. c Percentage of the immune cell populations relative to total CD45+ leukocytes in control and HCCs at intermediate and end-stage (Control-4-weeks n = 5, MycOE/Trp53KO intermediate n = 4 and end-stage n = 5, MycOE/PtenKO intermediate n = 5 and end-stage n = 5, Control-15-weeks n = 5, NrasG12D/PtenKO intermediate n = 7 and end-stage n = 7 (for CD8T and CD4T n = 6); and NrasG12V/PtenKO intermediate n = 4 and end-stage n = 5). Statistical analyses of each model are performed comparing each tumor stage to its relative control group (Control 4-weeks for MycOE/Trp53KO and MycOE/PtenKO; and Control-15-weeks for NrasG12D/PtenKO and NrasG12V/PtenKO). d Quantification of CD11B, CD15, CD204 and S100A9 positive cells by immunohistochemistry in paraffin-embedded HCC patient samples from the Wu et al. dataset segregated according to p-ERK1/2 (positive n = 99, negative n = 369 for CD11B, CD15 and CD204; positive n = 98, negative n = 367 for S100A9) and MYC (positive n = 78, negative n = 389 for CD11B, CD15 and CD204; positive n = 77, negative n = 386 for S100A9) expression in cancer cells. e Unsupervised hierarchical clustering of the transcriptome of CD45+ cells isolated from genetically-distinct HCCs (n = 3 for all genotypes) and their classification according to the human HCC immune subtypes clustering. f Unsupervised hierarchical clustering of the ssGSEA enrichment scores per control liver and HCC models (end-stage) using immune-related pathways presented in the Biocarta database. The color scale represents the z-score normalized enrichment per pathway (row) between HCC models (Control n = 5, MycOE/Trp53KO n = 3, MycOE/PtenKO n = 3, NrasG12D/PtenKO n = 4, NrasG12V/PtenKO n = 5). Graphs show mean ± SEM (a, c, d), +SEM (b). Statistical significance was determined by unpaired two-sided Student’s t-test (ac), two-sided Mann-Whitney U test (d), one-sided Fisher’s test using Bonferroni multiple testing correction (e). See Supplementary Fig. 9j, k for gating strategy (ac). Source data are provided as a Source Data file.
Fig. 4
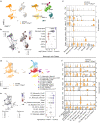
Fig. 4. The NrasG12D/PtenKO TME displays transcriptomic heterogeneity with mixed pro-tumorigenic and inflammatory signatures.
a Uniform Manifold Approximation and Projection (UMAP) representation of CD45+ immune cells from control liver (n = 1 mouse; 7447 cells) and NrasG12D/PtenKO HCC (n = 1 mouse; 4814 cells) (left) with annotated populations identified by scRNA-seq (right, Supplementary Data 7). b K-nearest neighbor (KNN) graph (left) and dotplot (right) depicting the differential abundance of cell types between NrasG12D/PtenKO HCC relative to control. Each dot represents a group of cells clustered in ‘neighborhoods’. Colors represent significant logFC (FDR ≤ 0.05), whereas white is non-significant difference in abundance. Edge thickness represents the number of overlapping cells between neighborhoods. c Violin plots depicting the normalized expression levels of inflammatory and immunosuppressive genes in the indicated immune cell subsets in control liver (n = 1) and NrasG12D/PtenKO HCC (n = 1) (Supplementary Data 8). d UMAP representation of the ‘Monocytic cell’ subset (2616 cells) grouped with cDC1 (115 cells) from (a). e K-nearest neighbor (KNN) graph (left) and dotplot (right) depicting the differential abundance of myeloid cell subsets between NrasG12D/PtenKO HCC and control liver from cells grouped as ‘neighborhoods’ in (d). The colored dots represent significant changes in abundance using a threshold of FDR ≤ 0.05, whereas white is non-significant difference in abundance. Edge thickness represents the number of overlapping cells between neighborhoods. f Violin plots depicting the normalized expression levels of inflammatory and immunosuppressive genes in the indicated myeloid cell subsets in control livers and NrasG12D/PtenKO HCC from the ‘Monocytic cell’ population (Supplementary Data 8). Nhood = neighborhood. Statistical significance was determined by two-sided, Wilcoxon rank sum test with Bonferroni multiple testing correction (c, f).*** FDR ≤ 0.001. Source data are provided as a Source Data file.
Fig. 5
Fig. 5. NrasG12D/PtenKO cancer cells activate GM-CSF signaling in the TME.
ac Differential expression analyses from bulk tumor (Fig. 1e) and cancer cell RNA-seq datasets comparing NrasG12D/PtenKO (n = 3) and NrasG12V/PtenKO HCC (n = 3). a DEGs between bulk tumors (y-axis) and cancer cells (x-axis). Colored dots represent genes significantly deregulated in both datasets. b Enriched signaling pathways for genes in (a). c Overlap of up-regulated genes and proteins identified by RNA-sequencing and cytokine arrays, respectively. d GM-CSF levels in conditioned media of genetically-distinct HCC cells (MycOE/Trp53KO n = 4, MycOE/PtenKO n = 4, NrasG12D/PtenKO n = 6, NrasG12V/PtenKO n = 4). e GM-CSF signature enrichment (Csf2rbKO-WT) in DEG from transcriptional signatures of NrasG12D/PtenKO (n = 4) and NrasG12V/PtenKO (n = 3) bulk tumors (top), and NrasG12D/PtenKO (n = 3) and NrasG12V/PtenKO (n = 3) CD45+ cells (bottom). Colors represent DEG overlap from Nras-driven models and GM-CSF signature. f DEGs from CD45+ cell RNA-seq of NrasG12D/PtenKO (n = 7) relative to NrasG12V/PtenKO (n = 7) overlapping with GM-CSF signature. Colors represent direction of GM-CSF regulation, relevant genes from GM-CSF signature are depicted (Supplementary Data 9). g Csf2ra, Csf2rb and Ccl6 expression from scRNA-seq (Fig. 4a). h GM-CSF signature enrichment for the indicated immune cell subsets identified by scRNA-seq. i. Survival of TCGA:LIHC patients segregated into high correlation with NrasG12D/PtenKO or NrasG12V/PtenKO transcriptional signatures (Fig. 2c) (NrasG12D/PtenKO n = 65, NrasG12V/PtenKO n = 66). high- and low-correlating patients are unique to each signature. Tables show patient numbers at the indicated time points. j Enrichment of GM-CSF positively-regulated genes (n = 628) from the GM-CSF signature in TCGA:LIHC patients segregated into high correlation with NrasG12D/PtenKO or NrasG12V/PtenKO transcriptional signatures (Fig. 2c) (NrasG12D/PtenKO n = 65, NrasG12V/PtenKO n = 66). k Survival of TCGA:LIHC patients segregated into high/low enrichment of GM-CSF positively-regulated genes (n = 628) from the GM-CSF signature (High n = 103, Low n = 82). Tables show patient numbers at the indicated time points. Graph show mean ± SEM (d). Statistical significance: two-sided hypergeometric test with Benjamini-Hochberg multiple testing correction (b, e, h), one-way ANOVA with Tukey’s multiple comparison test (d), log-rank test (i, k), unpaired two-sided Student’s t-test (j). Vertical lines at −log10(FDR) = 2.5 indicate significance threshold (b, e, h). The shading represents 95% confidence interval (i, k). Source data are provided as a Source Data file.
Fig. 6
Fig. 6. GM-CSF expression is regulated through activation of the ERK1/2 pathway and SP1 transcription factor.
a Barplot depicting the expression levels (signal intensity) of RAS/MAPK-associated phospho-proteins in NrasG12D/PtenKO and NrasG12V/PtenKO HCC cell lysates (n = 1 per cell line). b Barplot depicting GM-CSF protein levels quantified in NrasG12D/PtenKO cancer cell conditioned media after 24 h of treatment with Trametinib (MEK1/2 inhibitor; 0 nM n = 5, 5 nM n = 5, 10 nM n = 4), Temuterkib (ERK1/2 inhibitor; 0 μM n = 3, 5 μM n = 3, 10 μM n = 3) and Vx-11e (ERK2 inhibitor; 0 μM n = 6, 5 μM n = 5, 10 μM n = 4) at the indicated drug concentrations. c Barplots depicting the GM-CSF protein level quantified in the supernatant of scramble (shScr, n = 9), shErk2 (n = 4), and shErk1 (n = 4) NrasG12D/PtenKO HCC cell lines. d Venn diagram depicting the overlap of DEG between NrasG12D/PtenKO and NrasG12V/PtenKO cancer cells treated or not with Vx-11e (n = 3 per cell line per condition) (Supplementary Data 9). e Graphical representation of the gene expression pattern (y-axis) across conditions (x-axis) that follow Csf2 regulation (d; 1270 overlapping DEG) shown (d). “+” indicates up-regulated genes and “-“ indicates down-regulated genes. f Motif enrichment analysis in promoters from the 373 genes, identifying SP1 as a top candidate (Supplementary Data 9). g Barplots depicting the GM-CSF protein levels quantified in the supernatant of shScr (n = 9, shown in (c)) and shSp1 (n = 3) NrasG12D/PtenKO HCC cell lines. h Scatterplot depicting the correlation between the enrichment of ERK signaling pathway (y-axis) and GM-CSF signature (x-axis) for each TCGA cancer type. Correlation analyses were performed on the median pathway enrichment score of all patients per cancer type. Graph shows mean ± SEM (b, c, g). Statistical significance was determined by two-sided Student’s t-test (b, c, g), two-sided Fisher’s exact test, followed by Benjamini-Hochberg multiple test correction (f) and two-sided test for association between paired samples, using Pearson’s product moment correlation coefficient (h). The shading represents 95% confidence interval (h). Source data are provided as a Source Data file.
Fig. 7
Fig. 7. GM-CSF blockade curbs monocyte-derived inflammatory Ly6Clow cell accumulation in the NrasG12D/PtenKO TME.
a, b Percentage of Ly6ClowF4/80low cells relative to total myeloid cells (a) obtained from bone marrow (BM) cells differentiated in either recombinant M-CSF (n = 6) or GM-CSF (n = 6), or in conditioned media (CM) prepared from distinct HCC cell lines, with or without GM-CSF neutralizing antibody (a-GM-CSF) (NrasG12D/PtenKO n = 7, NrasG12D/PtenKO + a-GM-CSF n = 6, NrasG12V/PtenKO n = 6, NrasG12V/PtenKO + a-GM-CSF n = 5) and (b) analyzed for the indicated phenotypic markers relative to the total Ly6Clow F4/80low population. c IL-1R signaling activity in HEK reporter cells exposed to CM from BM cells differentiated with either recombinant M-CSF (n = 7), GM-CSF (n = 7), or to CM from NrasG12D/PtenKO or NrasG12V/PtenKO cell lines, in presence or not of a-GM-CSF (NrasG12D/PtenKO n = 7, NrasG12D/PtenKO + a-GM-CSF n = 7, NrasG12V/PtenKO n = 7, NrasG12V/PtenKO + a-GM-CSF n = 3). d Experimental design: mice were HDTV-injected to induce NrasG12D/PtenKO HCC, monitored by weekly MRI starting from 3 weeks post-injection, and enrolled into treatments with a-IgG2a (12.5 mg/kg three times per week) or a-GM-CSF (12.5 mg/kg three times per week) for 2 weeks (time point T1) or until end-stage (time point T2) for flow cytometry analyses. e Percentage of intratumoral Ly6Chigh monocytes, Ly6Ghigh neutrophils, Ly6ClowF4-80high/int macrophages and Ly6ClowF4-80low subsets relative to total CD45+ leukocytes in HDTVi-induced NrasG12D/PtenKO HCC-bearing mice 2 weeks post treatment (T1) with a-IgG2a (n = 5) or a-GM-CSF (n = 5). f Percentage of Ki67+ intratumoral Ly6ClowF4/80low cells in HDTVi-induced NrasG12D/PtenKO HCC upon 2 weeks of treatment (T1) with a-IgG2a (n = 5) or a-GM-CSF (n = 5). g Mean fluorescence intensity of the depicted markers in four different Ly6ClowF4-80low subsets (CD206lowCCR2-, CD206lowCCR2+, CD206+CCR2high, and CD206highCCR2high) identified by FlowSOM analysis performed on HDTVi-induced NrasG12D/PtenKO end-stage (T2) HCCs (n = 3). h Proportions of Ly6ClowF4-80low subsets (CD206lowCCR2-, CD206lowCCR2+, CD206intCCR2high, and CD206highCCR2high) identified by FlowSOM analysis performed on HDTVi-induced NrasG12D/PtenKO end-stage (T2) HCCs (n = 3). Graphs show mean ± SEM (a, c, e, f) and median (b). Statistical significance was determined by unpaired two-sided Student’s t-test in (ac, e, f). See gating strategy in Supplementary Fig. 7b (a) and 9j (e-f). Source data are provided as a Source Data file.
Fig. 8
Fig. 8. GM-CSF blockade hampers tumor growth and synergizes with VEGF inhibition to extend NrasG12D/PtenKO HCC-bearing mice survival.
a Kaplan–Meier survival curves of LOI-induced NrasG12D/PtenKO HCC-bearing mice treated with a-IgG2a (n = 8; median survival of 14 days) or a-GM-CSF (n = 10; median survival of 23 days). b Kaplan–Meier survival curves of LOI-induced NrasG12D/PtenKO HCC-bearing mice treated with a-IgG2a (n = 9; median survival of 14 days), a-GM-CSF (n = 14; median survival of 25 days), a-VEGF + a-PD-L1 (n = 8; median survival of 21 days), a-GM-CSF + a-PD-L1 (n = 4; median survival of 24 days), a-GM-CSF + a-VEGF (n = 6; median survival of 39.5 days). Graph includes a-IgG2a (n = 8) and a-GM-CSF (n = 10) treated mice from Fig. 8a. c Representative H&E and cleaved caspase 3 (CC3+) IHC staining performed on liver sections from end-stage LOI-induced NrasG12D/PtenKO HCC-bearing mice treated with a-IgG2a, a-GM-CSF or a-GM-CSF + a-VEGF. (Scale bars = 2 mm; representative CC3+ for data shown in d and representative H&E for data shown in (e)). d Barplot depicting the percentage of cleaved caspase 3 (CC3+) positive cells per area in tumor nodules (end-stage) isolated from LOI-induced NrasG12D/PtenKO HCC-bearing mice treated with IgG2a (n = 9), a-GM-CSF (n = 5) or a-GM-CSF + a-VEGF (n = 6). e Barplot depicting the percentage of necrotic area in tumor section (end-stage) from LOI-induced NrasG12D/PtenKO HCC-bearing mice treated with IgG2a (n = 7 mice), a-GM-CSF (n = 11 mice) or a-GM-CSF + a-VEGF (n = 6 mice). Graph shows mean ± SEM (d, e). Statistical significance was determined by log-rank test (a, b) and unpaired two-sided Student’s t-test (d, e). Source data are provided as a Source Data file.

References

    1. Ding X, et al. Genomic and epigenomic features of primary and recurrent hepatocellular carcinomas. Gastroenterology. 2019;157:1630–1645 e1636. doi: 10.1053/j.gastro.2019.09.005. - DOI - PubMed
    1. Zhang Q, Lou Y, Bai XL, Liang TB. Intratumoral heterogeneity of hepatocellular carcinoma: from single-cell to population-based studies. World J. Gastroenterol. 2020;26:3720–3736. doi: 10.3748/wjg.v26.i26.3720. - DOI - PMC - PubMed
    1. Zhu S, Hoshida Y. Molecular heterogeneity in hepatocellular carcinoma. Hepat. Oncol. 2018;5:HEP10. doi: 10.2217/hep-2018-0005. - DOI - PMC - PubMed
    1. Llovet JM, et al. Hepatocellular carcinoma. Nat. Rev. Dis. Prim. 2021;7:6. doi: 10.1038/s41572-020-00240-3. - DOI - PubMed
    1. Sung H, et al. Global cancer statistics 2020: GLOBOCAN estimates of incidence and mortality worldwide for 36 cancers in 185 countries. CA Cancer J. Clin. 2021;71:209–249. doi: 10.3322/caac.21660. - DOI - PubMed

MeSH terms

Substances