. 2024 May;43(20):1489-1505.
doi: 10.1038/s41388-024-03010-7. Epub 2024 Mar 22.

ZEB1 controls a lineage-specific transcriptional program essential for melanoma cell state transitions

Affiliations

ZEB1 controls a lineage-specific transcriptional program essential for melanoma cell state transitions

Simon Durand et al. Oncogene. 2024 May.

Abstract

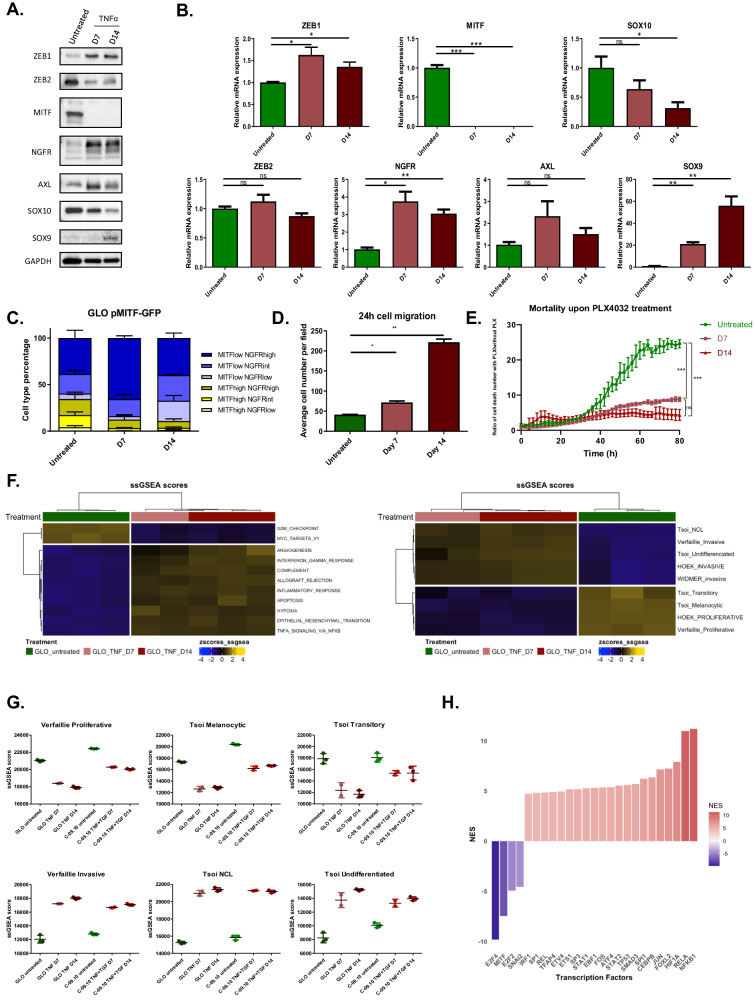
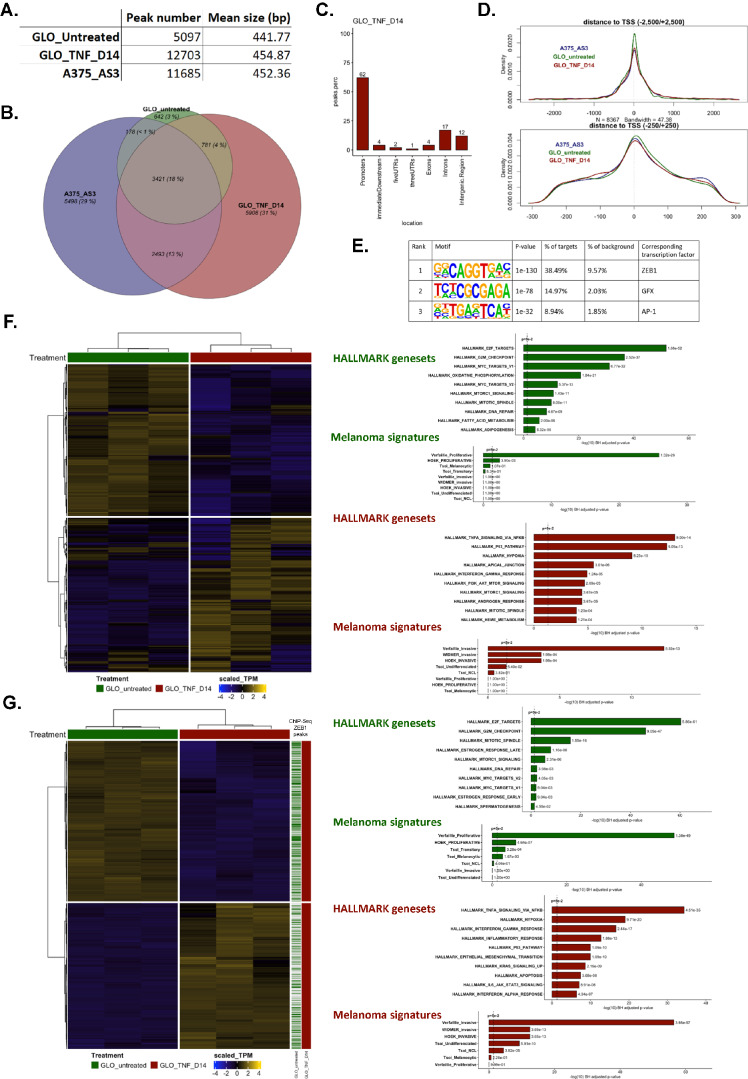
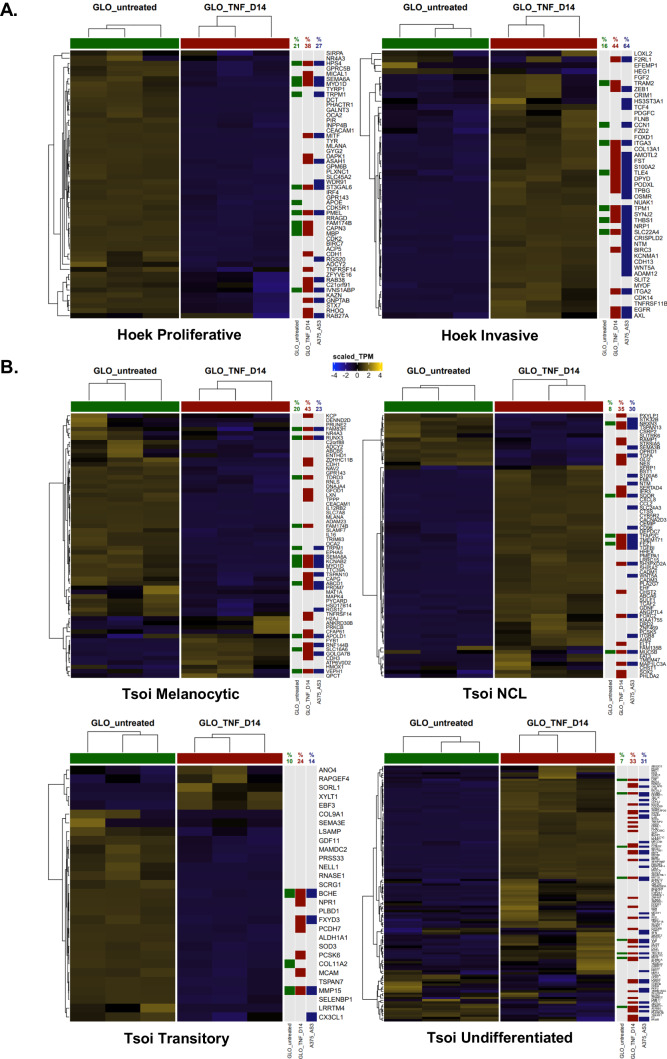
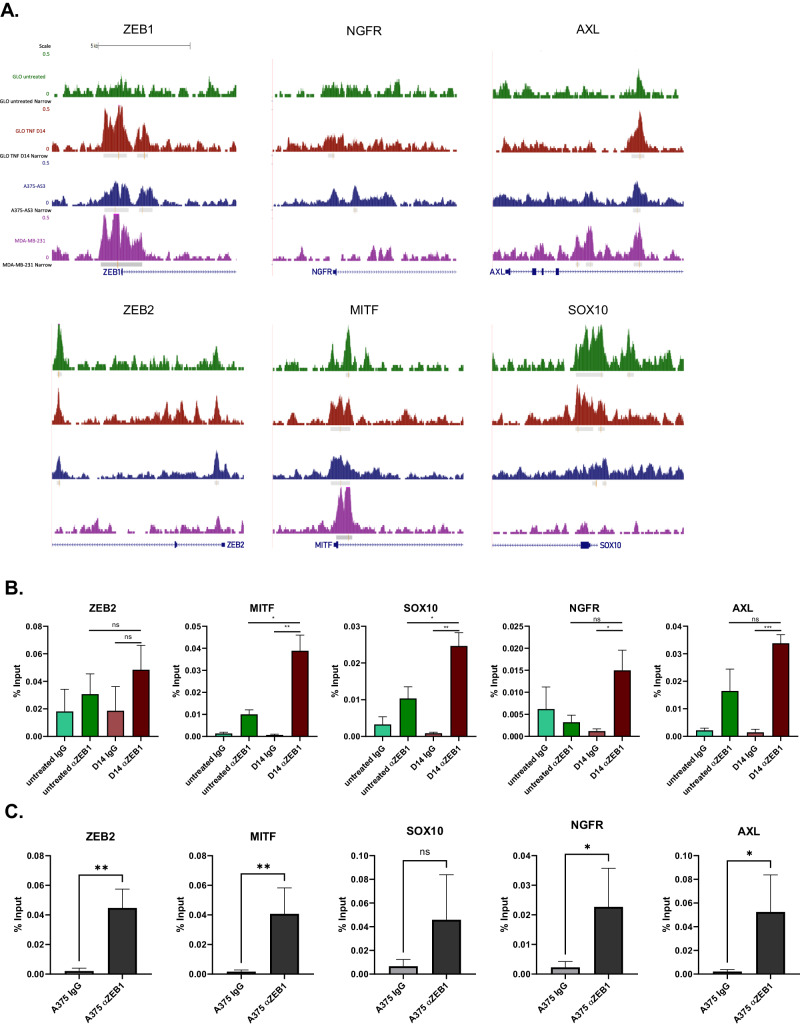
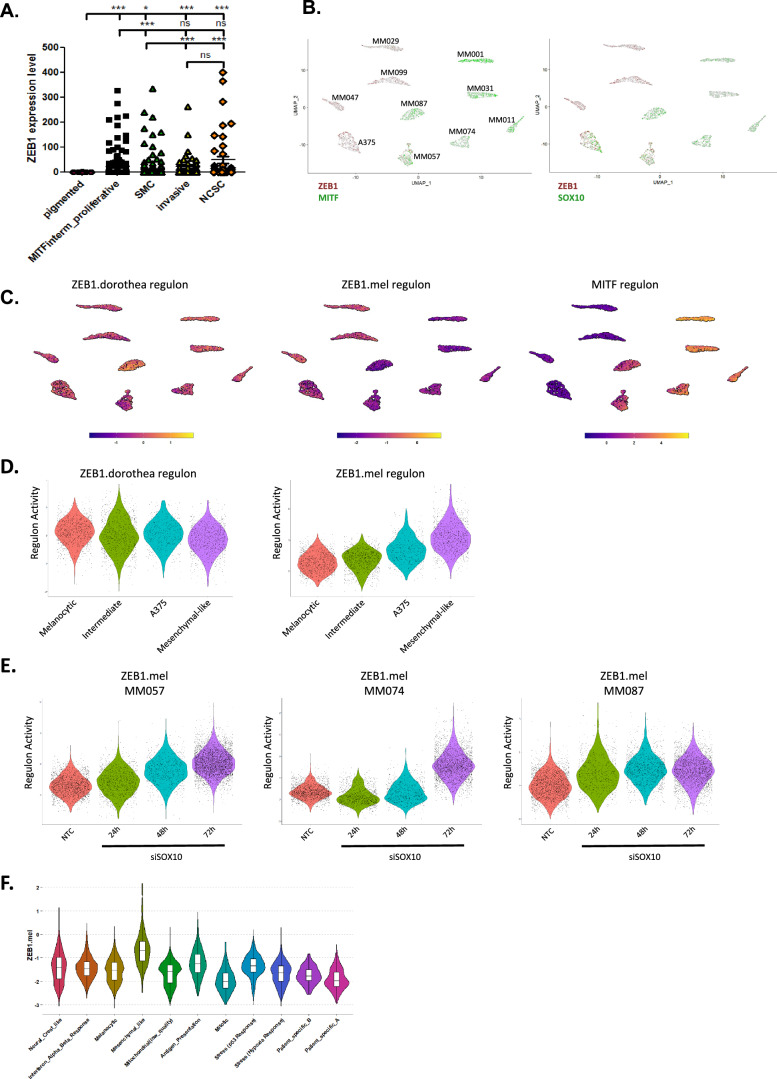
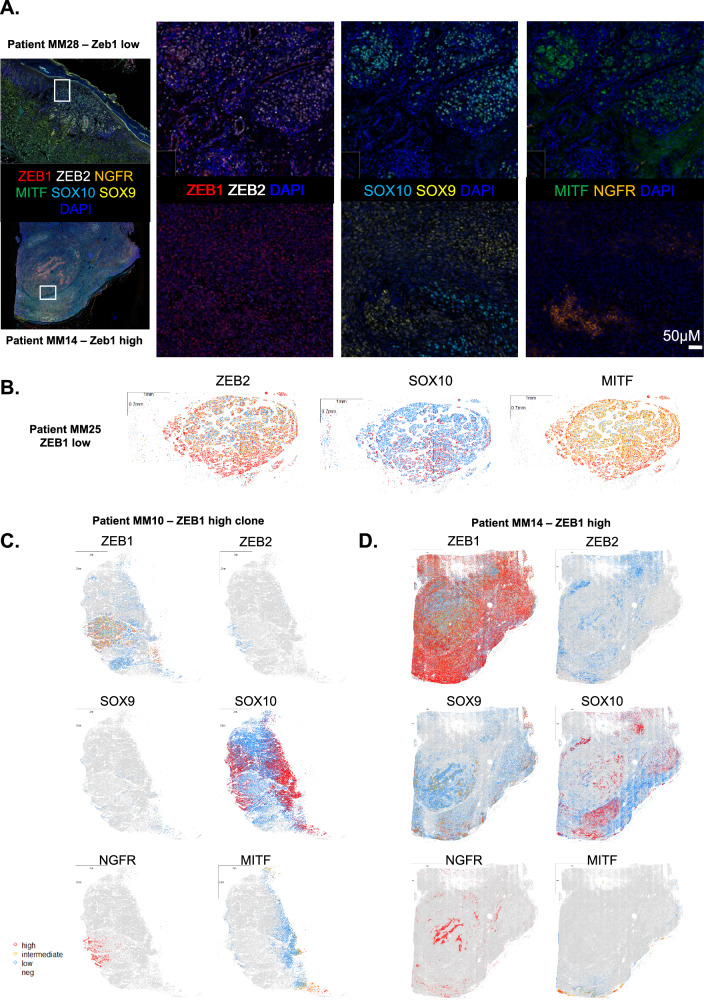
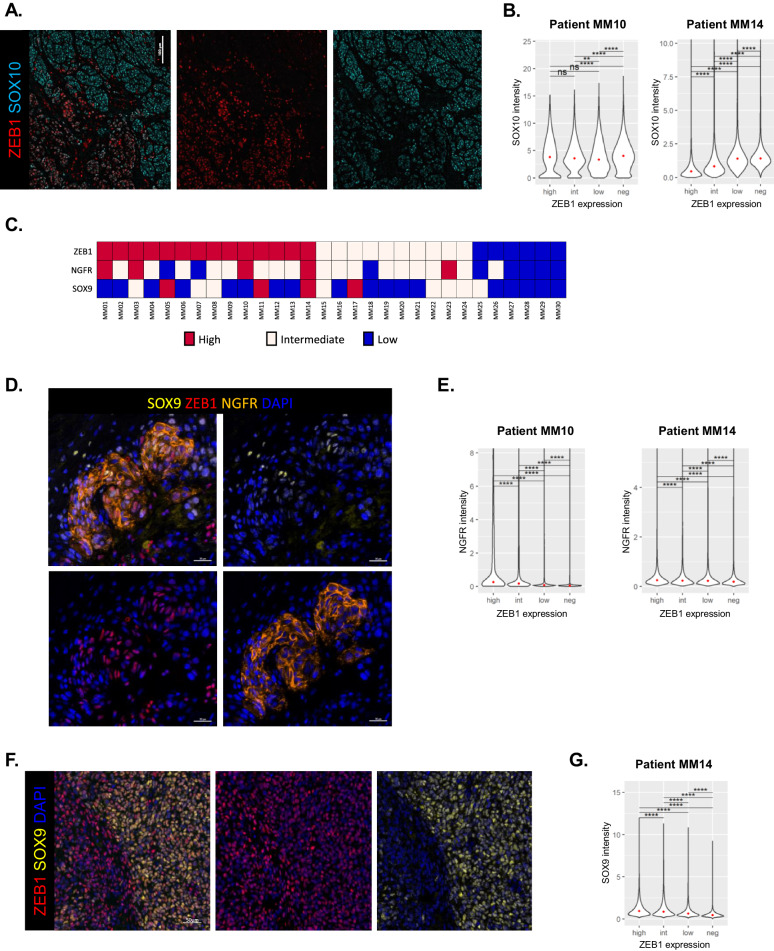
Cell plasticity sustains intra-tumor heterogeneity and treatment resistance in melanoma. Deciphering the transcriptional mechanisms governing reversible phenotypic transitions between proliferative/differentiated and invasive/stem-like states is required. Expression of the ZEB1 transcription factor is frequently activated in melanoma, where it fosters adaptive resistance to targeted therapies. Here, we performed a genome-wide characterization of ZEB1 transcriptional targets, by combining ChIP-sequencing and RNA-sequencing, upon phenotype switching in melanoma models. We identified and validated ZEB1 binding peaks in the promoter of key lineage-specific genes crucial for melanoma cell identity. Mechanistically, ZEB1 negatively regulates SOX10-MITF dependent proliferative/melanocytic programs and positively regulates AP-1 driven invasive and stem-like programs. Comparative analyses with breast carcinoma cells revealed lineage-specific ZEB1 binding, leading to the design of a more reliable melanoma-specific ZEB1 regulon. We then developed single-cell spatial multiplexed analyses to characterize melanoma cell states intra-tumoral heterogeneity in human melanoma samples. Combined with scRNA-Seq analyses, our findings confirmed increased ZEB1 expression in Neural-Crest-like cells and mesenchymal cells, underscoring its significance in vivo in both populations. Overall, our results define ZEB1 as a major transcriptional regulator of cell states transitions and provide a better understanding of lineage-specific transcriptional programs sustaining intra-tumor heterogeneity in melanoma.


Conflict of interest statement

The authors declare no competing interests.

Figures

Fig. 1
Fig. 1. Modeling phenotype switching towards ZEB1high/MITFlow neural crest stem cell /invasive state in vitro.
Western blot A and RT-qPCR B analyses of ZEB1, ZEB2, MITF, NGFR, AXL, SOX10 and SOX9 expression after 7 (D7) and 14 (D14) days of TNFα (100 ng/mL) treatment in GLO cells. GAPDH was used as loading control. Histograms represent quantitative analyses of relative expression (n = 4 independent experiments). C Longitudinal intra-tumor heterogeneity characterization of MITF and NGFR expression by flow cytometry in GLO pMITF-GFP cells, upon TNFα treatment during 7 (D7) or 14 (D14) days. NGFR was marked by anti-NGFR antibody coupled with APC. The proportion of cells with MITF high, intermediate or low and with NGFR high, intermediate or low statuses is indicated. D Transwell migration assays in GLO cells upon TNFα treatment after 7 (D7) or 14 (D14) days. Cells were fixed after 24 h, the number of migrating cells is plotted (n = 3). E Incucyte assay showing the relative increase in cell death upon PLX4032 (500 nM) treatment over time, in cells previously treated with TNFα for 7 or 14 days. F RNA-seq analyses of GLO cells after 7 (D7) or 14 days (D14) of TNFα treatment. Heatmap of ssGSEA scores of the most relevant hallmarks and of melanoma states signatures from Hoek, Tsoi, Verfaillie and Widmer. Clustering Ward.D2 / distance: Euclidean. G ssGSEA scores of the melanoma signatures (Tsoi and Verfaillie) in cells treated for 7 (D7) or 14 days (D14) with TNFα (GLO) or TNFα + TGFβ (C-09.10). H Inference of transcription factors (TF) activity in gene expression data using VIPER algorithm. Barplot of DoRothEA TF Normalized Enrichment Score (NES) comparing untreated versus TNF treated (D14) GLO cells. Data are shown as the mean ± SEM. P values were determined by a two-tailed paired student t test B, D and ANOVA test E. Differences were considered statistically significant at *P ≤ 0.05, **P < 0.01 and ***P < 0.001. ns (non-significant) means P > 0.05.
Fig. 2
Fig. 2. ZEB1 ChIP-sequencing analyses in two melanoma cell lines.
ZEB1 ChIP sequencing was performed in GLO cells, untreated or after 14 days (D14) of TNFα treatment and in A375-AS3 (control) cells. A The number and size of peaks are indicated. B Venn diagram showing the overlap between peaks found in GLO cells untreated (green) or after 14 days of TNFα treatment (D14) (red) and in A375-AS3 cells (blue). A hypergeometric test confirmed that overlaps between the three conditions are significant and not by chance alone (P < 0.001). Localization of the peaks C and distance to the transcription start site D. E Top3 HOMER-identified enriched motifs in GLO after 14 days of TNFα treatment. The associated p-values, the percentages of motif representation on target and background are indicated. F Heatmap of all genes presenting a ZEB1 binding peak in TNFα-treated cells at day 14. The most significantly enriched hallmarks and melanoma state signatures are indicated on the right. Clustering Ward.D2 / distance: Euclidean. G Integration of ChIP-Seq with RNA-seq data in GLO cells. Heatmap of DE genes presenting a ZEB1 peak in GLO cells after 14 days of TNFα treatment. Presence of a ZEB1 peak in the gene is indicated by a green line (untreated condition) or a red line (TNFα D14 condition) on the right. The most significantly enriched hallmarks and melanoma state signatures within down- and up-regulated genes in D14 versus untreated cells are indicated on the right.
Fig. 3
Fig. 3. Specific analyses of ZEB1 binding on genes from melanoma cell state signatures.
Heatmap of genes from the melanoma signatures from Hoek et al. A, Tsoi et al. B in untreated or TNFα-treated GLO cells at day 14. The presence of a ZEB1 peak is indicated by a green (untreated), red (TNFα D14) or blue (A375-AS3 cells) square. The percentage of genes of the corresponding signature presenting a ZEB1 peak for each condition is indicated. Clustering Ward.D2 / distance: Euclidean.
Fig. 4
Fig. 4. Validation by ChIP-qPCR of ZEB1 binding on the promoters of lineage-specific major markers of melanoma cell states.
A UCSC genome browser captures showing ZEB1 binding peaks in ZEB1, ZEB2, MITF, NGFR, AXL, SOX10 and SOX9 promoters in untreated or TNFα-treated GLO cells at day 14 (TNF D14), A375-AS3 cells and MDA-MB-231 cells. Significantly enriched peaks are marked by a grey square and red line. ZEB1 ChIP-qPCR on ZEB2, MITF, SOX10, NGFR and AXL promoters in GLO cells treated with TNFα for 14 days (D14) B and A375 cells C. Anti-ZEB1 (α ZEB1) or control IgG were used for the IP. Relative promoter enrichment was normalized against chromatin inputs (n = 3). Data are shown as the mean ± SEM. P values were determined by a two-tailed student t test.
Fig. 5
Fig. 5. ZEB1-dependent regulation of markers of melanoma cell states in gain or loss of function models.
Western blot analyses of phenotype markers (ZEB1, MITF, NGFR, AXL, SOX10, SOX9) in C-09.10 cells with ZEB1 over-expression (ZEB1) A and in A375 control (AS3) or ZEB1 knocked-out (AZ1) clones B. GAPDH was used as loading control. (n = 3). C Transwell migration assays in A375-AS3 and A375-AZ1 ZEB1 knocked-out cells. Cells were fixed after 24 h, the number of migrating cells is plotted (n = 4). RNA-seq analyses of C-09.10 cells upon ZEB1 over-expression (ZEB1 OE). D The most significant hallmarks and melanoma signatures enriched in up-regulated genes in ZEB1 OE are indicated. E ssGSEA scores of invasive, NCL and undifferentiated melanoma signatures are plotted in C-09.10 cells upon ZEB1 over-expression or upon TNFα + TGFβ treatment at day 7 and day 14 for comparison. F RT-qPCR analyses of ITGA2, AQP1, BIRC3, TNFAIP2 and SECTM1 expression in C-09.10 cells with ZEB1 over-expression. Histograms represent quantitative analyses of relative expression (n = 3 independent experiments with two technical replicates for each). G RT-qPCR analyses of TNFAIP2, KRT7 and SECTM1 expression in A375-AS3 and A375-AZ1 ZEB1 knocked-out cells. Histograms represent quantitative analyses of relative expression (n = 3 independent experiments with two technical replicates for each). H Gene filtering strategy used to define the ZEB1.mel melanoma specific regulon. I Inference of transcription factors (TF) activity in gene expression data using VIPER algorithm with ZEB1.mel added to the list of regulons. Barplot of DoRothEA TF Normalized Enrichment Score (NES) comparing control versus ZEB1 OE C-09.10 cells. Data are shown as the mean ± SEM. P values were determined by a two-tailed paired student t test (C), and by a two-tailed unpaired student t test (F) and (G). Differences were considered statistically significant at *P ≤ 0.05, **P < 0.01 and ***P < 0.001. ns (non-significant) means P > 0.05.
Fig. 6
Fig. 6. ZEB1 expression and melanoma specific ZEB1 regulon activity in public single cell RNA-seq dataset of melanoma models.
A ZEB1 expression levels in the different cell states defined by Rambow et al., 2018 in single cell RNA-seq data of melanoma patient-derived xenografts (PDXs). P values were determined by Mann-Whitney test. Differences were considered statistically significant at *P ≤ 0.05, **P < 0.01 and ***P < 0.001. ns (non-significant) means P > 0.05. B UMAP visualizations of single-cell RNA-seq data of 10 melanoma cell lines from Wouters et al. The expression levels of ZEB1, MITF and SOX10 genes are indicated. C UMAPS visualizations with transcription factor activity of ZEB1 regulon given by Dorothea collection (pancancer), the melanoma-specific ZEB1.mel and MITF regulons (Wouters et al.). D Violin plots showing transcription factor activity of ZEB1 and ZEB1.mel regulons (Wouters et al.). E. Violin plot of the transcription factor activity of ZEB1.mel regulon in Wouters et al. single cell RNA-seq data from 3 melanoma short term cultures transfected with SOX10 siRNA or non-targeting control (NTC). F Violin plot of the transcription factor activity of ZEB1.mel regulon in Pozniak et al. single cell RNA-seq data.
Fig. 7
Fig. 7. Single-cell spatial analyses of markers of melanoma cell states according to ZEB1 status in melanoma samples.
A 7-color multiplexed immunofluorescence analyses of human melanoma samples with ZEB1 (red), ZEB2 (white), SOX10 (blue), SOX9 (yellow), NGFR (orange), MITF (green) and DAPI. Representative pictures of a ZEB1low (top) and a ZEB1high (bottom) cutaneous melanoma showing antagonistic expression of ZEB1 and ZEB2, MITF and NGFR, and SOX10 and SOX9. B–D. Reconstruction of three representative heterogeneous tumors as whole slides: a ZEB1low B, and two ZEB1high tumors C, D. Each dot represents a cell. The expression levels of ZEB1, ZEB2, MITF and SOX9 are indicated in red (high), yellow (intermediate), blue (low) and grey (not expressed). SOX10 display 3 levels of expression defined as high, low and not expressed; and NGFR display only 2 levels of expression defined as high and not expressed.
Fig. 8
Fig. 8. ZEB1 antagonistic expression with SOX10 and co-expression with NGFR and SOX9 within melanoma lesions.
A Representative pictures of ZEB1 and SOX10 staining showing antagonistic expression of ZEB1 and SOX10 in the ZEB1high clone from Patient MM10. B Violin plots showing the expression levels of SOX10 for cells grouped with respect to their ZEB1 expression status (high, intermediate, low or not expressed) in two representative ZEB1high melanoma cases. C ZEB1, NGFR and SOX9 status annotated in high, intermediate and low expression based on the protein expression level in the multi-IF analysis. D Representative pictures of ZEB1, NGFR and/or SOX9 staining showing co-expression of ZEB1 with NGFR and/or SOX9. E Violin plots showing the expression levels of NGFR for cells grouped with respect to their ZEB1 expression status (high, intermediate, low or not expressed) in two representative ZEB1high melanoma cases. F Representative pictures of ZEB1 and SOX9 staining showing co-expression of ZEB1 with SOX9. G Violin plots showing the expression levels of SOX9 for cells grouped with respect to their ZEB1 expression status (high, intermediate, low or not expressed) in one representative ZEB1high melanoma. The median is shown with a red dot. P values were determined by Mann-Whitney test with Bonferroni correction B, E, G. Differences were considered statistically significant at *P ≤ 0.05, **P < 0.01 and ***P < 0.001. ns (non-significant) means P > 0.05.

References

    1. Marine JC, Dawson SJ, Dawson MA. Non-genetic mechanisms of therapeutic resistance in cancer. Nat Rev Cancer Nat Res. 2020;20:743–56. doi: 10.1038/s41568-020-00302-4. - DOI - PubMed
    1. Arozarena I, Wellbrock C. Phenotype plasticity as enabler of melanoma progression and therapy resistance. Nat Rev Cancer. 2019;19:377–91. doi: 10.1038/s41568-019-0154-4. - DOI - PubMed
    1. Nieto MA, Huang RY, Jackson RA, Thiery JP. Emt: 2016. Cell. 2016;166:21–45. doi: 10.1016/j.cell.2016.06.028. - DOI - PubMed
    1. Pastushenko I, Blanpain C. EMT transition states during tumor progression and metastasis. Trends Cell Biol. 2019;29:212–26. doi: 10.1016/j.tcb.2018.12.001. - DOI - PubMed
    1. Brabletz S, Brabletz T. The ZEB/miR-200 feedback loop-a motor of cellular plasticity in development and cancer? EMBO Rep. 2010;11:670–7. doi: 10.1038/embor.2010.117. - DOI - PMC - PubMed

MeSH terms

Substances