. 2024 May;31(5):651-661.
doi: 10.1038/s41418-024-01280-y. Epub 2024 Mar 22.

Mitophagy mediated by BNIP3 and NIX protects against ferroptosis by downregulating mitochondrial reactive oxygen species

Affiliations

Mitophagy mediated by BNIP3 and NIX protects against ferroptosis by downregulating mitochondrial reactive oxygen species

Shun-Ichi Yamashita et al. Cell Death Differ. 2024 May.

Abstract

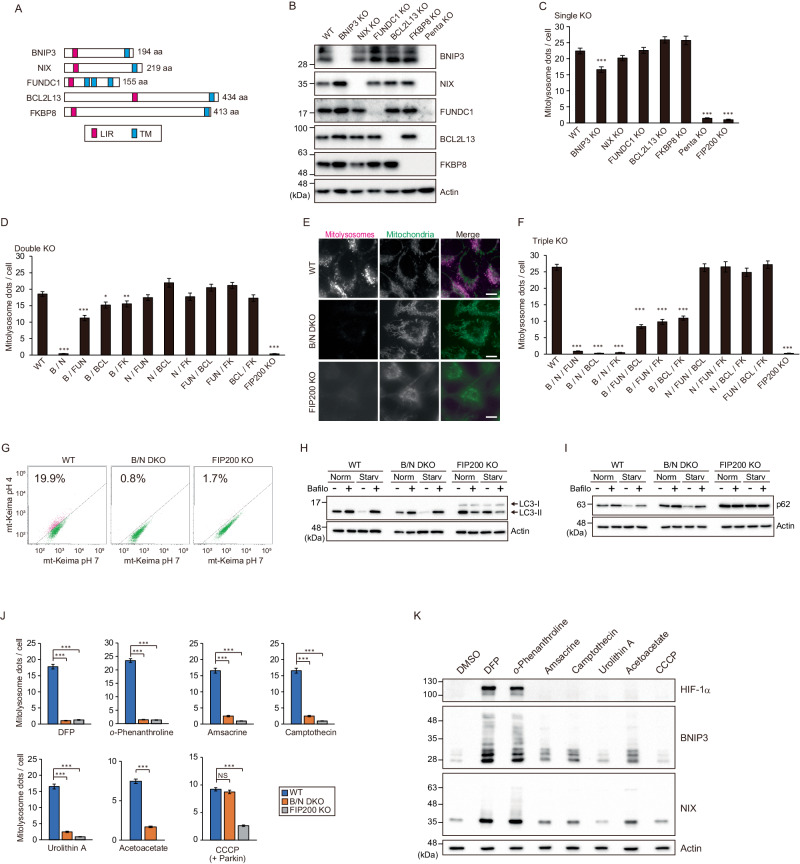
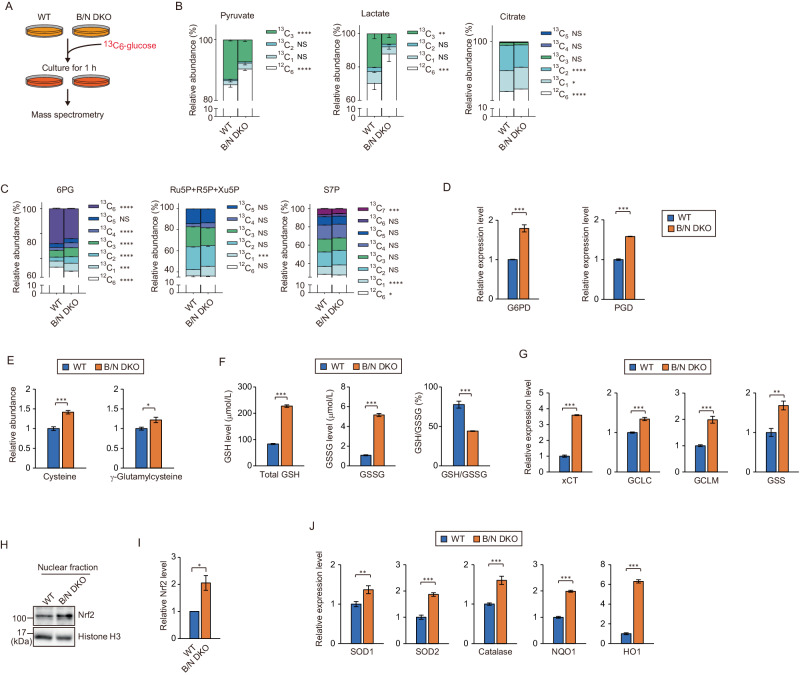
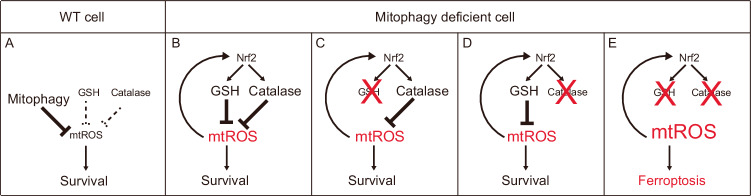
Mitophagy plays an important role in the maintenance of mitochondrial homeostasis and can be categorized into two types: ubiquitin-mediated and receptor-mediated pathways. During receptor-mediated mitophagy, mitophagy receptors facilitate mitophagy by tethering the isolation membrane to mitochondria. Although at least five outer mitochondrial membrane proteins have been identified as mitophagy receptors, their individual contribution and interrelationship remain unclear. Here, we show that HeLa cells lacking BNIP3 and NIX, two of the five receptors, exhibit a complete loss of mitophagy in various conditions. Conversely, cells deficient in the other three receptors show normal mitophagy. Using BNIP3/NIX double knockout (DKO) cells as a model, we reveal that mitophagy deficiency elevates mitochondrial reactive oxygen species (mtROS), which leads to activation of the Nrf2 antioxidant pathway. Notably, BNIP3/NIX DKO cells are highly sensitive to ferroptosis when Nrf2-driven antioxidant enzymes are compromised. Moreover, the sensitivity of BNIP3/NIX DKO cells is fully rescued upon the introduction of wild-type BNIP3 and NIX, but not the mutant forms incapable of facilitating mitophagy. Consequently, our results demonstrate that BNIP3 and NIX-mediated mitophagy plays a role in regulating mtROS levels and protects cells from ferroptosis.


Conflict of interest statement

The authors declare no competing interests.

Figures

Fig. 1
Fig. 1. BNIP3 and NIX redundantly contribute to various types of mitophagy in HeLa cells.
A Representation of the LC3-interacting region (LIR) and transmembrane domain (TM) positions in five mitophagy receptors. B Immunoblot analysis of mitophagy receptor single KO and penta KO cell lines. Data are representative of three biological replicates for each cell line. C Quantification of the mitolysosomes shown in (Fig. S1F). The data are representative of three independent experiments. Similar results were observed in the other two experiments. More than 200 cells were analyzed in each experiment. Data are represented as the mean ± SEM. Asterisks indicate statistical differences compared with WT. D Quantification of mitolysosomes in receptor double KO cell lines. Data were analyzed and are shown as in (C). The receptor names are abbreviated as follows: BNIP3: B, NIX: N, FUNDC1: FUN, BCL2L13: BCL, and FKBP8: FK. E Representative images of mt-Keima in WT, BNIP3/NIX DKO, and FIP200 KO cells under hypoxia. In merged images, mitolysosomes (excitation with 590 nm) and mitochondria (excitation with 430 nm) are indicated by magenta and green, respectively. Bars, 10 μm. F Quantification of mitolysosomes in receptor triple KO cell lines. Data were analyzed and are shown as in (C). G Representative FACS data of indicated cells upon hypoxia. The percentage of cells showing positivity for mitophagy are indicated. Immunoblot analysis of LC3 (H) and p62 (I) in WT, BNIP3/NIX DKO, and FIP200 KO cell lines. The cells were cultured in normal or starvation medium in the absence or presence of bafilomycin A1 for 3 h and subjected to immunoblot analysis. J Quantification of mitolysosomes in WT, BNIP3/NIX DKO, and FIP200 KO cells cultured in the presence of mitophagy-inducing chemicals. With regard to acetoacetate treatment, cells were cultured in acetoacetate medium for 7 days. However, notably, FIP200 KO cells did not survive in the acetoacetate medium for the entire 7-day duration. Therefore, the assessment of mitophagy levels in FIP200 KO cells was not possible. In CCCP treatment, Parkin-expressing WT, BNIP3/NIX DKO, and FIP200 KO cells were cultured in the presence of CCCP for 3 h. Data were analyzed and are shown as in (C). K Immunoblot analysis of HIF-1α, BNIP3, and NIX in WT cells. The cells were cultured as in (J) and subjected to immunoblot analysis. *p < 0.05, **p < 0.01, ***p < 0.001; NS not significant by the Kruskal-Wallis test.
Fig. 2
Fig. 2. Mitophagy mediated by BNIP3 and NIX plays a crucial role in maintaining mitochondrial function.
A Oxygen consumption rate (OCR) curve of WT and BNIP3/NIX DKO cells. Data are represented as the mean ± SD (n = 3 biological replicates for each cell). B Basal and maximal respiration, and ATP production were calculated using OCR data in (A) and are shown in bar graphs. C Representative images of MitoSOX-stained WT and BNIP3/NIX DKO cells upon normoxia and hypoxia. MitoSOX intensities were measured from fluorescence images and are shown as the ratio to normoxia_WT. Data are represented as the mean ± SEM (n = 3 biological replicates; more than 100 cells were analyzed in each replicate). Bars, 10 µm. D Representative images of MitoSOX-stained WT, BNIP3/NIX DKO, and FIP200 KO cells under the normal condition. MitoSOX intensities were analyzed and are shown as in (C). Bars, 10 µm. E Immunoblot analysis of BNIP3/NIX DKO cells expressing the WT or LIR mutant (LIRm) form of BNIP3 or NIX. EV indicates the transduction of an empty vector. Cells were cultured under hypoxia for 24 h and subjected to immunoblot analysis with anti-BNIP3 or NIX antibodies. F Quantification of the mitolysosomes in BNIP3/NIX DKO cells expressing the WT or LIRm form of BNIP3 or NIX under hypoxia. Data were analyzed and are represented as in Fig. 1C. G MitoSOX intensities in BNIP3/NIX DKO cells expressing the WT or LIRm form of BNIP3 or NIX. EV indicates the transduction of an empty vector. MitoSOX intensities were analyzed and are shown as in (C). Bars, 10 μm. *p < 0.05, ***p < 0.001; NS, not significant by Student’s t-test (B) or by one-way ANOVA (C, D, F, G).
Fig. 3
Fig. 3. The Nrf2-antioxidant pathway compensates for the loss of mitophagy.
A Representation of the strategy for 13C6-glucose labeling. Isotopomer abundance of metabolic intermediates in glycolysis and the tricarboxylic acid cycle (pyruvate, lactate, and citrate) (B), and in the pentose phosphate pathway (6-phosphogluconate [6PG], ribulose-5-phosphate [Ru5P] + ribose-5-phosphate [R5P] + xylulose-5-phosphate [Xu5P], and sedoheptulose-7-phosphate [S7P]) (C). Data are represented as the mean ± SD (n = 4 biological replicates). D Quantification of mRNA levels of glucose 6 phosphate dehydrogenase [G6PD] and 6-phosphogluconate dehydrogenase [PGD] in WT and BNIP3/NIX DKO cells. Data were calculated as the ratio to WT and are represented as the mean ± SEM (n = 3 technical replicates). E Mass spectrometric abundance of cysteine and γ-glutamylcysteine in WT and BNIP3/NIX DKO cells. Data are represented as the mean ± SEM (n = 4 biological replicates). F Quantification of GSH, GSSG, and the GSH/GSSG ratio in WT and BNIP3/NIX DKO cells. Data were normalized by the cell number and are represented as the mean ± SEM (n = 3 biological replicates). G Quantification of mRNA levels of genes in the glutathione synthesis pathway. Data were calculated as the ratio to WT and are represented as the mean ± SEM (n = 3 technical replicates). H, I Nuclear Nrf2 protein levels in WT and BNIP3/NIX DKO cells. Nuclear fractions were prepared and subjected to immunoblot analysis (H). Nrf2 band intensities were measured and are shown as the ratio of the intensity of BNIP3/NIX DKO cells to that of WT cells (I). Data are represented as the mean ± SEM (n = 3 biological replicates). J Quantification of mRNA levels of Nrf2 target genes. Data were calculated as the ratio to WT and are represented as the mean ± SEM (n = 3 technical replicates). *p < 0.05, **p < 0.01, ***p < 0.001, ****p < 0.0001; NS not significant by two-way ANOVA (B, C) or by Student’s t-test (D-G, I, J).
Fig. 4
Fig. 4. Mitophagy suppresses ferroptosis induced by compromising antioxidant enzymes.
A Cell viability of WT and BNIP3/NIX DKO cells in DMEM containing 100 µM BSO and 10 mM 3-AT. Cell viability was measured by the CCK8 assay and is shown as the ratio to Control_WT. Data are represented as the mean ± SEM (n = 3 biological replicates). B Cell viability of BNIP3/NIX DKO cells in DMEM containing 100 µM BSO and 10 mM 3-AT in the presence or absence of cell death inhibitors (10 µM Z-VAD-fmk or 1 µM ferrostatin-1 [Fer-1]) and an iron chelator (50 µM DFP). Cell viability was measured and is shown as the ratio to Control_Vehicle. Data are represented as the mean ± SEM (n = 3 biological replicates). Immunoblot analysis of FTH1 in WT and BNIP3/NIX DKO cells. Cells were cultured in the presence or absence of 100 µM BSO and 10 mM 3-AT (C). Cells were cultured in DMEM containing 100 µM BSO and 10 mM 3-AT in the presence or absence of 50 µM DFP (D). All cultures were also supplemented with 1 µM Fer-1 to prevent ferroptosis. E Images of C11-BODIPY 581/591 in WT and BNIP3/NIX DKO cells in the presence or absence of BSO and 3-AT. Oxidized and reduced C11-BODIPY are indicated by green and magenta, respectively. Bars, 10 µm. Oxidized C11-BODIPY intensities from fluorescence images were measured and are shown as the ratio to Control_WT. Data are represented as the mean ± SEM. (n = 3 biological replicates; more than 100 cells were analyzed in each replicate). F Cell viability of BNIP3/NIX DKO cells expressing BNIP3 or NIX variants. EV indicates the transduction of an empty vector. Cell viability was measured and represented as in (A). Data are represented as the mean ± SEM (n = 3 biological replicates). G Cell viability of BNIP3/NIX DKO cells in DMEM containing 100 µM BSO and 10 mM 3-AT in the presence of 10 µM MitoTEMPO. Cell viability was measured and is shown as the ratio to Control_Vehicle. Data are represented as the mean ± SEM (n = 3 biological replicates). **p < 0.01, ***p < 0.001; NS not significant by one-way ANOVA.
Fig. 5
Fig. 5. Schemes of responses to several oxidative stresses in WT and mitophagy-deficient cells.
A Mitophagy primarily downregulates mtROS in WT cells. B mtROS is elevated in mitophagy-deficient cells, leading to activation of Nrf2 pathway. C, D GSH and catalase redundantly downregulate mtROS. E Simultaneous inhibition of GSH and catalase enhances mtROS, leading to ferroptosis.

References

    1. Gambert S, Ricquier D. Mitochondrial thermogenesis and obesity. Curr Opin Clin Nutr Metab Care. 2007;10:664–70. doi: 10.1097/MCO.0b013e3282f0b69d. - DOI - PubMed
    1. Wallace DC. A mitochondrial paradigm of metabolic and degenerative diseases, aging, and cancer: a dawn for evolutionary medicine. Annu Rev Genet. 2005;39:359–407. doi: 10.1146/annurev.genet.39.110304.095751. - DOI - PMC - PubMed
    1. Wanders RJ, Ruiter JP, IJLst L, Waterham HR, Houten SM. The enzymology of mitochondrial fatty acid beta-oxidation and its application to follow-up analysis of positive neonatal screening results. J Inherit Metab Dis. 2010;33:479–94. doi: 10.1007/s10545-010-9104-8. - DOI - PMC - PubMed
    1. Palikaras K, Lionaki E, Tavernarakis N. Mechanisms of mitophagy in cellular homeostasis, physiology and pathology. Nat Cell Biol. 2018;20:1013–22. doi: 10.1038/s41556-018-0176-2. - DOI - PubMed
    1. Pickles S, Vigié P, Youle RJ. Mitophagy and quality control mechanisms in mitochondrial maintenance. Curr Biol. 2018;28:R170–85. doi: 10.1016/j.cub.2018.01.004. - DOI - PMC - PubMed

MeSH terms

LinkOut - more resources