. 2024 Mar 22;7(1):353.
doi: 10.1038/s42003-024-06052-5.

Platinum iodido drugs show potential anti-tumor activity, affecting cancer cell metabolism and inducing ROS and senescence in gastrointestinal cancer cells

Affiliations

Platinum iodido drugs show potential anti-tumor activity, affecting cancer cell metabolism and inducing ROS and senescence in gastrointestinal cancer cells

Jorge Melones-Herrero et al. Commun Biol. .

Abstract

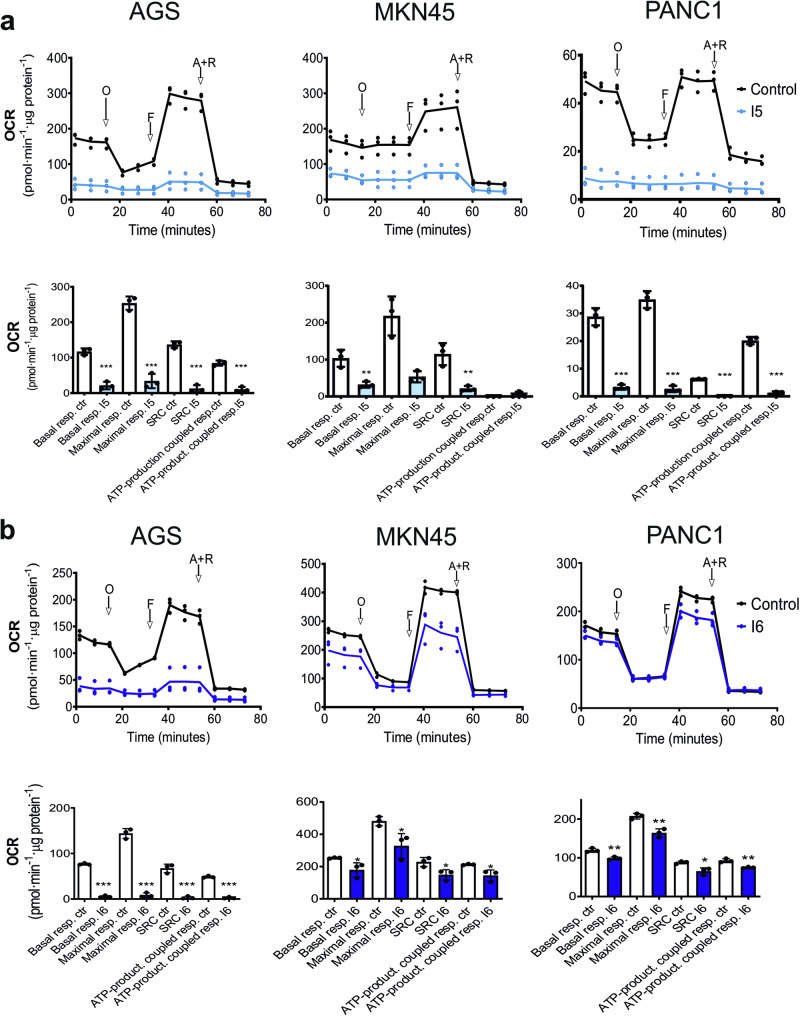
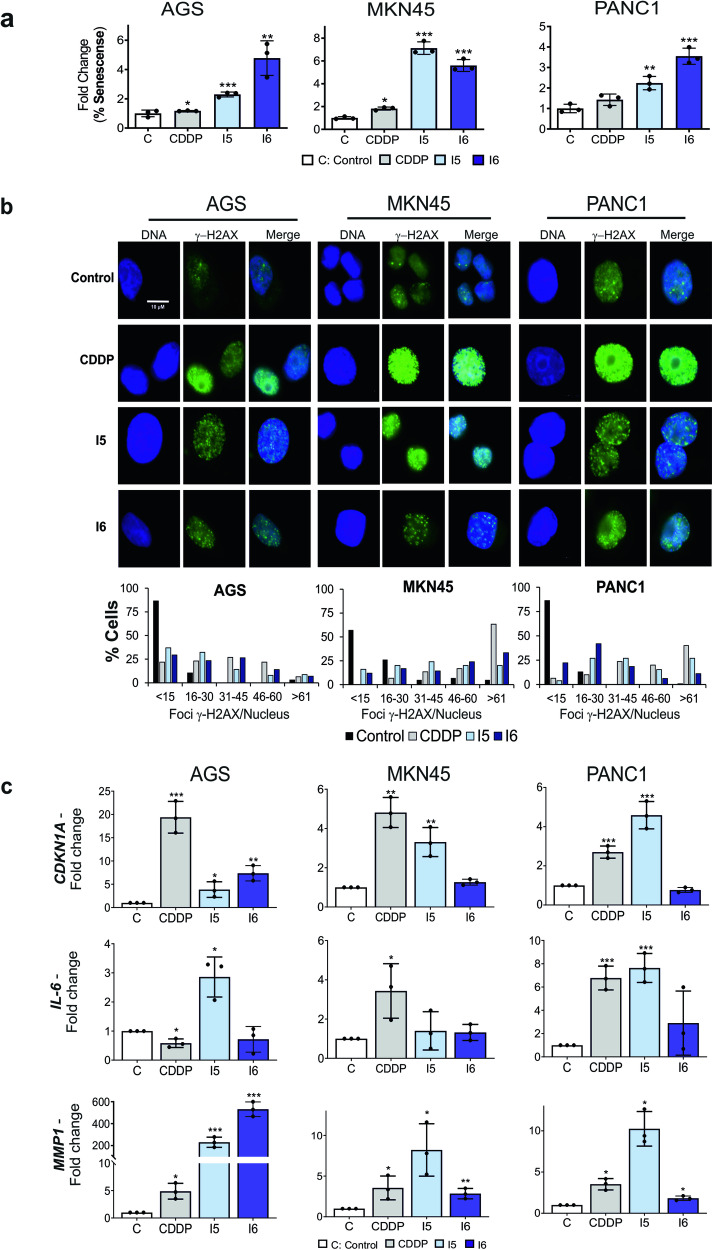
Cisplatin-based chemotherapy has associated clinical disadvantages, such as high toxicity and resistance. Thus, the development of new antitumor metallodrugs able to overcome different clinical barriers is a public healthcare priority. Here, we studied the mechanism of action of the isomers trans and cis-[PtI2(isopropylamine)2] (I5 and I6, respectively) against gastrointestinal cancer cells. We demonstrate that I5 and I6 modulate mitochondrial metabolism, decreasing OXPHOS activity and negatively affecting ATP-linked oxygen consumption rate. Consequently, I5 and I6 generated Reactive Oxygen Species (ROS), provoking oxidative damage and eventually the induction of senescence. Thus, herein we propose a loop with three interconnected processes modulated by these iodido agents: (i) mitochondrial dysfunction and metabolic disruptions; (ii) ROS generation and oxidative damage; and (iii) cellular senescence. Functionally, I5 reduces cancer cell clonogenicity and tumor growth in a pancreatic xenograft model without systemic toxicity, highlighting a potential anticancer complex that warrants additional pre-clinical studies.


Conflict of interest statement

The authors declare no competing interest.

Figures

Fig. 1
Fig. 1. Iodido agents induce oxidative DNA damage and produce mitochondrial dysfunction in GI cancer cells.
a Oxidative DNA damage (FPG sensitive lesions) at telomeres (left up), mitochondria regions encoding for mitochondrial MT-COX1 (right up) and MT-CYB (right down) genes, as well as the nuclear 36B4 single copy gene (left down) in cells exposed, or not, to IC50 concentrations (see Methods for details) of CDDP or compounds I5 or I6 during 24 h. The differences in PCR kinetics (ΔCt) between FPG-digested vs undigested DNA (Buffer) is represented for each sample. Bars represent the mean fold change ± SEM 10–12 replicates from three independent experiments normalized to the control. Statistical significance was calculated using two-tailed unpaired t-test (*p < 0.05, **p < 0.01, *** p < 0.001, ns not significant). b Mean fold change ± SD of the ratio of ΔΨm probe (CMX-ROS)/Mitochondrial mass probe (MitoGreen) as a measurement to evaluate mitochondrial functionality in AGS, MKN45 and PANC1 treated with CDDP, I5 or I6 (IC50 doses for 24 h). *p < 0.05, **p < 0.01, as determined by unpaired two-sided Student’s t-test, compared to untreated (C: Control) set as 1.0.
Fig. 2
Fig. 2. I5 and I6 affect gastric and pancreatic tumor cells oxygen consumption and mitochondrial functional properties.
a, b (upper panels) Representative plots showing mean ± SD of the oxygen consumption rate (OCR) calculated for untreated (Control) and I5- or I6-treated AGS, MKN45 and PANC1 cells (according to IC50, 24 h), normalized to total protein using a BCA kit (measured as BCA absorbance). Cells were treated with distinct inhibitors of mitochondrial function: O (oligomycin), F (FCCP), A (antimycin A), and R (rotenone). Continuous OCR values (pmoles/min/µg protein) are shown. a, b (bottom panels) Mean ± SD of measured and calculated mitochondrial function parameters (n = 3 biological replicates with 3 readings). *p < 0.05, **p < 0.01, ***p < 0.001, as determined by unpaired two-sided Student’s t-test.
Fig. 3
Fig. 3. Iodido agents induce cellular senescence in GI cancer cells.
a Mean fold change ± SD in CellEvent Senescense Green Probe detection, determined by flow cytometry, in AGS, MKN45 and PANC1 cells treated with CDDP, I5 or I6 IC50 doses for 24 h. *p < 0.05, **p < 0.01, ***p < 0.001, as determined by unpaired two-sided Student’s t-test, compared to untreated (C) set as 1.0. b AGS, MKN45 and PANC1 cells were treated with CDDP, I5 or I6 (IC50 concentration, see Methods) for 3 h. γ-H2AX foci (green fluorescence) were detected by immunofluorescence using DAPI to stain nuclear DNA (blue fluorescence). Representative images of each condition were taken. Graphs represent the percentage of nuclei with <15, between 16 and 30, between 31 and 45, between 46 and 60 and >60 γ-H2AX foci per nuclei for each condition. Data represent the mean values obtained in three experiments performed in duplicate. c RNA was isolated from AGS, MKN45 and PANC1 cell lines stimulated with a 24 h treatment of the complexes. CDKN1A, IL-6 and MMP1 were quantified by RT-qPCR. Target gene expression was normalized to GAPDH. All the experiments were performed three times with IC50 concentrations of each compound used in all the assays. The statistical significance was evaluated with Student’s 2-tailed t-test (*p < 0.05, **p < 0.01, ***p < 0.001) compared to untreated (C) set as 1.0.
Fig. 4
Fig. 4. A stress signaling pathway is activated after treatment with iodido prototypes.
a Top: Representative western blots of phosphorylated forms of p53, JNK, p38 and ERK, in AGS and PANC1 cells after the treatment with IC50 concentration of CDDP, I5 or I6 at different times (1, 3, 6 and 24 h). α-Tubulin was used as an endogenous loading control. Bottom: Graphs show the mean ± SD densitometric analyses of each protein normalized with α-tubulin from three independent experiments by using ImageJ (Area under the peak method), Control cells (C, white bars), CDDP (gray), I5 (light blue) and I6 (dark blue). b RNA was isolated from AGS, MKN45 and PANC1 cell lines stimulated with a 24 h treatment of the complexes. MAP2K3 expression levels were quantified by RT-qPCR and normalized with GAPDH. Shown are the mean fold change ± SD from triplicate samples (n = 3). The statistical significance was evaluated with Student’s 2-tailed t-test (*p < 0.05, **p < 0.01, ***p < 0.001, ****p < 0.0001) compared to the untreated cells (C: Control) set as 1.0.
Fig. 5
Fig. 5. Iodido compounds modulate redox cell response and generate ROS in GI cancer cells.
a RNA was isolated from AGS, MKN45 and PANC1 cell lines stimulated with a 24 h treatment of CDDP or the iodido complexes (IC50 concentration, see Methods). SOD1, SOD2 and CAT were quantified by RT-qPCR. Target gene expression levels were normalized with GAPDH. Shown are the mean fold change ± SD from triplicate samples (n = 3). b Detection of ROS in MKN45 cells after the treatment with H2O2 (200 µM) and the IC50 concentration of CDDP, I5 or I6 by confocal microscopy using DHE and MitoSox as O2•− fluorescence indicator, in cytosol and mitochondria, respectively. Cells were treated with the compounds for 1 h followed by 30 min of incubation with the probes. Left: Representative images of each condition were taken. Scale bar represents 20 μm. Right: Mean fluorescence intensity ± SD (per cell) was quantified and depicted in the graph. The experiment was performed three independent times in duplicate. a.u. = arbitrary units. c Ratio of GSH/GSSG determined with a commercial colorimetric kit (see Methods). AGS and PANC1 cells were treated with the IC50 concentration of the compounds and were collected after 3 h and 24 h to perform the assay. n = 3. Shown is the ratio of GSH/GSSG ± SD. In all the experiments, statistical significance was evaluated with Student’s 2-tailed t-test (*p < 0.05, **p < 0.01, ***p < 0.001, ****p < 0.0001) compared to the untreated cells (C: Control) set as 1.0.
Fig. 6
Fig. 6. I5 reduces in vivo PANC1 tumor growth.
a Summary of the in vivo experimental design for the pre-treated PANC1 cell xenograft in vivo studies. Schematic created with BioRender.com. b Growth curves indicating tumor take (left, defined as no. tumors formed/no. of injections at the indicated time point) or the mean tumor volume (mm3) (right) ± SD over 28 days following injection of 1 × 105 Control diluent-treated or I5-treated PANC1 cells. (no. of injections = 8–9). c Quantification of the mean tumor volume and mean weights (g) ± SD for control (c) and I5-pre-treated tumors (no. of injections = 8–9). Statistical significance was evaluated with Student’s 2-tailed t-test (**p < 0.01, ***p < 0.001). d Indirect calorimetry analyses of mice treated with I5. Left: Respiratory exchange ratio (RER) was determined as VCO2/VO2 and right: Energy expenditure (EE) was calculated as (3.185 + 1.232 x RER) x VO2. Shown are the mean RER and mean EE (Kcal/h/Kg) values ± SD for mice implanted treated intravenously with I5 (1.4 mg/Kg) or physiological saline (i.e., Sham) as a function of time (24 h). e Summary of the in vivo experimental design for the treatment of mice harboring PANC1 xenografted tumors. Schematic created with BioRender.com. f Average fold change in tumor volume ± SEM in mice bearing PANC1 xenografts and treated with diluent control (Control), I5 (1.4 mg/kg i.p. or r.o.; 3-times per week) and compared to d0 (n = 5-7 tumors/group). g Mean fold change in tumor volume ± SEM (left) or tumor weight ± SEM (right) determined at treatment cessation. *p < 0.05, as determined by one-way ANOVA with Dunnett post-test, compared to Control. ns not significant; g gram; d0 day 0.

Similar articles

Cited by

References

    1. Kelland L. The resurgence of platinum-based cancer chemotherapy. Nat. Rev. Cancer. 2007;7:573–584. doi: 10.1038/nrc2167. - DOI - PubMed
    1. Rottenberg S, Disler C, Perego P. The rediscovery of platinum-based cancer therapy. Nat. Rev. Cancer. 2021;21:37–50. doi: 10.1038/s41568-020-00308-y. - DOI - PubMed
    1. Fouani L, Menezes SV, Paulson M, Richardson DR, Kovacevic Z. Metals and metastasis: exploiting the role of metals in cancer metastasis to develop novel anti-metastatic agents. Pharmacol Res. 2017;115:275–287. doi: 10.1016/j.phrs.2016.12.001. - DOI - PubMed
    1. Choi Y-M, et al. Mechanism of cisplatin-induced cytotoxicity is correlated to impaired metabolism due to mitochondrial ROS generation. PLoS One. 2015;10:e0135083. doi: 10.1371/journal.pone.0135083. - DOI - PMC - PubMed
    1. Matesanz AI, Herrero JM, Faraco EJ, Cubo L, Quiroga AG. New platinum (II) triazole thiosemicarbazone complexes: analysis of their reactivity and potential antitumoral action. ChemBioChem. 2020;21:1226–1232. doi: 10.1002/cbic.201900545. - DOI - PubMed

Publication types