. 2024 Jul;5(7):1024-1044.
doi: 10.1038/s43018-024-00748-7. Epub 2024 Mar 22.

Threonine fuels glioblastoma through YRDC-mediated codon-biased translational reprogramming

Affiliations

Threonine fuels glioblastoma through YRDC-mediated codon-biased translational reprogramming

Xujia Wu et al. Nat Cancer. 2024 Jul.

Abstract

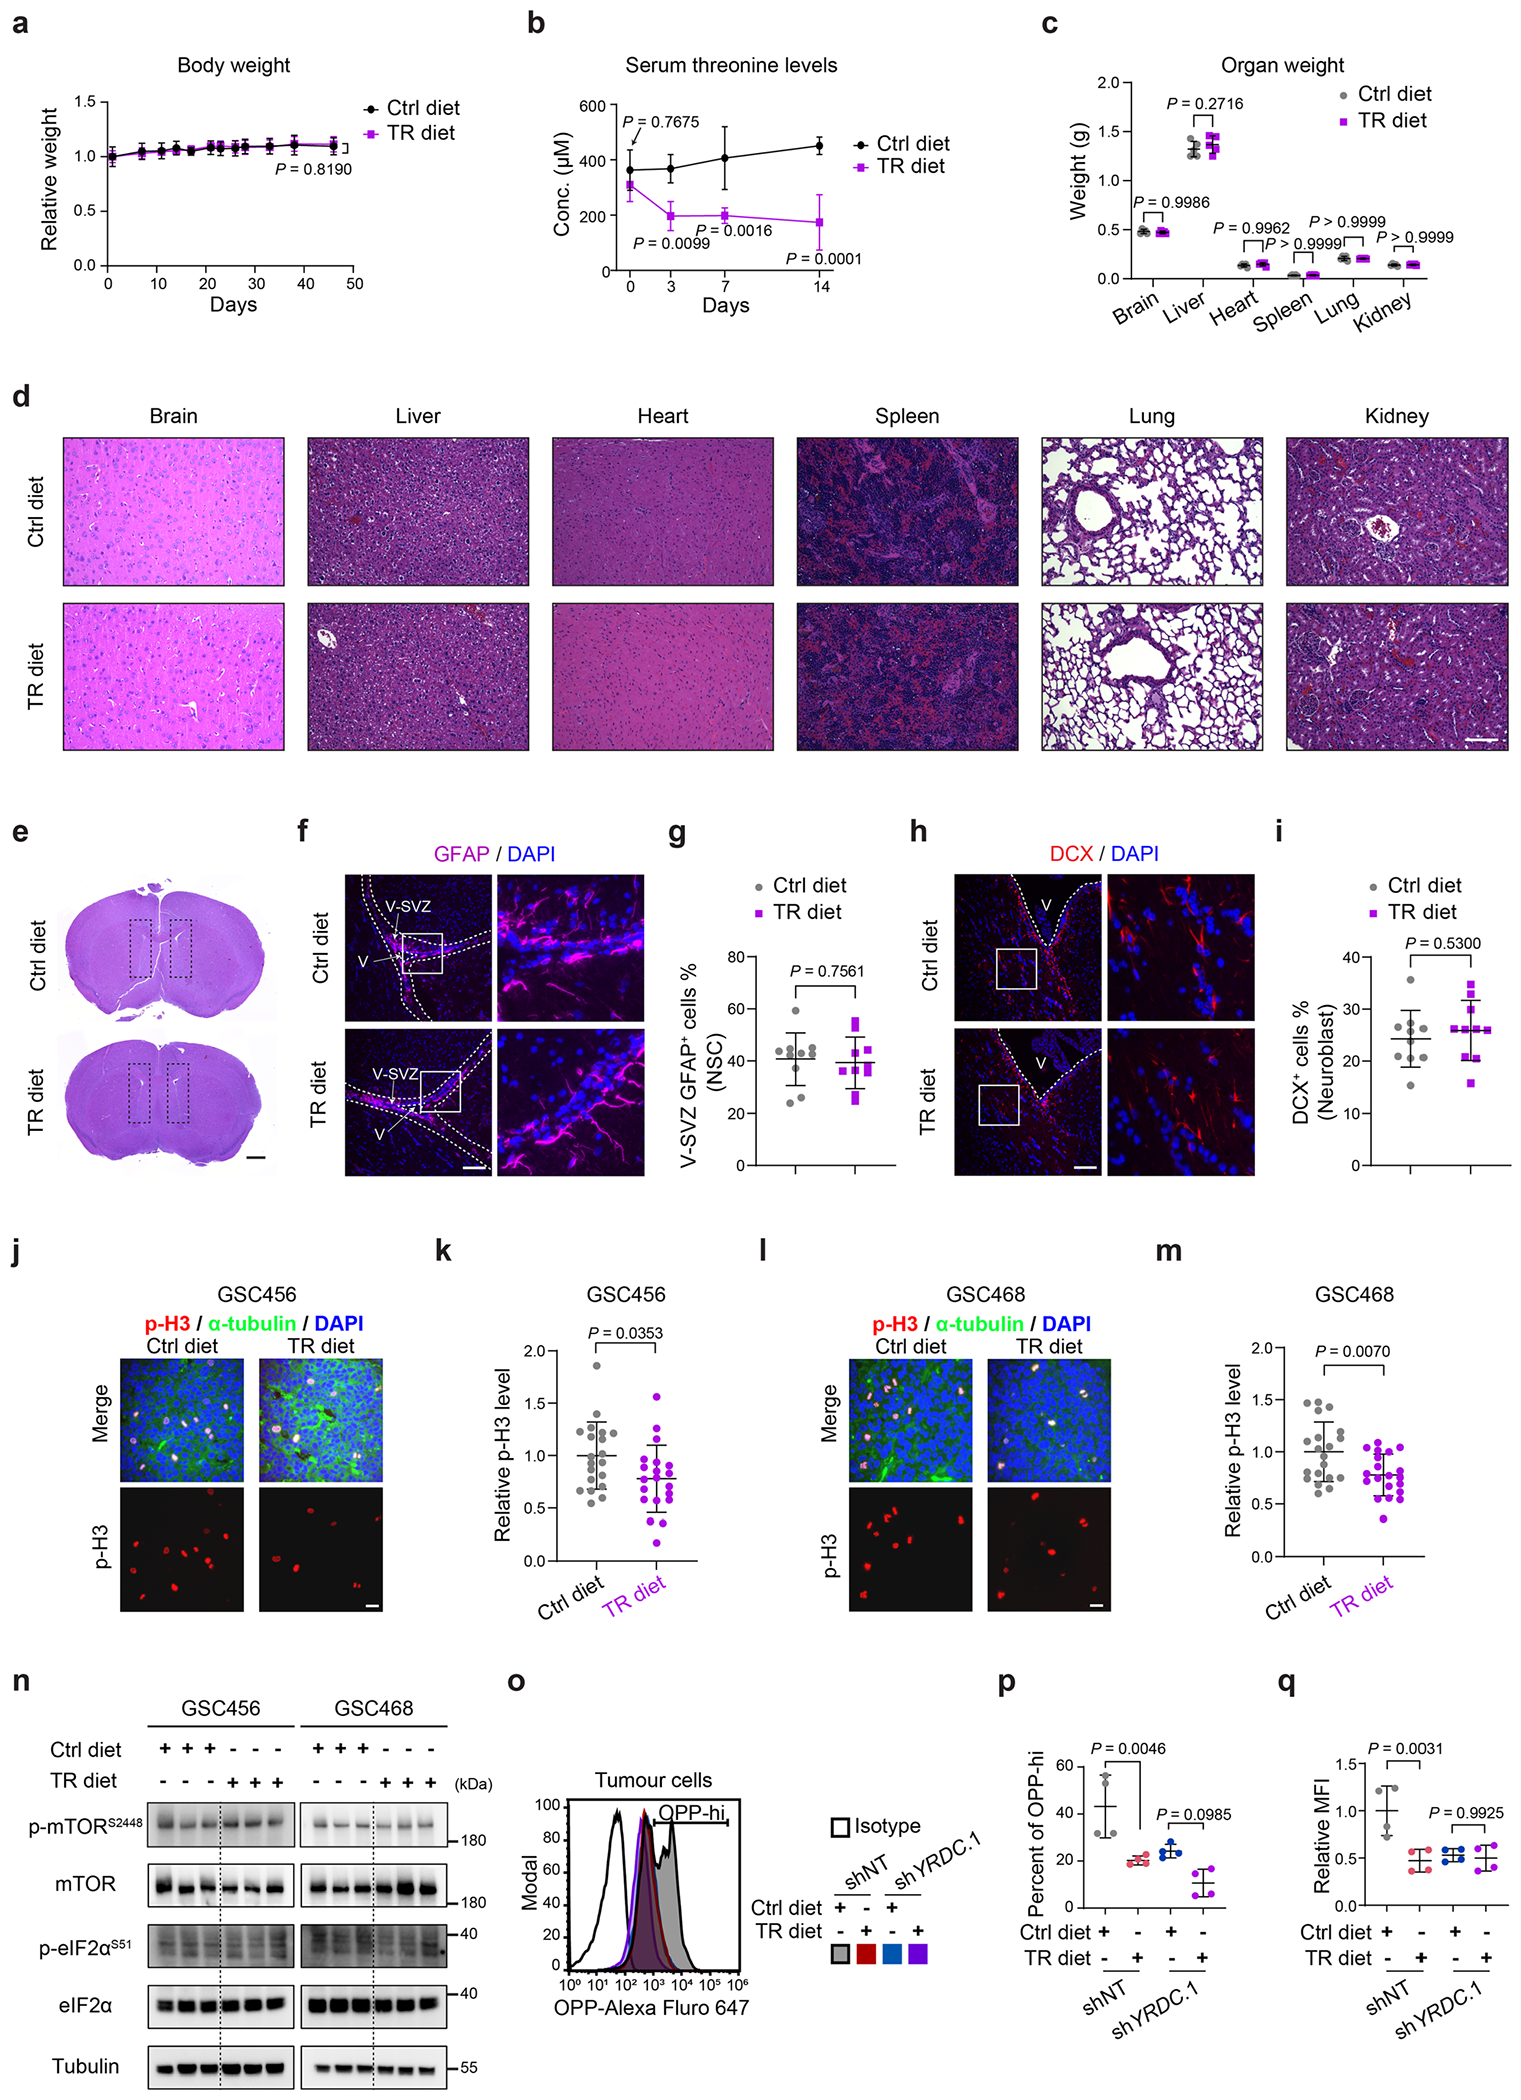
Cancers commonly reprogram translation and metabolism, but little is known about how these two features coordinate in cancer stem cells. Here we show that glioblastoma stem cells (GSCs) display elevated protein translation. To dissect underlying mechanisms, we performed a CRISPR screen and identified YRDC as the top essential transfer RNA (tRNA) modification enzyme in GSCs. YRDC catalyzes the formation of N6-threonylcarbamoyladenosine (t6A) on ANN-decoding tRNA species (A denotes adenosine, and N denotes any nucleotide). Targeting YRDC reduced t6A formation, suppressed global translation and inhibited tumor growth both in vitro and in vivo. Threonine is an essential substrate of YRDC. Threonine accumulated in GSCs, which facilitated t6A formation through YRDC and shifted the proteome to support mitosis-related genes with ANN codon bias. Dietary threonine restriction (TR) reduced tumor t6A formation, slowed xenograft growth and augmented anti-tumor efficacy of chemotherapy and anti-mitotic therapy, providing a molecular basis for a dietary intervention in cancer treatment.


Conflict of interest statement

Competing interests

The authors declare no competing interests.

Figures

Extended Data Fig. 1 |
Extended Data Fig. 1 |. GSCs display high translation rates.
a-e. Gating strategy (a), representative histogram plot (b, d) and statistical quantification (c, e, n = 5 mice per group) of OPP flow cytometric analysis of indicated cell populations in GSC456 derived intracranial tumour. f-i. Distribution of all GSCs and all tumour cells (f), visualization of stemness marker PPP1R14B and differentiation marker GFAP (g), distribution of GSCs and tumour-like GSCs split from all GSCs (h) and differentiated tumour cells and GSC-like tumour cells split from all tumour cells (i) on PCA plot in scRNA-seq analysis of 28 early-passage GSC cultures derived from 24 patients and 14,207 malignant cells from seven GBM patients. In g, PCA plots binned into hexbins that represent median AUC score of all overlapping cells within a given coordinate. Contour lines represent the outline of all GSC (red) and all tumour cells (black). j, k. Quantification of puromycin signal from immunoblot in Fig. 1n (j, n = 1 per group) and Fig. 1o (k, n = 1 per group). Puromycin signal was normalized to tubulin. l, m. Cell viability of indicated GSCs vs DGCs (n = 5 independent experiments). n, o. Cell viability of indicated cells with or without Alvocidib treatment (n = 5 independent experiments). p. Immunoblots showing puromycin incorporation in indicated cells with or without Alvocidib treatment for 72 h. q. Immunoblots showing p-mTORS2448, mTOR, p-AMPKαT172, AMPKα, p-eIF2αS51, eIF2α in matched GSCs and DGCs. In c and e, boxes represent data within the 25th to 75th percentiles, whiskers depict the range of all data points and horizontal lines within boxes represent median values. In l-o, data are presented as mean ± s.d. In p and q, immunoblots are representative from three independent experiments with similar results. Two-tailed paired t test for c and e. Two-way ANOVA followed by multiple comparison for l-o.
Extended Data Fig. 2 |
Extended Data Fig. 2 |. YRDC expression is driven by OLIG2.
a. Gene rank of positive selection results in CRISPR knockout screens of GSC456 and GSC23. The higher of the y axis indicates lesser gene essentiality. The top 3 ranked genes are labelled. b. ChIP-seq analysis of H3K27ac signal on YRDC promoter in indicated cells. c. ChIP-seq analysis of H3K27ac signal on YRDC promoter in DGC_MGG8 reprogramming (GSE54047). d. Comparison of the expression of TFs potentially associated with YRDC in RNA-seq data of GSC vs. DGC (GSE54791) and GSC vs. NSC (GSE119834). Dash lines show the cut-off (|log2FC|>1). Red dots indicate TFs enriched in GSCs. e. Box plot showing the expression of YRDC, OLIG1 and OLIG2 in RNA-seq data of GSC vs. DGC (GSE54791) (upper, n = 9 transcriptomics per group) and GSC vs. NSC (GSE119834) (lower, n = 44 GSC transcriptomics and 9 NSC transcriptomics). f-i. QPCR analysis (f, h, n = 3 independent experiments) and immunoblots (g, i) showing YRDC, OLIG1 and OLIG2 expression in GSCs with or without indicated knockdown. j. OLIG2 ChIP-seq analysis on YRDC promoter region in MGG8_GSC (GSE54047). k. Graphic illustration of predicted OLIG2 binding sites (BSs) on YRDC promoter. l. OLIG2 ChIP-qPCR analysis in GSCs detecting indicated BS in k (n = 3 independent experiments). m, n. Pearson correlations between YRDC and OLIG2 expression in RNA-seq data of CCGA_GBM (primary, IDH_WT, n = 183 patients) (m) and Mack_GBM (n = 45 patients) (n) datasets. Red lines show linear regression. In e, boxes represent data within the 25th to 75th percentiles, whiskers depict the range of all data points and horizontal lines within boxes represent median values. In f, h, and l, data are presented as mean ± s.d. In g and i, immunoblots are representative from three independent experiments with similar results. Two-tailed unpaired t test for e. One-way ANOVA followed by multiple comparison for f and h. Two-way ANOVA followed by multiple comparison for l. Two-tailed Pearson correlation for m and n.
Extended Data Fig. 3 |
Extended Data Fig. 3 |. Specific requirement of YRDC in GSCs than NSCs.
a. Immunoblots showing YRDC expression in GSCs with or without YRDC knockdown. b, c. Representative images of EdU incorporation assay (b) (scale bar, 50 μm) and sphere formation assay (c) (scale bar, 100 μm) in GSCs with or without YRDC knockdown. d. Immunoblots showing YRDC expression in NSCs with or without YRDC knockdown. e. Cell viability of NSCs with or without YRDC knockdown (n = 5 independent experiments). f. Immunoblots showing p-mTORS2448, mTOR, p-eIF2αS51, eIF2α expression in GSCs with or without YRDC knockdown. in e, data are presented as mean ± s.d. in a-d and f, immunoblots and images are representative from three independent experiments with similar results. Two-way ANOVA followed by multiple comparison for e.
Extended Data Fig. 4 |
Extended Data Fig. 4 |. Threonine metabolism in GSC supports t6A formation.
a, b. Immunoblots showing puromycin incorporation, p-mTORS2448, mTOR, p-eIF2αS51, eIF2α expression in GSC456 cultured in indicated media for 72 h. Ctrl, 800 μM threonine and 400 μM arginine. 5xThr, 4000 μM threonine. 5xArg, 2000 μM arginine. TR, 8 μM threonine. AR, 4 μM arginine. c. MS analysis of intracellular threonine levels in indicated cells. Left, n = 5 biologically independent samples per group; right, n = 3 biologically independent samples per group. d, e. QPCR analysis of SLC1A4 (d, n = 3 independent experiments) and SLC1A5 (e, n = 3 independent experiments) in matched GSCs and DGCs. f. Graphic illustration of threonine metabolism in human. Red indicates enriched and green indicates depleted in GSCs. Crosses indicate nonfunctional catabolic pathways in humans. g. QPCR analysis of SDS in matched GSCs and DGCs (n = 3 independent experiments). In c-e, and g, data are presented as mean ± s.d. In a and b, immunoblots are representative from three independent experiments with similar results. One-way ANOVA followed by multiple comparison for c. Two-way ANOVA followed by multiple comparison for d, e and g.
Extended Data Fig. 5 |
Extended Data Fig. 5 |. YRDC and threonine shift the proteome supporting mitosis with ANN codon-bias.
a, b. Volcano plot showing the differentially expressed gene analysis of ANN and non-ANN decoding tRNA isodecoders in tRNA-seq data of GSC456 with indicated treatments. Cut-off: |log2FC|>1, adjusted P < 0.05. c. Expression of ANN decoding and non-ANN decoding tRNA isodecoders in tRNA-seq of GSC456 upon TR. d. GO enrichment analysis of downregulated proteins under YRDC knockdown in proteomics of GSC456. e. ANN codon frequencies of differentially expressed proteins upon TR in proteomics of GSC456. f. GO enrichment analysis of proteins downregulated only in YRDC knockdown (left), and proteins downregulated only in TR (right) in proteomics of GSC456. g, h. Flowcytometric analysis of cell cycle in GSC456 with indicated treatments (n = 3 independent experiments). i,j. QPCR analysis of indicated t6A targets in GSCs with indicated treatments (n = 3 independent experiments). In c and e, boxes represent data within the 25th to 75th percentiles, whiskers depict the range of all data points and horizontal lines within boxes represent median values. In g-j, data are presented as mean ± s.d. In a-c, tRNA-seq data are from 3 biologically independent samples per group. In e, proteomic data are from 4 biologically independent samples per group. Two-tailed unpaired t test for c. Overrepresentation test corrected by FDR for d and f. Two-tailed Mann-Whitney test for e. Two-way ANOVA followed by multiple comparison for g-j.
Extended Data Fig. 6 |
Extended Data Fig. 6 |. Data mining of t6A downstream targets in clinical datasets.
a. BF scores of SPC25, MASTL, RACGAP1, CIP2A, CEP55 and NCAPG in genome wide CRISPR knockout screens of GSCs and GBM cell lines (n = 24 independent screens per group). The greater positive BF score indicates higher confidence of essentiality. Data are presented as mean ± s.d. b. Correlations between YRDC and SPC25, RACGAP1, CIP2A, CEP55, NCAPG protein abundance in proteomics of PDC_GBM (n = 99). Red lines show linear regression of the data. MASTL was not detected in this dataset. c. Correlation heatmap of targets from b. The size of circle indicates the value of correlation coefficient. Red colour represents positive correlation and blue colour represents negative correlation. d, e. Violin plot of SPC25, MASTL, RACGAP1, CIP2A, CEP55, NCAPG expression (log2(count+0.5)) in RNA-seq data of TCGA (Grade II, n = 226; Grade III, n = 244; Grade IV, n = 150) (d) and CGGA (Grade II, n = 232; Grade III, n = 194; Grade IV, n = 225) (e) datasets. Violin plots represent the overall distribution of data points, horizontal lines show median, upper, and lower quartiles. In b, d and e, the number of n indicates patients. Two-tailed Pearson correlation for b and c. One-way ANOVA followed by multiple comparison for d and e.
Extended Data Fig. 7 |
Extended Data Fig. 7 |. YRDC loss reduces translation of cell cycle-related transcripts.
a. Distribution of read length of ribosome footprints in ribosome profiling of GSC456. Data are presented as mean ± s.e.m. b. Heatmap showing the 3-nt periodicity of ribosome footprints with different read lengths (25-35 nt) on CDS. Data are plotted as the signal of the first nucleotide of ribosome P site on three-nucleotide (0, 1, 2) codon frames. The small table on the right provides detailed experimental setup for each group. c. Volcano plot showing the differential translation efficiency (TE) of GSC456 upon YRDC knockdown (cut-off: |log2FC|>1, adjust P < 0.05). Red indicates genes with upregulated TE and blue indicates genes with downregulated TE. d. GO enrichment analysis of genes with downregulated TE upon YRDC knockdown. e. Non-ANN codon occupancy alteration upon YRDC knockdown and TR at ribosome A-site. Black dots and labels show overlapped stalled codons under both conditions. f-h. Overlapped-non-ANN codon frequencies of differentially expressed proteins in proteomics of GSC456 with indicated treatments. i. Distribution of overlapped-non-ANN codon frequencies in CDS. Yellow dots indicate 6 t6A targets.j, k. QPCR analysis of transcript expression of indicated reporters in 293 T with indicated treatments (n = 3 independent experiments). In f-h, boxes represent data within the 25th to 75th percentiles, whiskers depict the range of all data points and horizontal lines within boxes represent median values. In j and k, data are presented as mean ± s.d. In a-e, ribosome profiling data are from 2 biologically independent samples per group. In f-h, proteomics data are from 4 biologically independent samples per group. Overrepresentation test corrected by FDR for d. Two-tailed Mann-Whitney test for f-h. Two-tailed unpaired t test forj and k.
Extended Data Fig. 8 |
Extended Data Fig. 8 |. Targeting YRDC in vivo suppresses tumour growth.
a, b. QPCR analysis (a, n = 3 independent experiments) and immunoblots (b) showing YRDC expression in two GSCs with or without YRDC knockdown for in vivo tumorigenesis. c. Representative in vivo bioluminescence images of tumour-bearing mice derived from GSC468 with or without YRDC knockdown at indicated timepoint. Scale bar, 1 cm. d, e. Representative images of H&E-stained brain sections of tumour-bearing mice derived from GSC456 (d) and GSC468 (e) at indicated timepoint. Scale bar, 1 mm. f-i. Representative images (f, h) and quantification (g, i, n = 15 randomly selected fields examined over 3 mice per group) of phosphorylated histone H3 (p-H3, red) in brain sections derived from indicated xenografts. α-tubulin (green) shows the cytoplasm and DAPI (blue) shows the nucleus. Scale bar, 20 μm. In a, g and i, data are presented as mean ± s.d. In b, immunoblots are representative from three independent experiments with similar results. In c-e, images are representative from 5 mice. One-way ANOVA followed by multiple comparison for a, g and i.
Extended Data Fig. 9 |
Extended Data Fig. 9 |. Dietary threonine restriction is safe and effective.
a, b. Body weight (a, n = 5 mice per group) and serum threonine levels (b, n = 3 mice in control group at Day 14, n = 4 mice per group in others) of tumour-free mice fed with indicated diets at indicated time points. c, d. Weight (c, n = 5 mice per group) and representative H&E-stained images (d) of indicated organs from tumour-free mice fed with indicated diets for 30 days. Scale bar, 100 μm. e. Representative H&E-stained brain section of tumour-free mice fed with indicated diets. Rectangles show the region of interest for NSC analysis. Scale bar, 2 mm. f-i. Representative images (f, h) and quantification (g, i, n = 10 randomly selected fields examined over 3 mice per group) of V-SVZ GFAP+ cells (NSCs) and DCX+ cells (neuroblasts) in tumour-free mice fed with indicated diets for 30 days. Rectangles show the enlarged region. V, ventricle. V-SVZ, ventricular–subventricular zone. Scale bar, 100 μm. j-m. Representative images (j, l) and quantification (k, m, n = 20 randomly selected fields examined over 4 mice per group) of phosphorylated histone H3 (p-H3, red) in brain sections of indicated xenografts fed with indicated diets. α-tubulin (green) shows the cytoplasm and DAPI (blue) shows the nucleus. Scale bar, 20 μm. n. Immunoblots showing p-mTORS2448, mTOR, p-eIF2αS51, eIF2α expression in tumour tissues from indicated xenografts fed with indicated diets. Each lane represents a sample from one mouse. o-q. Representative histogram plot (o), quantification of the percentage of OPP-hi tumour cells (p, n = 4 mice per group), and quantification of the median fluorescence intensity (MFI) (q, n = 4 mice per group) of OPP flow cytometric analysis in GSC456 derived xenograft with indicated treatments. In a-c, g, i, k, m, p and q, data are presented as mean ± s.d. In n, immunoblots are from three independent experiments with similar results. Two-way ANOVA followed by multiple comparison for a and b. Two-tailed unpaired t test for c, g, i, k and m. One-way ANOVA followed by multiple comparison for p and q.
Extended Data Fig. 10 |
Extended Data Fig. 10 |. Data mining of YRDC expression in clinical datasets.
a. Representative in vivo bioluminescence images of GSC468-bearing mice with indicated treatments at indicated timepoints. Scale bar, 1 cm. b-e. Violin plot of YRDC expression in RNA-seq data of TCGA_LGG, GBM (Grade II, n = 226; Grade III, n = 244; Grade IV, n = 150) (b), CGGA (Grade II, n = 232; Grade III, n = 194; Grade IV, n = 225) (c), Rembrandt (Grade I-II, n = 100; Grade III, n = 85; Grade IV, n = 130) (d) and Gravendeel (Grade I-II, n = 32; Grade III, n = 85; Grade IV, n = 159) (e) datasets. f. Violin plot of YRDC expression in different subtypes in RNA-seq data of TCGA_GBM. PN, proneural, n = 46; CL, classical, n = 59; MES, mesenchymal, n = 51. g. Correlations between YRDC and PDGFRA expressions in RNA-seq data of TCGA_GBM (n = 160). Red line shows linear regression. h-j. Violin plot of YRDC expression in different PDGFRA status (diploid, n = 106; gain or amplification, n = 30) (h), IDH status (WT, wildtype, n = 142; mutant, n = 8) (i) and MGMT methylation (methylated, n = 56; unmethylated, n = 66) (j) in RNA-seq data of TCGA_GBM. k. Violin plot of YRDC expression (log2(FPKM)) in different subtypes in RNA-seq data of GSCs (GSE119834). PN, proneural, n = 10; CL, classical, n = 16; MES, mesenchymal, n = 18. The number of n indicates biologically independent cell lines. In b-f and h-k, violin plots represent the overall distribution of data points. In a, images are representative of 5 mice. In b-j, the number of n indicates patients, and the expressions are presented as log2(count+0.5). One-way ANOVA followed by multiple comparison for b-f and k. Two-tailed Pearson correlation for g. Two-tailed unpaired t test for h-j.
Fig. 1 |
Fig. 1 |. GSCs exhibit high translation rates.
a, Graphic illustration of in vivo protein translation measurement in different cell populations. Human (h) CD147 is used to mark patient-derived tumor cells; CD133 and SOX2 are used to distinguish GSCs. bi, Gating strategy (b,g), representative histogram plot (c,e,h) and statistical quantification (d,f,i) (n = 6 mice per group) of OPP flow cytometric analysis of the indicated cell populations in GSC23-derived intracranial tumors. The cutoff used to define high (OPPhi) and low (OPPlo) OPP signal is 103 on the logarithmic scale. jl, Quantification of translational activities in scRNA-seq data of 28 early-passage GSC cultures derived from 24 patients and 14,207 malignant cells from seven patients with GBM. In j, n = 65,655 for all GSCs and n = 14,207 for all tumor cells. In k, n = 64,417 for GSCs and n = 1,238 for tumor-like GSCs. In l, n = 1,971 for GSC-like tumor cells and n = 12,236 for differentiated tumor cells. m, GSEA analysis of GOBP: positive regulation of translation in RNA-seq data of matched GSCs and DGCs (GSE54791). NES, normalized enrichment score. n,o, Immunoblots showing puromycin incorporation in the indicated cells. NSC11, neural stem cell 11; HNP1, human neural progenitor 1. p, Representative images of in vitro OPP incorporation in the indicated cells. Scale bar, 20 μm. DAPI, 4,6-diamidino-2-phenylindole. In d,f,i, boxes represent data within the 25th to 75th percentiles, whiskers depict the range of all data points, and horizontal lines within boxes represent median values. In jl, violin plots represent the overall distribution of data points. Box plots show median, upper and lower quartiles; whiskers depict 1.5 times the interquartile range. In np, immunoblots and images are representative of three independent experiments with similar results. Two-tailed paired t-test for d,f,i. Two-tailed unpaired t-test for jl. Weighted Kolmogorov–Smirnov statistic test for m.
Fig. 2 |
Fig. 2 |. CRISPR screening of tRNA modifiers in GSCs.
a, Graphic illustration of CRISPR knockout screening targeting tRNA modification genes. sgRNA, single-guide RNA. RRA, robust ranking aggregation. b,c, Gene rank of negative selection results for GSC456 (b) and GSC23 (c) cells in CRISPR screens. Values lower on the y axis indicate greater gene essentiality. The top three ranked genes are labeled. d, Significant hits (P < 0.05, two sided, calculated with the MAGeCK algorithm) in negative selection results from b,c. Red color labels the enzymes involved in t6A biosynthesis. The Venn diagram shows hits overlapping in both screens. ei, Gene rank of tRNA modification genes in genome-wide CRISPR knockout screens of five GSCs. More positive BF scores indicate higher confidence of essentiality. Top hits and YRDC are highlighted. j, Gene rank plot showing differences of average quantile normalized BF (qBF) scores for each tRNA modification enzyme between GSCs and NSCs. Data are from genome-wide CRISPR knockout screens of 24 GSCs and four NSCs. Data are z transformed. Top hits and YRDC are highlighted. Diff, difference. k, Chronos analysis of YRDC dependency in different cell lines in DepMap CRISPR knockout screens (n = 1,077 independent screens in total). Score < −0.6 is used as the cutoff of essentiality. Boxes represent data within the 25th to 75th percentiles, whiskers depict the range of all data points, and horizontal lines within boxes represent median values. l, Heatmap showing z-transformed BF scores of YRDC in genome-wide CRISPR knockout screens of five carcinoma cell lines and one non-transformed epithelial cell line.
Fig. 3 |
Fig. 3 |. YRDC is essential for GSC maintenance and translation.
a, Volcano plot showing differentially expressed tRNA modification enzymes (cutoff, |log2 (fold change (FC))| > 0.8, false discovery rate (FDR) < 0.05) in RNA-seq data of GSCs versus DGCs (GSE54791). Red dots indicate upregulation, and blue dots indicate downregulation in GSCs. b, Heatmap showing expression of genes encoding tRNA modification enzymes in RNA-seq data of TCGA_GBM and the Genotype–Tissue Expression (GTEx) brain cortex. Upregulated genes encoding enzymes in GBM are labeled (cutoff, |log2 (fold change)| > 1, FDR < 0.05). C9orf64 is also known as QNG1. c, Venn diagram showing genes encoding tRNA modification enzymes that are upregulated in both GBM and GSCs. d,e, Immunoblots showing YRDC, GFAP and OLIG2 expression in the indicated cells. GFAP is a differentiation marker, and OLIG2 is a stem cell marker. fi, Cell viability (fh, n = 4 independent experiments) and quantification of EdU incorporation (i, n = 5 randomly selected fields per group) in GSCs with or without YRDC knockdown. shNT, non-targeting short hairpin RNA (shRNA). jm, Extreme limiting dilution assay (jl) and quantification of sphere formation (m) (GSC456, n = 51 (shNT), 52 (shYRDC.1), 50 (shYRDC.2); GSC468, n = 51 (shNT), 51 (shYRDC.1), 56 (shYRDC.2); GSC23, n = 53 (shNT), 34 (shYRDC.1), 50 (shYRDC.2) spheres) in GSCs with or without YRDC knockdown. n,o, MS analysis of t6A levels (n, n = 3 per group; o, n = 6 in shNT and n = 5 in shYRDC.2) and qPCR analysis of YRDC expression (n = 3 per group) in GSC456 cells transfected with the indicated shRNA species. The number of n indicates biologically independent samples. p, Immunoblots showing puromycin incorporation and YRDC expression in GSCs transfected with the indicated small interfering RNA (siRNA) species. In fi,mo, data are presented as mean ± s.d. In d,e,p, immunoblots are representative of three independent experiments with similar results. In im, data are presented from three independent experiments. Two-way ANOVA followed by multiple comparisons for fh. One-way ANOVA followed by multiple comparisons for i,m. Two-tailed likelihood-ratio test for jl. Two-tailed unpaired t-test for n,o.
Fig. 4 |
Fig. 4 |. Threonine dynamically regulates t6A and translation.
a, Graphic illustration of t6A biosynthesis. Red color indicates the focus of this study. PPi, inorganic pyrophosphate. TC-AMP, L-threonylcarbamoyladenylate. b, MS analysis of labeled t6A in [13C4,15N]l-threonine tracing experiments for 6 h (n = 4 biologically independent samples per group). c, MS analysis of t6A (left) and total adenosine (right) on tRNA extracted from GSC456 cells cultured in the indicated medium for 72 h (n = 3 biologically independent samples per group). d,e, Immunoblots showing puromycin incorporation in GSCs cultured in the indicated medium for 72 h. Ctrl, control. f, Immunoblots showing phosphorylated (p)-mTORS2448, mTOR, p-eIF2αS51 and eIF2α expression in three GSC samples cultured in the indicated medium for 72 h. g,h, Representative immunoblots (g) and quantification (h, n = 3 independent experiments) of puromycin incorporation and YRDC expression in GSC456 and GSC23 cells with or without YRDC knockdown cultured in the indicated medium for 72 h. i, Immunoblots showing p-mTORS2448, mTOR, p-eIF2αS51 and eIF2α expression in two GSC samples cultured in the indicated medium for 72 h. j, Northern blot showing tRNAThr charging levels in two GSCs cultured in the indicated medium for 72 h. Deacylated tRNA runs faster than aminoacyl-tRNA (aa-tRNA). nt, nucleotides. Suppl., supplementation. k, Threonine assay detecting intracellular threonine levels in the indicated cells (n = 3 biologically independent samples per group). ln, Immunoblots showing Flag and SDS expression (l), relative intracellular threonine levels (m) and MS analysis of t6A levels (n) in GSC456 cells with or without SDS–3× Flag overexpression (n = 3 independent experiments). Control medium, 800 μM threonine; 5×T medium, 4,000 μM threonine; 2×T medium, 1,600 μM threonine; TR medium, threonine-restricted medium. EV, empty vector; OE, overexpressed. In b,c,h,k,m,n, data are presented as mean ± s.d. In dg,i,j,l, blots are representative of three independent experiments with similar results. Two-tailed unpaired t-test for b,m,n. One-way ANOVA followed by multiple comparisons for c,h,k.
Fig. 5 |
Fig. 5 |. Threonine functions mainly through YRDC in GSCs.
a,b, PCA analysis of transcriptomic (a) and proteomic (b) data of GSC456 cells with or without YRDC knockdown cultured in control or threonine-restricted (TR, 4 μM, 72 h) medium. Solid circles indicate cells with normal YRDC expression. Dashed circles indicate cells with YRDC knockdown. Dim., dimension. cf, Volcano plot showing DEGs and differentially expressed proteins between GSC456 cells with intact YRDC expression cultured in control and threonine-restricted media (4 μM, 72 h) in transcriptomic data (c) and proteomic data (e). All genes were projected to the same comparison in GSC456 cells with YRDC knockdown in transcriptomic data (d) and proteomic data (f), and coloring indicates the status of these genes in c,e. Those DEGs and differentially expressed proteins from c,e that turned stable in d,f are defined as YRDC-dependent alterations. Cutoff, log2 |fold change| > 1 and adjusted (adj.) P < 0.05. gj, GO enrichment analysis of biological process (GOBP) of YRDC-dependent downregulated and upregulated genes upon TR (4 μM, 72 h) in transcriptomic data (g,h) and proteomic data (i,j) of GSC456 cells. IMP, inosine monophosphate; miRNA, microRNA; ncRNA, noncoding RNA; rRNA, ribosomal RNA; snRNP, small nuclear ribonucleoprotein. In a,c,d,g,h, transcriptomic data are from three biologically independent samples per group. In b,e,f,i,j, proteomic data are from four biologically independent samples per group.
Fig. 6 |
Fig. 6 |. Threonine and YRDC fuel mitosis with ANN codon bias.
a, Expression of ANN-decoding and non-ANN-decoding tRNA isodecoders in tRNA-seq of GSC456 cells upon YRDC knockdown. Data are from three biologically independent samples per group. CPM, counts per million. bd, ANN codon frequencies of differentially expressed proteins (b), Venn diagram of downregulated proteins (c) and ANN codon frequencies of overlapping differentially expressed proteins (d) in proteomics of GSC456 cells with the indicated treatments. e, GO enrichment of co-downregulated proteins from c. KD, knockdown; GOCC, GO cellular component. f, Comparison of transcriptomics and proteomics upon YRDC knockdown in GSC456 cells. Colored dots indicate translational dysregulation. Orange labels nine of 18 co-downregulated proteins that are downregulated at the translation level. g, Distribution of ANN codon frequencies in CDS. Orange dots indicate the nine proteins from f. h,i, Representative immunoblots from three independent experiments showing t6A targets in GSCs with the indicated treatments. j,k, Correlations between ANN codon occupancy alteration upon YRDC knockdown and TR at the ribosome A site (j) and the A + 1 site (k). Red dots show overlapping stalled codons. The black line shows linear regression. Ribosome profiling data are from two biologically independent samples per group. l,m, Codon frequencies of each ANN codon in humans. Coloring indicates the stalling status of ANN codons in j. np, Overlapping ANN codon frequencies of differentially expressed proteins in proteomics of GSC456 cells with the indicated treatments. q, Distribution of overlapping ANN codon frequencies in CDS. Orange dots indicate six t6A targets. r, Graphic illustration of two synonymous reporters. MSCV, murine embryonic stem cell virus promoter. Luc, luciferase; Rluc, Renilla luciferase. s,t, Luciferase activities of the indicated reporters and qPCR analysis of YRDC in 293T cells with the indicated treatments (n = 3 independent experiments). Data are presented as mean ± s.d. In a,b,d,np, boxes represent data within the 25th to 75th percentiles, whiskers depict the range of all data points, and horizontal lines within boxes represent median values. In bd,f,np, proteomic data are from four biologically independent samples per group. In f, transcriptomic data are from three biologically independent samples per group. Two-tailed unpaired t-test for a,s,t. Two-tailed Mann–Whitney test for b,d,np. Over-representation test corrected by FDR for e. Two-tailed Pearson correlation for j,k.
Fig. 7 |
Fig. 7 |. Dietary TR inhibits tumor growth.
a, Representative in vivo bioluminescence imaging (left) and quantification (right, n = 6 mice per group) of mice bearing the indicated xenografts. Images were acquired when the first neurological sign occurred in any cohort. Scale bar, 1 cm. b, Tumor growth curve from in vivo bioluminescence analysis of mice bearing the indicated xenografts (n = 5 mice per group). Data are presented as mean ± s.e.m. c, Kaplan–Meier survival curves of mice bearing the indicated xenografts (n = 6 mice per group for GSC456 cells and n = 5 mice per group for GSC468 cells). d, Cell viability of the indicated cells cultured in control or TR medium for 72 h. Data are from four independent experiments. eh, Representative in vivo bioluminescence imaging and quantification (e,f, n = 5 mice per group; scale bars, 1 cm) and representative images of hematoxylin and eosin (H&E)-stained brain sections (g,h; scale bars, 1 mm) of tumor-bearing mice fed the indicated diets. Data were acquired on day 21. i, Kaplan–Meier survival curves of tumor-bearing mice fed the indicated diet (n = 5 mice per group). j, MS analysis of tissue t6A levels of xenografts with the indicated dietary treatment (GSC456, n = 9 mice on the control diet and n = 8 mice on the TR diet; GSC468, n = 8 mice per group). km, Gating strategy (k), representative histogram plot (l) and statistical quantification (m) (GSC456, n = 5 mice on the control diet and n = 4 mice on the TR diet; GSC468, n = 4 mice per group) of in vivo OPP flow cytometric analysis of tumor cells from tumor-bearing mice fed the indicated diet. MFI, median fluorescence intensity. In a,df,j,m, data are presented as mean ± s.d. One-way ANOVA followed by multiple comparisons for a. Two-way ANOVA followed by multiple comparisons for b,d. Log-rank test for c,i. Two-tailed unpaired t-test for e,f,j,m.
Fig. 8 |
Fig. 8 |. Dietary intervention potentiates standard therapeutics.
ac, Graphic illustration (a), tumor growth curve from in vivo bioluminescence analysis (b, n = 5 mice per group) and Kaplan–Meier survival curves (c, n = 5 mice per group) of GSC468-bearing mice with the indicated treatment. TMZ, temozolomide. d, Therapeutic efficacy prediction of drugs for YRDC (Methods). The blue dot shows the top resistance drug, and red dots show the top sensitive drugs for high YRDC expression. e, Kaplan–Meier survival curves (n = 5 mice per group) of GSC468-bearing mice with the indicated treatment. f,g, Immunoblots showing YRDC expression in GBM (T), matched peripheral tissues (P), non-neoplastic epilepsy tissues (N), benign meningioma (BM) and glioma with different grades. h, Representative immunohistochemistry staining showing YRDC expression in LGG and GBM. Scale bar, 100 μm. i,j, Heatmap showing the activities of translational regulation pathways in RNA-seq data of TCGA_GBM and the GTEx brain cortex (i). The pathway used for inferring translational activity is colored red in i and compared in j. k,l, Violin plot of translational activity in RNA-seq data of TCGA_LGG, GBM (grade II, n = 216; grade III, n = 241; grade IV, n = 152) (k) and the CGGA (grade II, n = 188; grade III, n = 255; grade IV, n = 249) (l). m, Kaplan–Meier survival curves of CGGA_GBM (IDH wild type) based on YRDC mRNA expression. The top 25% and the bottom 25% are defined as high and low groups, respectively. MST, median survival time; m, months. n, Pearson correlation of YRDC expression and translational activity in RNA-seq data of CGGA_GBM (IDH wild type) (n = 183). The red line shows linear regression. o, Graphic abstract of this study. In b, data are presented as mean ± s.e.m. In jl, violin plots represent the overall distribution of data points. In in, the n number indicates patients. In fh, data are representative of three independent experiments with similar results. Two-way ANOVA followed by multiple comparisons for b. Log-rank test for c,e,m. Two-tailed Pearson correlation for d,n. Two-tailed unpaired t-test for j. One-way ANOVA followed by multiple comparisons for k,l.

References

    1. Tan AC et al. Management of glioblastoma: state of the art and future directions. CA Cancer J. Clin. 70, 299–312 (2020). - PubMed
    1. Mathur R et al. Glioblastoma evolution and heterogeneity from a 3D whole-tumor perspective. Cell 187, 446–463 (2024). - PMC - PubMed
    1. Gimple RC, Yang K, Halbert ME, Agnihotri S & Rich JN Brain cancer stem cells: resilience through adaptive plasticity and hierarchical heterogeneity. Nat. Rev. Cancer 22, 497–514 (2022). - PubMed
    1. Truitt ML & Ruggero D New frontiers in translational control of the cancer genome. Nat. Rev. Cancer 16, 288–304 (2016). - PMC - PubMed
    1. Saba JA, Liakath-Ali K, Green R & Watt FM Translational control of stem cell function. Nat. Rev. Mol. Cell Biol. 22, 671–690 (2021). - PubMed