. 2024 Mar 22;25(1):77.
doi: 10.1186/s13059-024-03212-y.

Depletion of lamins B1 and B2 promotes chromatin mobility and induces differential gene expression by a mesoscale-motion-dependent mechanism

Affiliations

Depletion of lamins B1 and B2 promotes chromatin mobility and induces differential gene expression by a mesoscale-motion-dependent mechanism

Emily M Pujadas Liwag et al. Genome Biol. .

Abstract

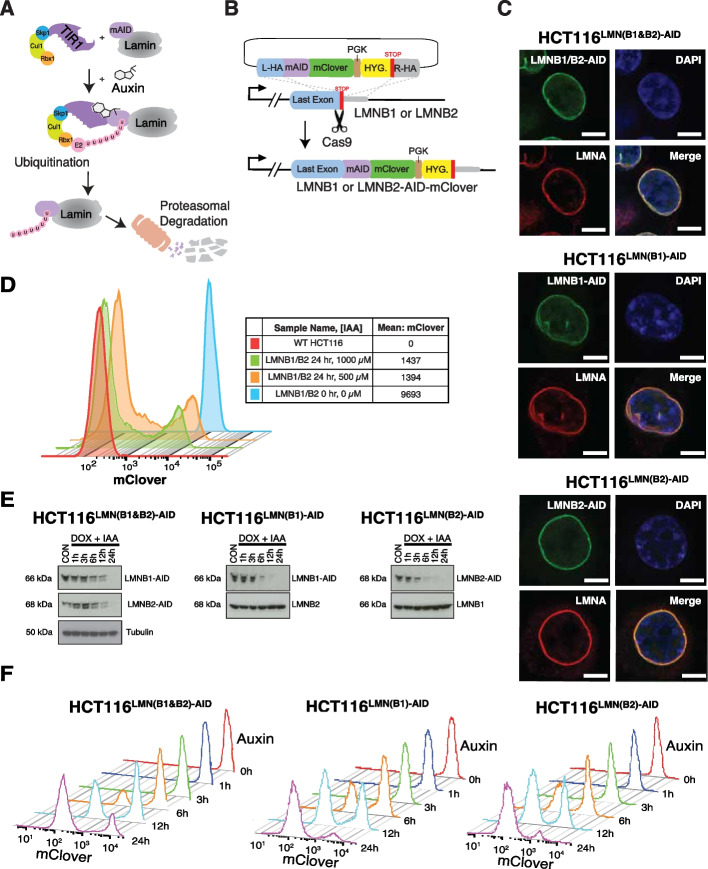
Background: B-type lamins are critical nuclear envelope proteins that interact with the three-dimensional genomic architecture. However, identifying the direct roles of B-lamins on dynamic genome organization has been challenging as their joint depletion severely impacts cell viability. To overcome this, we engineered mammalian cells to rapidly and completely degrade endogenous B-type lamins using Auxin-inducible degron technology.

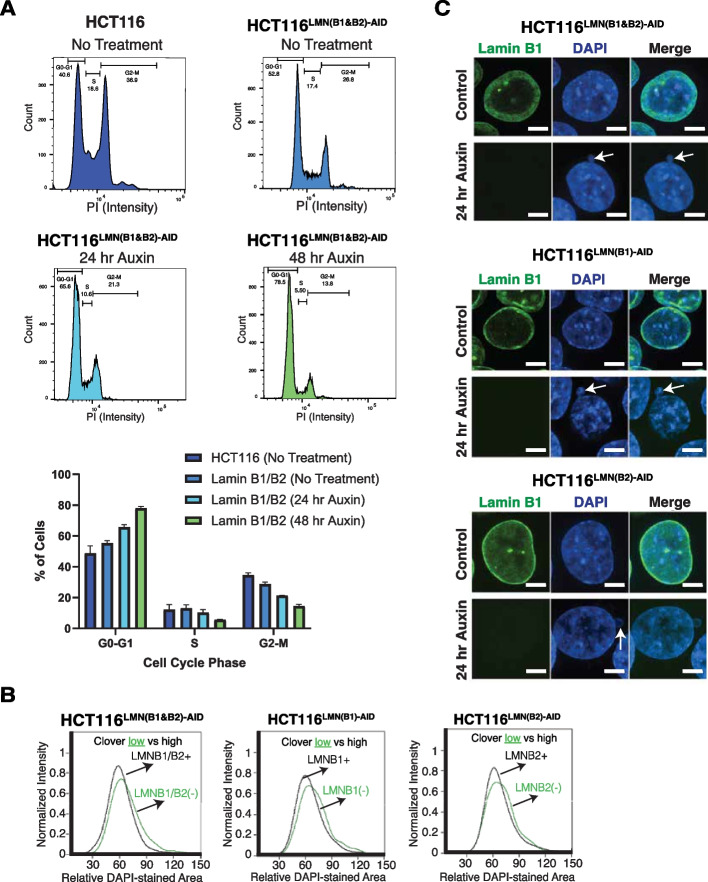
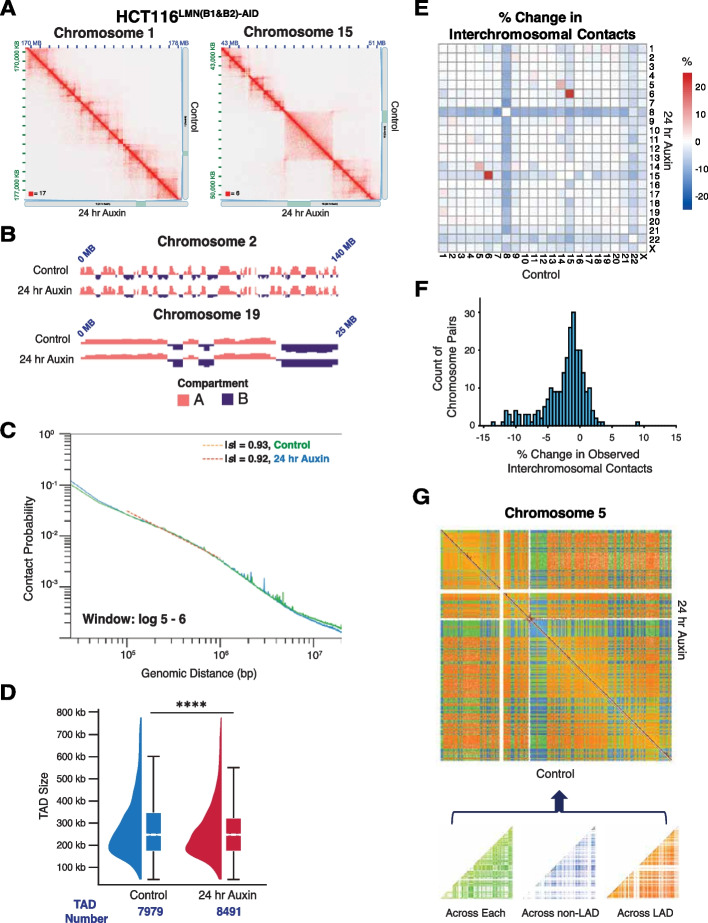
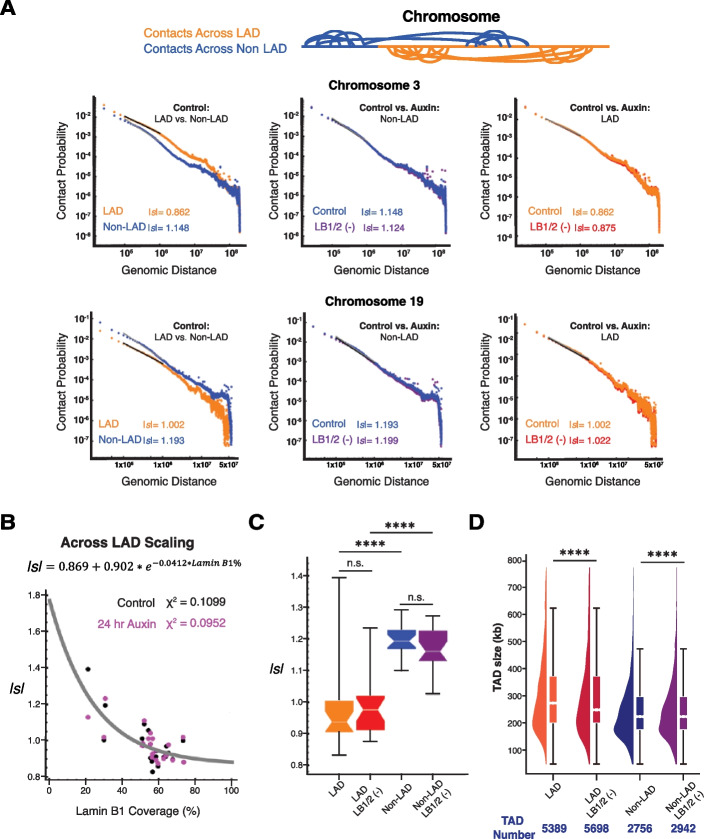
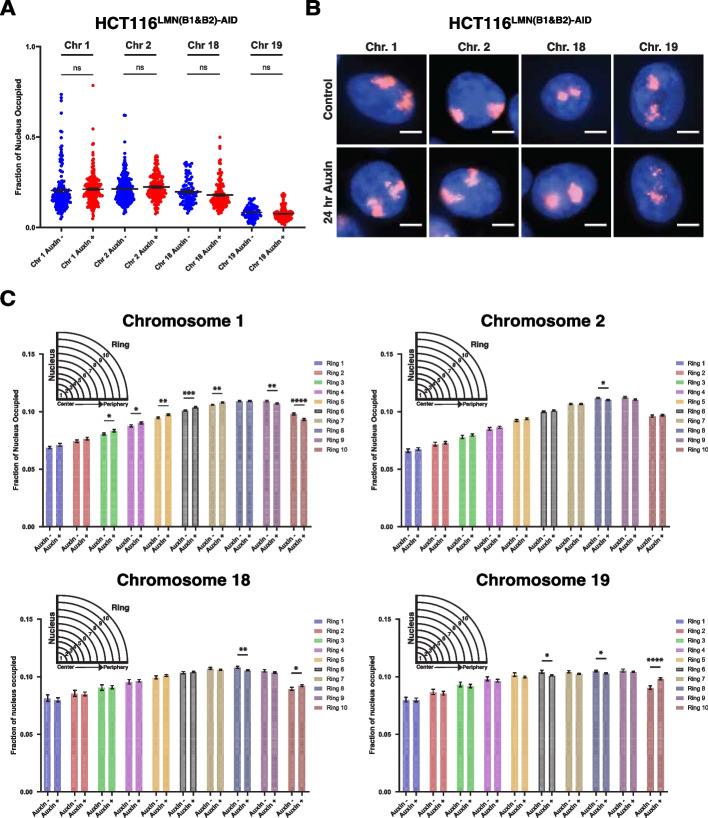
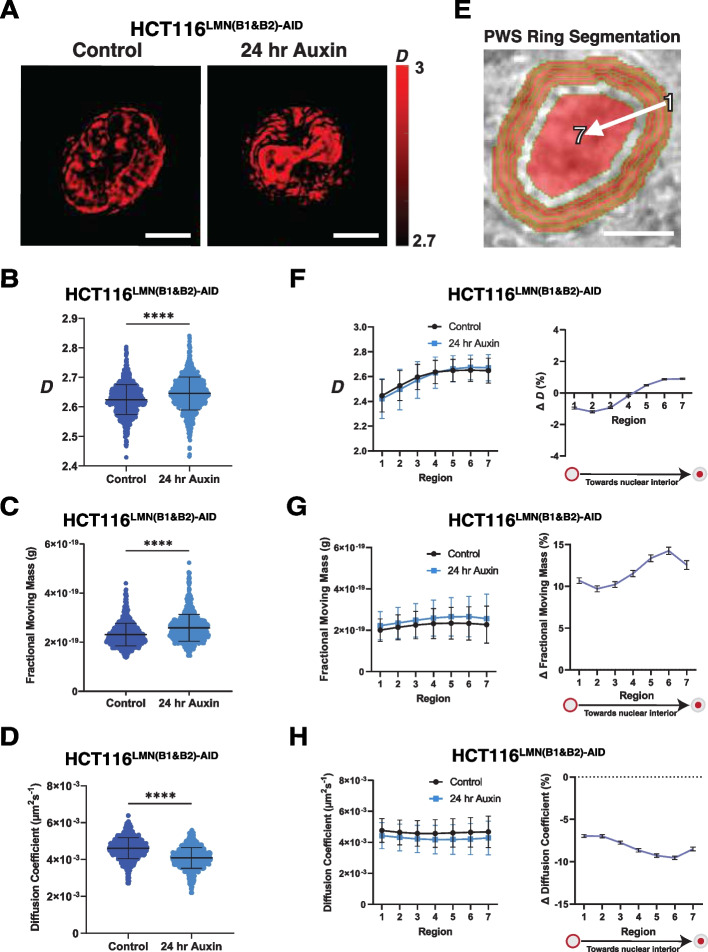
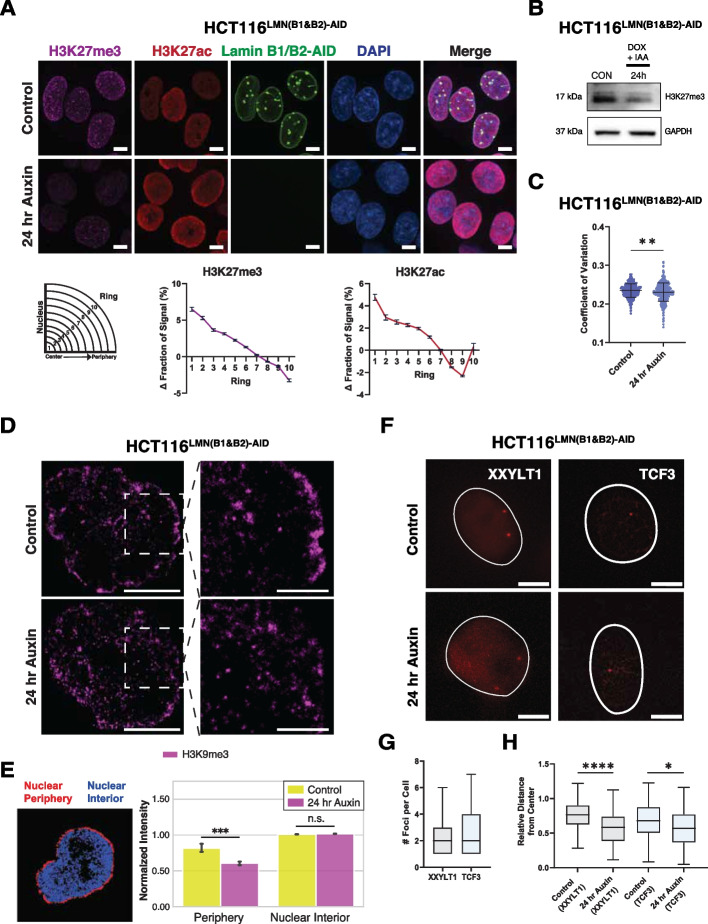
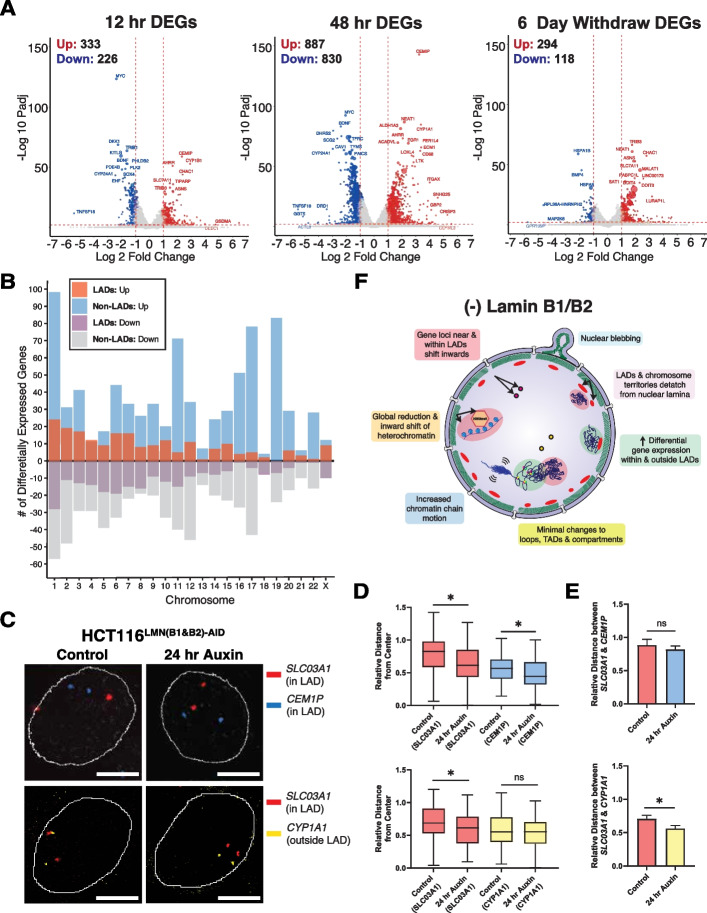
Results: Using live-cell Dual Partial Wave Spectroscopic (Dual-PWS) microscopy, Stochastic Optical Reconstruction Microscopy (STORM), in situ Hi-C, CRISPR-Sirius, and fluorescence in situ hybridization (FISH), we demonstrate that lamin B1 and lamin B2 are critical structural components of the nuclear periphery that create a repressive compartment for peripheral-associated genes. Lamin B1 and lamin B2 depletion minimally alters higher-order chromatin folding but disrupts cell morphology, significantly increases chromatin mobility, redistributes both constitutive and facultative heterochromatin, and induces differential gene expression both within and near lamin-associated domain (LAD) boundaries. Critically, we demonstrate that chromatin territories expand as upregulated genes within LADs radially shift inwards. Our results indicate that the mechanism of action of B-type lamins comes from their role in constraining chromatin motion and spatial positioning of gene-specific loci, heterochromatin, and chromatin domains.

Conclusions: Our findings suggest that, while B-type lamin degradation does not significantly change genome topology, it has major implications for three-dimensional chromatin conformation at the single-cell level both at the lamina-associated periphery and the non-LAD-associated nuclear interior with concomitant genome-wide transcriptional changes. This raises intriguing questions about the individual and overlapping roles of lamin B1 and lamin B2 in cellular function and disease.

Keywords: 3D chromatin organization; Auxin-inducible degron system; CRISPR-Sirius; in situ Hi-C; Lamin-associated domains; Nuclear lamina; Partial Wave Spectroscopic Microscopy; Topologically associated domains.


Conflict of interest statement

The authors declare that they have no competing interests.

Figures

Fig. 1
Fig. 1
Auxin treatment allows for B-type lamin degradation without affecting Lamin A localization. A Schematic illustration showing the AID system. Auxin treatment promotes the interaction between OsTIR1 and the degron tag (mAID), which is fused to the target protein. This results in rapid degradation of the target protein(s) upon proteasomal mediated poly-ubiquitination. B Schematic illustration of creating the cell lines. Each gene of interest was targeted for degradation by co-transfecting progenitor cells with the donor template plasmid with Cas9 and sgRNAs targeting the STOP codon of the sequence. C Immunostaining of AID-tagged lamin proteins in relation to LMNA. Green: LMNB1/B2-AID, LMNB1-AID, and LMNB2-AID. Red: LMNA. Blue: DAPI staining. The maximum intensity projections of nuclear Z stacks are shown. Scale bars = 10 μm. Data are representative of two independent biological replicates (N = 2). D Flow cytometric analysis to determine the optimal auxin concentration ([IAA]) for maximal degradation of LMNB1 and LMNB2 in fixed HCT116LMN(B1&B2)−AID cells. At least 20,000 events were recorded during the experiment. E Western blot analysis shows drastically reduced AID-tagged B-type lamins within 24 h of auxin (IAA) treatment. Doxycycline (DOX) was added 24 h prior to IAA to induce OsTIR1 expression. Tubulin was used as a loading control. Data are representative of three independent biological replicates (N = 3). F Flow cytometric analysis to determine the optimal auxin treatment time for maximal degradation of LMNB1 and LMNB2 in fixed HCT116LMN(B1&B2)−AID, HCT116LMN(B1)−AID, and HCT116LMN(B2)−AID cells. At least 20,000 events were recorded during the experiment
Fig. 2
Fig. 2
Loss of B-type lamins induces cell cycle arrest and altered nuclear morphology. A Propidium iodine staining in HCT116 and HCT116.LMN(B1&B2)−AID cells to assess the percentages of cells in G1, S, and G2/M phase. Data are representative of three independent biological replicates (N = 3). B Flow cytometric analysis to measure relative DAPI-stained nuclear area from data collected with the ImageStreamX after 8 h of auxin treatment. Black: auxin-treated cells containing high mClover intensity. Green: auxin-treated cells with low or no mClover intensity. At least 20,000 events were recorded during the experiment. C Immunofluorescence shows the presence of nuclear blebbing in B-type lamin-deficient cells. Scale bar = 5 μm. Data are representative of three independent biological replicates (N = 3)
Fig. 3
Fig. 3
Mesoscale chromatin structure is overall preserved upon B-type lamin degradation. A Representative normalized Hi-C trans-interaction matrices for chromosomes 1 and 15 in the control and 24-h auxin treatment conditions are shown for HCT116LMN(B1&B2)−AID cells. 15 kb resolution. B The eigenvectors for chromosomes 2 and 19 located at the nuclear periphery and interior, respectively, are shown. Pink: A compartment. Purple: B compartment. Eigenvectors computed by Juicer are the first eigenvector of the correlation matrix of the binned Hi-C contacts. C Contact probability scaling for HCT116LMN(B1&B2)−AID cells are shown for the control and 24-h auxin treatment conditions. Absolute values of s are indicated. D Raindrop plot comparing TAD sizes for the control and 24-h treatment conditions as revealed by TopDom. The number of TADs for each condition is indicated below the plot. Error bars: SEM. Significance was calculated by paired t test (**** < 0.0001). E Normalized Hi-C trans-interaction matrix demonstrating proximity of chromosome territories. The heatmap scale indicates the % change in interchromosomal contacts before and after 24-h auxin treatment in HCT116LMN(B1&B2)−AID cells. F Histogram demonstrating % change in interchromosomal contacts before and after 24-h auxin treatment in HCT116.LMN(B1&B2)−AID cells. G The Hi-C trans-interaction matrix demonstrates contacts across LAD segments, non-LAD segments and contacts across both segments for chromosome 5. The schematic under the matrix shows the partitioning of contacts across LAD segments and non-LAD segments for a representative chromosome. For A–G: Data was pooled from two independent biological replicates (N = 2)
Fig. 4
Fig. 4
Loss of B-type lamins has a negligible impact on genome connectivity. A Contact scaling for chromosomes 3 and 19 located at the nuclear periphery and nuclear interior, respectively, is shown. The left plots indicate contact scaling for each chromosome in the untreated condition to compare LAD and non-LAD segments. The middle and right plots indicate contact scaling for each chromosome to compare the control (untreated) and 24-h auxin treatment conditions in HCT116.LMN(B1&B2)−AID cells. Absolute values of s are indicated. B Scatter plot of the inverse relationship between lamin B1 coverage and |s| in LAD segments. The exponential distribution (gray curve) is fitted to the merged control (black) and 24-h auxin treatment condition (purple) samples. C Contact scaling within LADs and non-LADs for both the control (untreated) and 24-h auxin treatment conditions. Error bars: SEM. The line within each box represents the median; the outer edges of the box are the 25th and 75th percentiles and the whiskers extend to the minimum and maximum values. Significance of the differences in observed frequencies was calculated by unpaired t test (n.s. = not significant; **** < 0.0001). D Raindrop plot comparing TAD sizes for the control and 24-h treatment conditions as revealed by TopDom. The number of TADs for each condition/ segment is indicated below the plot. Error bars: SEM. Significance was calculated by paired t test (**** < 0.0001). For A–D, data was pooled from two independent biological replicates (N = 2)
Fig. 5
Fig. 5
Reduced levels of B-type lamins increases chromatin mobility at the nuclear periphery. A Scatterplot of nuclear fraction occupied by chromosomes 1, 2, 18, and 19 before and after 24-h auxin treatment. Error bars: SEM. Data was compiled from three independent biological replicates (N = 3). Significance was calculated by unpaired t test (n.s. = not significant). (Chr. 1 (Control n = 165; Auxin n = 195), Chr. 2 (Control n = 203; Auxin n = 174), Chr. 18 (Control n = 89; Auxin n = 148), Chr. 19 (Control n = 120; Auxin n = 83)). The violin plots extend from the minimum to the maximum value. The line in the middle of each plot is the median value of the distribution, and the lines above and below are the third and first quartiles, respectively. Each dot represents one cell. B Representative immunofluorescence images of HCT116.LMN(B1&B2)−AID cells visualized through the hybridization of chromosome paints. Data are representative of two independent biological replicates (N = 2). C Graphing of the average fraction and SEM of each chromosome fluorescent signal present in each one of ten concentric nuclear rings (ring 1: most central, ring 10: most peripheral). Data was compiled from two independent biological replicates (N = 2). Significance was calculated by unpaired t test (* < 0.05; ** < 0.01; *** < 0.001; **** < 0.0001). (Chr. 1 (Control n = 165; Auxin n = 195), Chr. 2 (Control n = 203; Auxin n = 174), Chr. 18 (Control n = 89; Auxin n = 148), Chr. 19 (Control n = 120; Auxin n = 83))
Fig. 6
Fig. 6
Dual-PWS reveals differential chromatin packing scaling and dynamics upon B-type lamin degradation. A Representative PWS images of HCT116LMN(B1&B2)−AID cells before and after 24-h auxin treatment. Scale bar = 5 μm. Data are representative of three independent biological replicates (N = 3). B Violin plots for chromatin packing scaling (D) in HCT116LMN(B1&B2)−AID cells before and after 24-h auxin treatment. C Violin plots for fractional moving mass in HCT116LMN(B1&B2)−AID cells before and after 24-h auxin treatment. D Violin plots for diffusion coefficient in HCT116LMN(B1&B2)−AID cells before and after 24-h auxin treatment. E Segmentation for PWS regional analysis. Region 1 is the nuclear periphery while region 7 is the nuclear interior. Scale bar = 5 μm. F Regional PWS measurements and percent changes of D in HCT116LMN(B1&B2)−AID cells before and after 24-h auxin treatment. Error bars: SD. G Regional PWS measurements and percent changes of fractional moving mass in HCT116LMN(B1&B2)−AID cells before and after 24-h auxin treatment. Error bars: SD. H Regional PWS measurements and percent changes of the diffusion coefficient in HCT116LMN(B1&B2)−AID cells before and after 24-h auxin treatment. Error bars: SD. For B–H: Data was compiled from three independent biological replicates (N = 3). Significance was calculated by unpaired t test with Welch’s correction applied (**** < 0.0001). (Control n = 953; Auxin n = 869). The truncated violin plots in B–D extend from the minimum to the maximum value. The line in the middle of each plot is the median value of the distribution, and the lines above and below are the third and first quartiles, respectively. Each dot represents one cell
Fig. 7
Fig. 7
Chromatin decompaction promotes redistribution of heterochromatin and gene loci upon auxin treatment. A Immunostaining of H3K27me3 and H3K27ac in HCT116LMN(B1&B2)−AID cells before and after 24-h auxin treatment. Graphing of the average fraction and SEM of fluorescent signal present in each one of ten concentric nuclear rings is shown below. Magenta: H3K27me3. Red: H3K27ac. Green: Lamin B1/B2-AID. Blue: DAPI staining. Maximum intensity projections of nuclear Z stacks and % changes between concentric rings are shown. Scale bars = 5 μm. Error bars: SD. Data are representative of two independent biological replicates (N = 2). (H3K27me3 (Control n = 455; Auxin n = 510), H3K27ac (Control n = 448; Auxin n = 447)). B Western blot analysis of H3K27me3 in HCT116LMN(B1&B2)−AID cells. Doxycycline (DOX) was added 24 h prior to IAA to induce OsTIR1 expression. GAPDH was used as a loading control. Data are representative of three independent biological replicates (N = 3). C Coefficient of variation plot for HCT116LMN(B1&B2)−AID cells showing chromatin decompaction upon 24 h of auxin treatment. Data was compiled from three independent biological replicates (N = 3). Significance was calculated by unpaired t test (**** < 0.0001). (Control n = 798; Auxin n = 845). Violin plots extend from the minimum to the maximum value. The line in the middle of each plot is the median value of the distribution, and the lines above and below are the third and first quartiles, respectively. Each dot represents one cell. D STORM images of HCT116LMN(B1&B2)−AID cells before and after 24-h auxin treatment with zoomed-in views of the nuclear periphery. Magenta: H3K9me3. Scale bars = 5 µm, Scale bars (zoom) = 2 µm. E Quantification of Normalized STORM Intensity (NSI) with a representative segmentation for the nuclear periphery (red) and nuclear interior (blue). Error bars: SD. Significance was calculated by unpaired t test (*** < 0.001). (Control n = 5; Auxin n = 5). F Representative CRISPR-Sirius images of gene loci XXYLT1 and TCF3 in live HCT116LMN(B1&B2)−AID cells. Scale bar = 5 μm. Data are representative of two independent biological replicates (N = 2). G Boxplot showing the number of foci per cell for XXYLT1 and TCF3 loci (XXYLT1 n = 42; TCF3 n = 25). H Box plot showing distances of XXYLT1 and TCF3 foci to the nuclear center. Significance was calculated by Mann–Whitney test (* < 0.05; **** < 0.0001) (XXYLT1 (Control n = 115; Auxin n = 65), TCF3 (Control n = 116; Auxin n = 32)). For G,H, data was compiled from two independent biological replicates (N = 2). The line within each box represents the mean; the outer edges of the box are the 25th and 75th percentiles and the whiskers extend to the minimum and maximum values
Fig. 8
Fig. 8
B-type lamin loss induces differential gene expression within and outside of LADs. A Volcano plots of DEGs after 12 h of auxin treatment, 48 h of auxin treatment, and 6 days of auxin withdrawal in HCT116LMN(B1&B2)−AID cells (adjusted P value < 0.01 and absolute log fold change > 1). B Bar plot of DEGs within or outside of LADs for each chromosome across all treatment time points. C Representative FISH images of gene loci within or outside of LADs in HCT116LMN(B1&B2)−AID cells. Scale bar = 5 μm. Data are representative of two independent biological replicates (N = 2). D Box plots of relative distances of SLC03A1, CEM1P, and CYP1A foci to the nuclear center (Control SLC03A1 (top) n = 50; Auxin SLC03A1 (top); n = 70; Control CEM1P n = 66; Auxin CEM1P n = 70; Control SLC03A1 (bottom) n = 116; Auxin SLC03A1 (bottom) n = 110; Control CYP1A1 n = 115; Auxin CYP1A1 n = 111)). The line within each box represents the mean; the outer edges of the box are the 25th and 75th percentiles and the whiskers extend to the minimum and maximum values. E Bar plots showing the relative distances between SLC03A1 and CEM1P foci and SLC03A1 and CYP1A1 foci (Mean + SEM). (SLC03A1 & CEM1P (Control n = 39; Auxin n = 57), SLC03A1 & CYP1A1 (Control n = 78; Auxin n = 57)). For D, E, data was compiled from two independent biological replicates (N = 2). Significance was calculated by Mann–Whitney test (* < 0.05). F Proposed model of the effect of Lamin B1 and B2 degradation on chromatin organization. Loss of B-type lamins induces nuclear blebbing and stalled cell cycle progression, indicating their structural and functional importance as components of the nuclear periphery. Although mid-range chromatin folding (e.g., TAD # and size, A/B compartmentalization, and contact probabilities in and outside LADs) is preserved, loss of these proteins promotes increased chromatin mobility along with an inward shift of chromosome territories (e.g., Chr. 1 and 2), heterochromatin-associated domains (e.g., LADs), and gene loci (red and yellow circles), especially at the nuclear periphery. The resulting genome-wide transcriptional changes both within and outside of LADs may be a direct consequence of heterochromatin redistribution and/or gene repositioning in relation to LADs upon the loss of structural constraints at the nuclear periphery

Update of

Similar articles

Cited by

References

    1. Nuebler J, Fudenberg G, Imakaev M, Abdennur N, Mirny LA. Chromatin organization by an interplay of loop extrusion and compartmental segregation. Proc Natl Acad Sci. 2018;115(29):E6697–E6706. doi: 10.1073/pnas.1717730115. - DOI - PMC - PubMed
    1. Rao SS, Huntley MH, Durand NC, Stamenova EK, Bochkov ID, Robinson JT, et al. A 3D map of the human genome at kilobase resolution reveals principles of chromatin looping. Cell. 2014;159(7):1665–1680. doi: 10.1016/j.cell.2014.11.021. - DOI - PMC - PubMed
    1. Bajpai G, Pavlov DA, Lorber D, Volk T, Safran S. Mesoscale phase separation of chromatin in the nucleus. ELife. 2021;10:e63976. doi: 10.7554/eLife.63976. - DOI - PMC - PubMed
    1. Laghmach R, Di Pierro M, Potoyan DA. The interplay of chromatin phase separation and lamina interactions in nuclear organization. Biophys J . 2021;120(22):5005–5017. doi: 10.1016/j.bpj.2021.10.012. - DOI - PMC - PubMed
    1. Shevelyov YY, Ulianov SV. The Nuclear Lamina as an Organizer of Chromosome Architecture. Cells. 2019;2:136. doi: 10.3390/cells8020136. - DOI - PMC - PubMed

Publication types